Git Product home page Git Product logo

matgeom's Introduction

MatGeom

MATLAB geometry processing library in 2D/3D.

DOI

MatGeom is a library for geometry processing / geometric computing with MATLAB in 2D and 3D. MatGeom is a “function-based” library: it contains several hundreds of functions for the creation, manipulation and display of 2D and 3D shapes such as point sets, lines, ellipses, polygons, 3D polygonal meshes, ... The official homepage for the project is http://github.com/mattools/matGeom.

A user manual containing a large number of illustrations and examples is available. Starting from February 2022, the HTML pages of the functions (obtained with m2html) are available here.

The MatGeom library corresponds to the concatenation of the "geom2d" and "geom3d" libraries that were distributed on the FileExchange. Distribution as a single library greatly facilitates the interoperability of the functions.

If you use matGeom, you might cite it as follows:

David Legland et al. (2023) "MatGeom library for geometric computing with MATLAB" DOI: 10.5281/zenodo.7799184

Package organization

The library is organized into several modules:

  • geom2d - General functions in Euclidean plane
  • polygons2d - Functions operating on polygons and polylines represented as list of vertices
  • graphs - Manipulation of geometric graphs
  • geom3d - General functions in 3D Euclidean space
  • meshes3d - Manipulation of 3D polygonal meshes (trimesh, quadmesh, or more generic meshes)

Quick overview

Basic functionalities comprise creation of simple geometries such as points, lines, ellipses... An example is provided in the following script.

% load data
data = load('fisheriris');
pts = data.meas(:, [3 1]);
% display
figure; axis equal; hold on; axis([0 8 3 9]);
drawPoint(pts, 'bx');
% Fit line
line = fitLine(pts);
drawLine(line, 'color', 'k', 'linewidth', 2);
% Draw oriented box
obox = orientedBox(pts);
drawOrientedBox(obox, 'color', 'k', 'linewidth', 1);
% identifiy species index
[labels, ~, inds]= unique(str.species);
% for ech species, compute equivalent ellipse and display with axes
colors = [1 0 0; 0 0.8 0; 0 0 1];
for i = 1:3
    pts_i = pts(inds == i, :);
    drawPoint(pts_i, 'marker', 'x', 'color', colors(i,:), 'linewidth', 2);
    elli = equivalentEllipse(pts_i);
    drawEllipse(elli, 'color', colors(i,:), 'linewidth', 2)
    drawEllipseAxes(elli, 'color', colors(i,:), 'linewidth', 2)
end

Computation of equivalent ellipses, oriented box, and fitting line from set of points

It is possible to work with more complex shapes such as polygonal lines ("polylines") or polygons. Common operations comprise smoothing, simplification (retaining only a selection of vertices), computation of convex hull or of intersections with other geometric primitives. A summary of typical operations in presented in the following script.

% read polygon data as a numeric N-by-2 array
poly = load('leaf_poly.txt');

% display the polygon using basic color option
figure; axis equal; hold on; axis([0 600 0 400]);
drawPolygon(poly, 'k');

% Bounding box of the polygon
poly_bnd = boundingBox(poly);
drawBox(poly_bnd, 'k');

% computes convex hull of polygon vertices
poly_hull = convexHull(poly);
drawPolygon(poly_hull, 'LineWidth', 2, 'Color', 'k');

% applies smoothing to the original polygon.
poly_smooth = smoothPolygon(poly, 51);
drawPolygon(poly_smooth, 'color', 'b', 'linewidth', 2);

% Computes a simplified version of the polygon
poly_simpl = simplifyPolygon(poly, 20);
drawPolygon(poly_simpl, 'color', 'r', 'linewidth', 2);
drawVertices(poly_simpl, 'Color', 'k', 'Marker', 's', 'MarkerFaceColor', 'w');

% compute intersections with an arbitrary line
line = createLine([0 250], [600 350]);
drawLine(line, 'k');
inters = intersectLinePolygon(line, poly_simpl);
drawPoint(inters, 'Color', 'r', 'Marker', 'o', 'MarkerFaceColor', 'w', 'linewidth', 2);

Summary of polygon processing operations: smoothing, simplification, convex hull, intersection with lines.

matgeom's People

Stargazers

 avatar  avatar  avatar  avatar  avatar  avatar  avatar  avatar  avatar  avatar  avatar  avatar  avatar  avatar  avatar  avatar  avatar  avatar  avatar  avatar  avatar  avatar  avatar  avatar  avatar  avatar  avatar  avatar  avatar  avatar  avatar  avatar  avatar  avatar  avatar  avatar  avatar  avatar  avatar  avatar  avatar  avatar  avatar  avatar  avatar  avatar  avatar  avatar  avatar  avatar  avatar  avatar  avatar  avatar  avatar  avatar  avatar  avatar  avatar  avatar  avatar  avatar  avatar  avatar  avatar  avatar  avatar  avatar  avatar  avatar  avatar  avatar  avatar  avatar  avatar  avatar  avatar  avatar  avatar  avatar  avatar  avatar  avatar  avatar  avatar  avatar  avatar  avatar  avatar  avatar  avatar  avatar  avatar  avatar  avatar  avatar  avatar  avatar  avatar  avatar

Watchers

 avatar  avatar  avatar  avatar  avatar  avatar  avatar  avatar  avatar  avatar  avatar  avatar  avatar  avatar  avatar  avatar  avatar  avatar  avatar  avatar  avatar

matgeom's Issues

Orientations (yaw, pitch and roll) are very different for similar 3D points

Hi David:

I needed your help really bad.

I have two 3D point clouds that are oriented very similarly. When I use the orientedbox3d,

% Zero center the point cloud data
pcMean  = mean(ptCloudWork.Location, 1);
pcZeroCentered = bsxfun(@minus, ptCloudWork.Location, pcMean);
% Find the axis-orientation of the point cloud
OOBB = orientedBox3d(double(pcZeroCentered));

the orientations, yaw. pitch and roll angles are very different. Aren't they should be similar?
Figure 1,
OOBB1 = -2.7616 -1.2016 -3.5781 223.5262 215.7089 54.8219 -178.3561 1.8756 -7.0416
Figure 3,
OOBB3 = 0.9134 -1.2887 -5.8636 216.6893 214.4492 62.4261 -87.0472 8.7291 -178.4361

Below are figures 1 and 3:
Oriented box 3D

The main objective is to re-orient the point clouds parallel to XY, YZ, and XZ planes. Below is the code snippet that does it.

% Transformation matrix
deg = [OOBB(7)  OOBB(8) OOBB(9)];
mat1 = eulerAnglesToRotation3d(deg,axes);
rotMatNew = inv(mat1);
ptCloudNew.Location = transformPoint3d(pcZeroCentered, rotMatNew);

The reorientation yaw, pitch and roll angles are:
Figure 2,
OOBB2 = 2.9106 1.5406 -3.3209 223.5262 215.7089 54.8219 -0.0000 0.0000 0.0000
Figure 4,
OOBB4 = -2.8909 -0.9726 5.6143 283.9288 286.8387 62.4261 -134.6658 -0.0000 0.0000

Output figures after re-orientation are below. They should reorient similar to figures 1 and 3 (by planes). But what I am getting is totally different.
Reoriented box 3D

How do get aligned point clouds to figure 1 and 3 that are reoriented parallel to XY, YZ, and XZ planes?

@dlegland, Please help. I need to fix this soon to get a project going.

Documentation on how to cite the work

We would like to cite this work in a publication but it's not clear from the Github site what your preferred way to do this would be. Could you please consider adding (say) a Zenodo DOI and/or publishing the work through an outlet such as JOSS so the work can be acknowledged formally?

Add option to rotation3dToEulerAngles to check if rotation matrix contains scaling or reflection?

Hi David

I was thinking about implementing an option to check in rotation3dToEulerAngles if the rotation matrix contains scaling or reflection (see: isTransform3d(TFM, 'rotation', 1))

What do you think? Should this check by default be true and throw an error or warning?
IMO it should be true since the reconversion from the euler angles to the rotation matrix won't produce the same input rotation matrix.
How would you call the parameter: 'ScalingReflection', 'RotationOnly', 'PureRotation'?

If it does not make sense at all to calculate euler angles if the matrix contains scaling or reflection we simply could add the following line to rotation3dToEulerAngles:
addRequired(p, 'mat', @(x) isTransform3d(x, 'rotation', true));

Kind regards

non-recursive simplifyPolyline

Hi,
The geometry package in GNU Octave had since long a simplifyPolyline function implementing non-recursive
Here is the code
https://sourceforge.net/p/octave/geometry/ci/release-3.0.0/tree/inst/polygons2d/simplifyPolyline.m

Now that geometry is trying to mirror matgeom we found out that matGeom now has its own implementation (but recursive).

Would you accept defining a upper level simplifyPolyline which accepts 'method' as an optional argument which allows the user to select recursive or non-recursive algorithm?
In this way we could have both implementations. This allows for long time checks of performance (time , memory) and borderline cases.
Otherwise one could just bechmark the two implementations (spoiler, non-recursive is faster) and decide for one.

The need to have the Octave implementation is not to get a penalty in runtime due to the implementation in matGeom, but let matGeom use the algorithm they like.

intersectPlaneMesh for >2 faces per edge?

Hey David!

I'm not sure whether this is the place to post.. Forgive me if it isn't.

Is there a way to cut a mesh that has edges with >2 faces? There is a mesh I wish to intersect with a plane that has 3 faces per edge in some areas, but is throwing errors because of that.

I have the vertex and face mat files if needed to recreate.

Cheers!

Ben

clipMeshVertices and isolated vertices

Hi David

Is it intended that the output of clipMeshVertices contains isolated (non indexed) vertices?

If not, trimMesh could be added before output.

Kind regards
oqilipo

use of delaunayTriangulation in nndist

The function nndist uses delaunayTriangulation instead of just delaunay (1)

nndist only requires the connectivity list and makes no use at all of any object property of the result (line 59 and later in nndist). This makes nndist pay the price of constructing the object without any reasons to do so.

The object construction is avoided by replacing line 59 with

DT = delaunay (points);

and later uses of DT.ConnectivityList with just DT

Delete changelog.txt(s) ?

Are the changelog.txt files in

  • geom2d
  • geom3d
  • meshes3d
  • polygons2d

still required or can they be deleted?
Or should they be merged into CHANGELOG.md?

Wrong result from createBasisTransform

I noticed some weird behaviour in createBasisTransform (see code below).
When calculating the transform from a plane with a Z-normal to an Y-normal, I get the wrong affine transform. Is this normal behaviour?
I'm using Matlab R2017b.

p1 = createPlane([0 0 0],[0 0 1]);

% create points in XY plane
pnts1 = [-1 -1 0;
          1 -1 0;
          1  1 0;
         -1  1 0];
     
drawPoint3d(pnts1);
drawPlane3d(p1);
% --> points are all in the XY plane

% create YZ plane (X-normal)
p2 = createPlane([0 0 0],[1 0 0]);

% transform points
t2 = createBasisTransform3d(p1,p2);
pnts2 = transformPoint3d(pnts1,t2);
% --> points are all in the YZ plane

hold on
drawPoint3d(pnts2);
drawPlane3d(p2);
hold off

% create XZ plane (Y-normal)
p3 = createPlane([0 0 0],[0 1 0]);

% transform points
t3 = createBasisTransform3d(p1,p3);
pnts3 = transformPoint3d(pnts1,t3);
% --> for some reason points are still in the YZ plane

hold on
drawPoint3d(pnts3);
drawPlane3d(p3);
hold off

drawEdge3d on app opens a new figure

First I'm grateful for your effort in bringing such a great tool, it's so useful and well written!

I'm having a little issue with the drawEdges3D that I call from an app with axis as first input.

Because of this line:

parseDrawInput(edges, isEdge3d, 'line', defOpts, varargin{:});

And the call to parseDrawInput without axis as first input to it, it calls to gca wich then opens a figure because the current figure is an app and gca can't return that...

I tried to fix this manually but simply putting hAx as first input won't work because it makes the code behave completely differently when first input is axis and when it's not...

Do you think the refactoring can be done?
If it's to difficult I'll probably just close the figure after my call to drawEdge, but I wanted you to know.

input order of angles of drawEllipse3d

Hi David

For me it seems a little bit inconsistent (and it was quite confusing ;-) ) that drawEllipse3d uses the order:
THETA PHI PSI as input
while other functions like rotation3dToEulerAngles, drawEllipsoid, drawCuboid use:
PHI THETA PSI

Wouldn't it make more sense to use PHI THETA PSI as standard in all functions?
http://mathworld.wolfram.com/EulerAngles.html

Kind regards
oqilipo

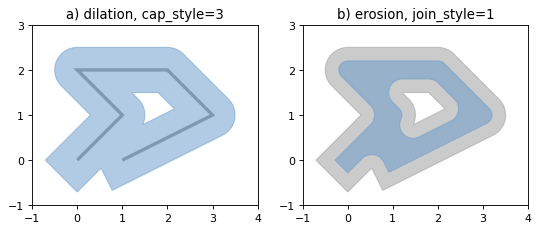
[Question/ Enhancement] Possibility to dilate a geometry?

Is it possible with matGeom to buffer/ dilate an object by a given distance?

Im thinking of something similar to this feature from a Python Module called shapely:

object.buffer(distance, resolution=16, cap_style=1, join_style=1, mitre_limit=5.0, single_sided=False)
Returns an approximate representation of all points within a given distance of the this geometric object.
https://shapely.readthedocs.io/en/stable/manual.html#object.buffer

Regards,
John

Feature: expand transformation matrix to 4x4xN ?

Hi David

What do you think about expanding the transformation matrices to a third dimension [4x4xN]?

That would introduce the possibility to transform multiple points [Nx3], vectors [Nx3], etc. with multiple transformation matrices [4x4xN].

Kind regards

False results of intersectLinePolygon function for

line = [-2 -2 -1 -1];
poly = [0 0;10 0;10 10;0 10;0 0];
plot([line(1) line(3)], [line(2) line(4)],'-o');
hold on;
plot(poly(:,1),poly(:,2));
res = intersectLinePolygon(line, poly)

res =

 0     0
10    10

result is [0 0] and [10 10].

Given line is a line segment. So it is limited betwen [-2 -2] and [-1 -1]

So result should be empty.

fault intersections

getting started on octave

Hi
I'm working a code in Octave, and need some features from matgeom. Mainly the capability to draw many contiguous boxes, with square faces on top, and different depths. I already downloaded the main 1.2.5 version files, and corresponding manual, and read the README file here on Github and made all of my effort to get it working, but still can't do it. Is there a clear way on which I can start using the functions? do I have to run a file, or many of the files from the "inst" folder that came with the package?

thanks in advance

First line of documentation ending in period?

The automatic documentation generator for the Octave Forge website, looks for a period to decide that the first line of the documentation is over.
Many docstrings in matgeom do not have the first sentence ending on period.

Would it be ok to have those ending with a period? If yes, I will request the merge.

fillPolygon doesn't handle holes correctly

Polygons with holes are not filled correctly,
The following was expected to fill the regions delimited by the red edges

pol = [
6.0000   3.6667
7.0000   4.0000
6.0000   5.0000
6.0000   6.0000
5.0000   6.0000
4.0000   7.0000
3.4000   6.0000
2.0000   6.0000
2.0000   3.6667
1.0000   2.0000
2.0000   2.3333
2.0000   2.0000
6.0000   2.0000
6.0000   3.6667
NaN      NaN
3.0000   3.8333
3.7000   5.0000
4.5000   5.0000
5.0000   4.5000
5.0000   3.8333
3.0000   3.1667
3.0000   3.8333
NaN      NaN
4.0000   3.0000
5.0000   3.3333
5.0000   3.0000
4.0000   3.0000
];
fillPolygon(pol, 'g')
drawPolygon(pol, 'r')

My suggestion is to add to matgeom the GNU Octave geometry function polygon2patch that handles all cases correctly.
As far as I can see, it is just a matter to adapting it to matgeom's code-stlye and matlab syntax. It is likely that the matgeom name would be polygon2Patch base don what I see in other conversion functions.

Bug in drawPoint when submitting a single point using the single argument format

The documentation gives as an example:
drawPoint([10 10]);

However this example fails with the error:

Index exceeds matrix dimensions.

Error in drawPoint (line 63)
if ~isnumeric (varargin{2})

There seems to be faulty logic on line 61 where it is assumed two arguments will be given if the first is a vector, when the expected behavior is that a vector with size (1x2) would be treated just like any other (Nx2) matrix with columns [x, y]. I would perhaps add a check for this edgecase.

Matlab 2017b: Name conflict warning for deprecated vecnorm.m

I've just installed 2017b and receive the following warning:

Warning: Function vecnorm has the same name as a MATLAB builtin. 
We suggest you rename the function to avoid a potential name conflict. 

May it be possible to remove the function from the toolbox?

matGeom\matGeom\deprecated\geom2d

Kind regards

renaming clipPolygon to cropPolygon

Hi all,

GNU Octave implements several interfaces to true polygon clipping1 while clipPolygon in matgeom is just cropping with a box. Would you agree to rename clipPolygon to cropPolygon and help porting the clipper version (mex interface)2 to matgeom (I can't test on matlab)?

Bugs in intersectEdges.m

I am using the lastest matGeom, in source code mmTrace\intersectEdges.m: 79
`
% Process colinear edges

% colinear edges may have 0, 1 or infinite intersection
% Discrimnation based on position of edge2 vertices on edge1
if sum(col) > 0
% array for storing results of colinear edges
resCol = Inf * ones(size(col));

% compute position of edge2 vertices wrt edge1
t1 = edgePosition(edge2(col, 1:2), edge1(col, :));
t2 = edgePosition(edge2(col, 3:4), edge1(col, :));

% control location of vertices: we want t1<t2
if t1 > t2
    tmp = t1;
    t1  = t2;
    t2  = tmp;
end

% edge totally before first vertex or totally after last vertex
resCol(col(t2 < -tol))  = NaN;
resCol(col(t1 > 1+tol)) = NaN;
    
% set up result into point coordinate
x0(col) = resCol(col);
y0(col) = resCol(col);

% touches on first point of first edge
touch = col(abs(t2) < tol);
x0(touch) = edge1(touch, 1);
y0(touch) = edge1(touch, 2);

% touches on second point of first edge
touch = col(abs(t1-1) < tol);
x0(touch) = edge1(touch, 3);
y0(touch) = edge1(touch, 4);

end
`

It is apparent that t1, t2 should be single-valued, but edgePosition() does not guaranty that.

I made the following change, could you please check and make sure the sementics are correct?

`
% Process colinear edges

% colinear edges may have 0, 1 or infinite intersection
% Discrimnation based on position of edge2 vertices on edge1
if sum(col) > 0
% array for storing results of colinear edges
resCol = Inf * ones(size(col));

% compute position of edge2 vertices wrt edge1
t1 = edgePosition(edge2(col, 1:2), edge1(col, :));
t2 = edgePosition(edge2(col, 3:4), edge1(col, :));

% control location of vertices: we want t1<t2
for ii = 1:size(t1, 1)
    if t1(ii, 1) > t2(ii, 1)
        t1_ii  = t2(ii);
        t2_ii  = t1(ii);
    else
        t1_ii  = t1(ii);
        t2_ii  = t2(ii);
    end

    % edge totally before first vertex or totally after last vertex
    resCol(col(t2_ii < -tol))  = NaN;
    resCol(col(t1_ii > 1+tol)) = NaN;

    % set up result into point coordinate
    x0(col) = resCol(col);
    y0(col) = resCol(col);

    % touches on first point of first edge
    touch = col(abs(t2_ii) < tol);
    x0(touch) = edge1(touch, 1);
    y0(touch) = edge1(touch, 2);

    % touches on second point of first edge
    touch = col(abs(t1_ii-1) < tol);
    x0(touch) = edge1(touch, 3);
    y0(touch) = edge1(touch, 4);

end

end
`

Ideas for additional functions

Only some ideas that came into my mind

geom3d - additional functions:

  • plane2 = transformPlane3d(plane, trans)

meshes3d - additional functions:

  • [meshAbove, meshInside, meshBelow] = cutMeshByPlane(mesh, plane)
    I could provide a function for this one

What do you think?

Kind regards
oqilipo

Intersection points with a polygon

Hi,

Why I can not get the intersection point of angles 0 and 270?

Code:

clc;
clear all;
close all;
% draw angle lines
xCenter = 17;
yCenter = 8;
poly = polyshape([ 15 15 20 15 10],[ 10 0 10 15 0]);
plot(poly)
poly1 = poly.Vertices;
hold on;
L=10; %Line length, can be changed
angle = 90; %Choose angle, can be more
  
for langle =  0:angle:359 
    langle
    x2=xCenter+ L * cosd(langle);
    y2=yCenter+ L * sind(langle);    
    line([xCenter,x2], [yCenter,y2], 'Color', 'r', 'LineWidth', 1);
    text(x2,y2,string(langle));
    lineseg = [xCenter x2  yCenter y2];
    P = intersectLinePolygon(lineseg, poly1) %https://www.mathworks.com/matlabcentral/mlc-downloads/downloads/submissions/7844/versions/27/previews/geom2d/polygons2d/intersectLinePolygon.m/index.html
    pause(1);
end

Thanks,
Elyraz

Speed up isCoplanar.m

Regarding current coplanar test in isCoplanar.m.
As discussed in GNU Octave scatter3 performance regression, the coplanar test can be done by SVD:

%allpoints = [x y z];
%NOTE: use bsxfun(@minus, ...) for old MATLAB or ancient Octave.
v = allpoints - mean(allpoints, 1);
sv = svd(v);
copl = sv(3) <= tolerance * sv(1);

The smallest singular value sv(3) has meaning of "standard deviation to the best fit plane". sv(1) and sv(2) is the spreading of the plane, i.e. plane size is roughly sv(1) x sv(2).

Time complexity of this SVD test is O(n), n = rows(allpoints) number of points involved in test. The nchoosek approach is probably O(n^4) in the worst case.

PS: in Octave, we need to partition the points into coplanar sets. So we choose eig for faster coplanar test, at the cost of accuracy.

Move data files to subfolder or data folder?

One could move data files like:

  • apple.ply
  • cube.ply
  • dodecahedron.obj
  • dodecahedron.ply
  • icosahedron.ply
  • mushroom.off
  • teapot.obj

into a subfolder "matGeom\matGeom\meshes3d\data" or data folder "matGeom\data\meshes3d" to separate them from the functions?

reversePlane

Hi

Am I right, that this function should change the direction of the plane normal?
If so, there is a bug.

plane = [0 0 0 1 0 0 0 1 0];

planeNormal(plane)

revPlane = reversePlane(plane);

planeNormal(revPlane)

results in:

reversePlane_test
ans =
     0     0     1
ans =
     0     0     1

Kind regards

help text for SPH2CART2 and SPH2CART2D has incorrect input order and function name

As per https://octave.discourse.group/t/error-in-sph2cart2d-function-help-in-package-matgeom-octave-6-1/724
and https://savannah.gnu.org/bugs/?60032

  1. the help text for SPH2CART2D says SPH2CART2 in the usage examples
  2. both functions list the input order for separate inputs as (THETA, PHI, RHO), and the order for the single input as S = [phi theta rho]. however, it appears from the first nargin == 1 block that the code treats inputs as (THETA, PHI, RHO) for both separate and single inputs. The SPH2CART2 help text indicates that an order change was made in the code in 2006, but it seems the help text was never updated to match.

wrong result in expandPolygon

Thanks for the toolbox, there is an wrong result when I use expandPolygon, the data of the polygon to be expanded is as follows, could you fix the problem? Thanks.
853.051180799598 1395.70358899983
846.846474586138 1395.32617807027
846.951002029201 1389.16946937456
847.049465466440 1383.00346819798
847.115303592170 1376.85448205073
847.212947131441 1370.65928019451
847.311508545437 1364.45976668292
847.403016456476 1358.24915772477
847.490919675847 1352.26606379952
847.584953624545 1346.07363613856
847.666275665442 1339.82100248509
839.484169584245 1331.11609184023
853.924979622264 1328.35348776418
861.608595085196 1330.39278847797
868.220412668110 1329.50225988558
875.875477336126 1326.86553173669
882.338554063435 1331.62175833310
889.962694098544 1329.23277737873
896.696359642413 1327.45790296303
903.937867677510 1326.07854037217
910.210804103418 1329.25401056939
917.917413331487 1327.91251671165
924.032548384970 1327.19436486693
932.054192215014 1325.47600388931
938.211349348105 1324.78402538707
945.488069284109 1327.43691050576
952.183413420216 1327.69255892283
959.337184914622 1323.21728444434
965.732226050554 1323.44919709893
972.831942294955 1326.13117367279
979.356603578110 1326.42560472448
979.301477969154 1332.27428590649
979.258237679396 1338.08098724113
979.227623462547 1344.09664403141
979.192051120088 1350.04053171916
979.148771060482 1356.00669735001
979.124731066183 1361.85792147696
979.097106343355 1367.81934911268
986.680635796704 1374.45102609546
986.654474782696 1380.53098978249
986.602625334353 1386.65544435229
978.966169852797 1385.47641307450
972.325964749230 1388.59563087441
965.302490493396 1385.07977832674
958.774456116715 1385.63363851896
951.700736139513 1389.15973097014
951.723116041675 1382.87960811503
945.005049508612 1376.57016973942
937.723477785087 1378.36022830346
931.468277816438 1380.20328535995
923.520177457719 1381.24829090188
923.468440200494 1387.14857325408
917.234096070951 1390.24501825771
909.557933099338 1393.58041646196
903.130645486550 1393.60003901443
895.986871658472 1395.16694597013
889.166864620724 1391.42160195927
881.631833239447 1392.92672170441
875.049612032251 1389.72316957465
867.427540314273 1393.69031472358
860.732283452133 1391.44404770828
853.051180799597 1395.70358899983

Here is my code:
poly2 = expandPolygon(poly, 15);
figure;
plot(poly(:, 1),poly(:, 2), 'linewidth', 2);
hold on; plot(poly2{1}(:, 1),poly2{1}(:, 2), 'm')
axis equal;

Version number in Contents.m of geom2d

The current version in the file is 1.0 dated from 21-Mar-2011. However, FileExchange provides version with number 1.23.1. Seems like releases are not published on GitHub.

test_intersectLineCircle failed

With 2016b

Running test_intersectLineCircle
.
================================================================================
Assertion failed in test_intersectLineCircle/testTangent and it did not run to completion.

    ---------------------
    Framework Diagnostic:
    ---------------------
    assertEqual failed.
    --> Sizes do not match.
        
        Actual size:
                 1     2
        Expected size:
                 2     2
    
    Actual double:
            15     0
    Expected double:
           NaN   NaN
           NaN   NaN

    ------------------
    Stack Information:
    ------------------
    In C:\dev\matGeom\tests\geom2d\test_intersectLineCircle.m (testTangent) at 37
================================================================================

drawEdge multiple edges

The following snippet when run in GNU Octave 5.1.0

E = randn (10, 4);
h = drawEdge(E);

produces and array h with 10 handles, but only one is valid (the last one), and a single edge is plotted. This is because drawEdge at no point sets the hold state of the axes.

Is this also the case in matlab?
Does matlab holds the contents of the axes in the following example?

plot (rand(10,1), 'o');
ax = gca ();
plot(ax, rand(10,1), 'x')

In Octave you only see the crosses.

Question regarding input of drawCylinder.m

Hi David

Why does drawCylinder supports the input of multiple Cylinders as cell and not as matrix since the size of one cylinder is 1x7. Hence, multiple cylinders could be stored in Nx7?

if iscell(cyl)
    res = zeros(length(cyl), 1);
    for i = 1:length(cyl)
        res(i) = drawCylinder(hAx, cyl{i}, varargin{:});
    end
    
    if nargout > 0
        varargout{1} = res;
    end    
    return;
end

Kind regards
oqilipo

intersectLineCircle fails with several lines and circles

Hi,
the following bug was reported in the matgeom package in Octave:

I am using GNU Octave with the package matgeom-1.2.2

If I use the function “intersectLineCircle(lines,circles)” with multiple lines and circles I find an error message
when in the array of lines one line has intersections with its corresponding circle and the subsequent line doesn’t.

e.g:

I use circles = [ 0 0 1 ; 0 0 1]
and lines = [ 0 0 1 0; 2 2 1 0]

then I get the error:

error: reshape: can’t reshape 4x1 array to 2x2x2 array

Inspection of the function intersectLineCircle.m in the package gives me the information that the problem likely
is in the conditional part:

if nCircles == 1
points = [...
line(1:2) + u(:,1) .* line(3:4); ...
line(1:2) + u(:,2) .* line(3:4)];
else
tmp = [...
line(valid, 1:2) + u(:,1) .* line(valid, 3:4) ...
line(valid, 1:2) + u(:,2) .* line(valid, 3:4)].';
points(:, :, valid) = permute(reshape(tmp, [2, 2, nCircles]), [2 1 3]);
end

And specifically in the “else” part.

I confirm that the following code fails with the mentioned error:

circles = [ 0 0 1 ; 0 0 1];
lines    = [ 0 0 1 0; 2 2 1 0];
intersectLineCircle (lines, circles)

Use struct with patch properties as 2nd input for drawPlane3d

I would like to use a struct with patch properties as 2nd input for drawPlane3d.

But with Matlab 2016a it doesn't seem to work,

Here is an example and the figure:

clearvars; close all

addpath(genpath('matGeom\matGeom\geom3d'))

% New figure
figure('Color','w')
axis equal; view(3)

% Plot a sphere
R=10;
C=50;
[X,Y,Z] = sphere;
[spherePatch.faces, spherePatch.vertices, ~]  = surf2patch(X*R+C,Y*R+C,Z*R+C);

% Define patch properties
patchProps.EdgeColor = 'k';
patchProps.FaceColor = [0.75 0.75 0.75];
patchProps.FaceAlpha = 0.75;

% Draw a sphere with patch properties
patch(spherePatch, patchProps);

% Create a plane
Plane = createPlane([C C C], [1 1 -1]);

% Draw the plane with default properties
drawPlane3d(Plane)

% Draw the plane with patch properties
drawPlane3d(Plane, patchProps)

drawplane3d

Thanks in advance

Recommend Projects

  • React photo React

    A declarative, efficient, and flexible JavaScript library for building user interfaces.

  • Vue.js photo Vue.js

    🖖 Vue.js is a progressive, incrementally-adoptable JavaScript framework for building UI on the web.

  • Typescript photo Typescript

    TypeScript is a superset of JavaScript that compiles to clean JavaScript output.

  • TensorFlow photo TensorFlow

    An Open Source Machine Learning Framework for Everyone

  • Django photo Django

    The Web framework for perfectionists with deadlines.

  • D3 photo D3

    Bring data to life with SVG, Canvas and HTML. 📊📈🎉

Recommend Topics

  • javascript

    JavaScript (JS) is a lightweight interpreted programming language with first-class functions.

  • web

    Some thing interesting about web. New door for the world.

  • server

    A server is a program made to process requests and deliver data to clients.

  • Machine learning

    Machine learning is a way of modeling and interpreting data that allows a piece of software to respond intelligently.

  • Game

    Some thing interesting about game, make everyone happy.

Recommend Org

  • Facebook photo Facebook

    We are working to build community through open source technology. NB: members must have two-factor auth.

  • Microsoft photo Microsoft

    Open source projects and samples from Microsoft.

  • Google photo Google

    Google ❤️ Open Source for everyone.

  • D3 photo D3

    Data-Driven Documents codes.