Git Product home page Git Product logo

complex-upset's Introduction

ComplexUpset

test codecov CRAN_version Conda version DOI

Quick links: Documentation | Installation | R examples | Python examples

Showcase

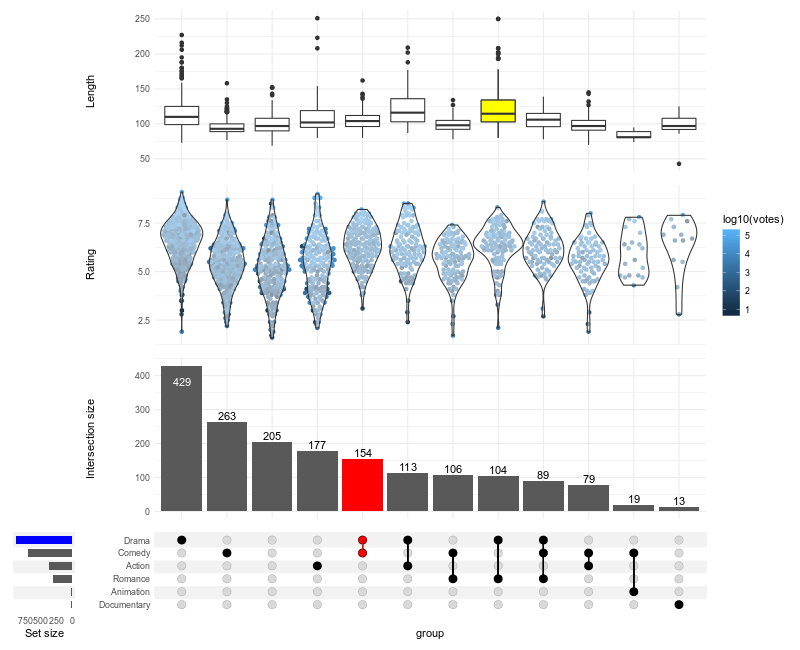
Get all the goodies of UpSetR, but with full extensibility of ggplot2.

Example UpSet plot

Click here to display the source code
library(ggplot2)
library(ComplexUpset)

if(!require(ggplot2movies)) install.packages('ggplot2movies')
movies = ggplot2movies::movies
genres = c('Action', 'Animation', 'Comedy', 'Drama', 'Documentary', 'Romance')

upset(
    movies,
    genres,
    annotations = list(
        'Length'=ggplot(mapping=aes(x=intersection, y=length)) + geom_boxplot(),
        'Rating'=ggplot(mapping=aes(x=intersection, y=rating))
            # if you do not want to install ggbeeswarm, you can use geom_jitter
            + ggbeeswarm::geom_quasirandom(aes(color=log10(votes)))
            + geom_violin(width=1.1, alpha=0.5)
    ),
    queries=list(
        upset_query(
            intersect=c('Drama', 'Comedy'),
            color='red',
            fill='red',
            only_components=c('intersections_matrix', 'Intersection size')
        ),
        upset_query(
            set='Drama',
            fill='blue'
        ),
        upset_query(
            intersect=c('Romance', 'Drama'),
            fill='yellow',
            only_components=c('Length')
        )
    ),
    min_size=10,
    width_ratio=0.1
)

The full list of examples is available in the documentation; it also contains instructions for the use from Python.

Install

To get the most recent version, open R and run:

if(!require(devtools)) install.packages("devtools")
devtools::install_github("krassowski/complex-upset")

Alternatively, to get a stable CRAN release (which may be one version behind at times):

install.packages('ComplexUpset')

Or, if you use conda/mamba:

conda install -c conda-forge r-complexupset

How it compares to other packages?

  • UpSetR is a powerful tool and the pioneer in the UpSet visualisations; it was not designed to be extended with ggplot components. Unfortunately, the repository is no longer active (for two years now).
  • ggupset uses scales to convert a single plot to upsets plots, e.g. with scale_x_upset - a really nice approach, recommended for simple ggplot.
  • a cowplot-based upset was demonstrated in an online publication, however cowplot (a great tool at the time) got superseded by even greater tool: patchwork, which is what is used by ComplexUpset.
  • ComplexHeatmap also offers a way to generate UpSet plots with annotations; while not ggplot2-centered, it provides extensive customization options, with a clear API. It may be the best choice if you already use it for heatmaps.

Use whichever tool you find the most useful for your particular use. The rational of making this repository public is not only to share the code, but also to demonstrate how simple it is now to create complex visualisations with patchwork (without the need to learn the ggplot internals).

For the interactive use, check out the VCG/upset. Regardless of the tool chosen, you may want to cite (Lex et al, 2014) when using UpSet plots, especially in fields still dominated by Venn diagrams.

Get inspired

Here are example publications and preprints including figures generated with this library:

The list is not meant to be exhaustive, but representative of applications to different fields, and of different usage ideas. You are welcome to add your own publication by suggesting an edit.

Testing

The unit tests are run with testhat, and the visual "doppelganger" tests use vdiffr.

The test cases for visual tests are auto-generated from the examples in the documentation; after changing or adding an example, please run:

  • scripts/prepare_for_tests.sh to generate updated test cases, and
  • scripts/manage_visual_tests.sh to validate the generated images.

Acknowledgements

Originally developed in course of a DPhil programme in Women's & Reproductive Health at OxfordNuffieldWRH.

complex-upset's People

Contributors

cyrillagger avatar krassowski avatar maximilian-heeg avatar milouarts avatar

Stargazers

 avatar  avatar  avatar  avatar  avatar  avatar  avatar  avatar  avatar  avatar  avatar  avatar  avatar  avatar  avatar  avatar  avatar  avatar  avatar  avatar  avatar  avatar  avatar  avatar  avatar  avatar  avatar  avatar  avatar  avatar  avatar  avatar  avatar  avatar  avatar  avatar  avatar  avatar  avatar  avatar  avatar  avatar  avatar  avatar  avatar  avatar  avatar  avatar  avatar  avatar  avatar  avatar  avatar  avatar  avatar  avatar  avatar  avatar  avatar  avatar  avatar  avatar  avatar  avatar  avatar  avatar  avatar  avatar  avatar  avatar  avatar  avatar  avatar  avatar  avatar  avatar  avatar  avatar  avatar  avatar  avatar  avatar  avatar  avatar  avatar  avatar  avatar  avatar  avatar  avatar  avatar  avatar  avatar  avatar  avatar  avatar  avatar  avatar  avatar  avatar

Watchers

 avatar  avatar  avatar  avatar  avatar  avatar  avatar  avatar

complex-upset's Issues

Put a geom_text related to the max intersection

Hi, I wanted to know how to situate a geom_text related to the max intersection of the plot.
Code:

'EDAD'=list(
  aes=aes(x=intersection, y=EDAD)
  ,geom=list(geom_boxplot()
             ,geom_hline(aes(yintercept = median(EDAD))
                         ,color='coral'
                         ,linetype="dashed")
             ,geom_text(aes(max(intersection),median(EDAD),label = round(median(EDAD),1), vjust = -1))
  )
)

Output:
It locates in the red circle, and wanted to situate it in the red arrow.
Screen Shot 2020-06-15 at 12 35 55

Change height of annotations

Hi, I wanted to know how to change the height of this annotations:
code:


UPSETPLOT<-upset(TRATAMIENTO_ANTI_COVID_CON_VMI
                 ,TRATAMIENTO_ANTI_COVID_COLUMNAS
                 ,width_ratio=0.1
                 ,name='TERAPIAS ANTI COVID19'
                 ,stripes=c("white", "#B4D5DE")
                 ,min_degree=0
                 ,keep_empty_groups = TRUE
                 ,base_annotations=list(
                   'Intersection size'=intersection_size(text_aes=aes(label=paste0(round(intersection_size/union_size * 100), "%|",intersection_size,"")))
                 )
                 ,themes=upset_modify_themes(
                   list(
                     'intersections_matrix'=theme(text=element_text(size=15)),
                     'overall_sizes'=theme(axis.text.x=element_text(angle=90))
                   ))
                 ,annotations = list(
                   'ESTADIA\nHOSPITALARIA'=list(
                     aes=aes(x=intersection, y=LOS_DIAS),
                     geom=geom_boxplot()
                   ),
                   'LETALIDAD'=list(
                     aes=aes(x=intersection, fill=FALLECIDOS)
                     ,geom=list(
                       geom_bar(stat='count', position='fill')
                       ,scale_fill_manual(values=as.vector(c(GRIS,ROJO)))
                       ,scale_y_continuous(labels=scales::percent_format())))
                 ))

output:
Screen Shot 2020-06-12 at 13 49 55

I need to obtain something like this:
Screen Shot 2020-06-12 at 14 06 36

sort intersections by degree?

Is it possible to sort intersections by degree? I would like to be able to sort the intersections with the highest degree first (e.g., have the intersection shared between the most number of sets come first). This is possible with in the UpSetR package with UpSetR::upset(order.by = "degree")

min_degree not working as intended

The parameter min_degree fails to work as intended. When given the parameter min_degree = 0, it will plot all intersections as expected included the case of the null set of intersections. However when given the parameter min_degree = 1, it will exclude not only the null set but any set consisting of just one intersection which removes the opportunity to exclude the null set.
0,0,0 0,0,0 0,0,1 0,1,0 0,1,1
When tested on the above csv, we get the following outcomes:
image
image
In my case, I am working with categorical data dealing with cases of a medical event which is massively sparse so the vast majority of people don't have any events recording but I need to exclude them in this analysis.
Hope that this can be resolved as otherwise I am very impressed with the package.

Add geom_text to geom_bar

Sorry about this basic question...
I have this:

annotations = list(
  'LETALIDAD'=list(
    aes=aes(x=intersection, fill=FALLECIDOS)
    ,geom=list(
      geom_bar(stat='count', position='fill')
      ,scale_fill_manual(values=as.vector(c(GRIS,ROJO)))
      ,scale_y_continuous(labels=scales::percent_format())))
)

Output:
Untitled

I need to add the geom_text in black color only in the red bars

upset doesn't show all overlapping elements in sets

Hi,

I've been trying to get upset to display all overlapping elements between sets but I can't, and its behaviour is puzzling:

# Example data
test <- data.frame(
  stringsAsFactors = FALSE,
           id_set1 = c("a", "b", "c", "d", "e", "f", "g", "h", "i", "j"),
           id_set2 = c(NA, NA, NA, NA, "e", NA, NA, "h", "i", "j"),
           id_set3 = c("a", "b", NA, "d", "e", "f", "g", "h", "i", "j"),
           id_set4 = c("a", "b", "c", "d", "e", "f", "g", "h", "i", "j")
        )

# Turn the values into Boolean
elements <- c("a", "b", "c", "d", "e", "f", "g", "h", "i", "j")

test2 = data.frame(
	set1 = ifelse(test[,1] %in% elements, 1, 0),
	set2 = ifelse(test[,2] %in% elements, 1, 0),
	set3 = ifelse(test[,3] %in% elements, 1, 0),
	set4 = ifelse(test[,4] %in% elements, 1, 0))

upset(test2, colnames(test2))

upset(test2, colnames(test2))

I thought that the height of the bars should show counts of common elements in the given sets (their intersections, in the sense of intersect()), but it doesn't. For example, the plot suggests there are five common elements in sets 1, 3 and 4. But we can see from the table that there are nine (the only missing element is c in set3). On the other hand, it correctly shows that there are four common elements across all four sets (e, h, i, j). Then again, sets 1 and 4 are identical, so they have ten common elements. Where does the 1 come from on the plot? (I also don't mention here that not all combination of sets are shown)

Could someone please clarify this behaviour?

kJ

sort_intersections_by degree than by cardinality

Hi- I just started playing with ComplexUpset (0.5.15), thank you - great stuff!

As per title, it would be useful to have the option to have columns in the intersection matrix ordered by degree than by cardinality. E.g. like sort_intersections_by = c('degree', 'cardinality').


Probably a separate feature request: It would be nice if the intersect parameter (or some other parameter) could take a list of lists of intersections and plot only those (similar to the original upset in UpSetR), optionally respecting the order in the outer list

In upset() plot: Vertical lines connecting dots are not displayed anymore

Hi Mike,

Today, noticed that
in the upset() plot everything is ok,
but
the vertical lines "connecting" any dots in a column
are not displayed anymore.

The black dots display fine,
but without "connector" lines btw them.

Ex:
Simple Upset Plot
(or with any other +complex example),
no vertical "connector" lines are shown btw dots.

upset(
movies, genres,
base_annotations=list('Intersection size'=intersection_size(counts=FALSE)),
min_size=100,
width_ratio=0.3
)

ComplexUpset pkg v 052,
w/ Ubuntu Linux 18.04, latest Rstudio and R.
see image below:

image

Missing 'x' argument in gsub

Hello,
First of all great package, I really like the extensibility of it !
I have discovered that the 'x' parameter in the gsub function in names_of_true is missing, which causes an error if the colnames contain a '-' character. Reprex is below:

test_frame<-data.frame(
  a = c(TRUE, TRUE, TRUE),
  b = c(FALSE, FALSE, FALSE),
  c = c(TRUE, FALSE, TRUE)
)

colnames(test_frame) <- c("a","b","C-")
apply(test_frame, 1, ComplexUpset::names_of_true)
#> Error in gsub("-", "_"): argument "x" is missing, with no default

#add name as 'x' parameter for gsub
names_of_true2<-function (row) 
{
  sanitized_names = c()
  for (name in names(which(row))) {
    if (grepl("-", name, fixed = TRUE)) {
      name = gsub("-", "_",name)
      if (name %in% names(which(row))) {
        stop("The group names contain a combination of minus characters (-) which could not be simplified; please remove those.")
      }
    }
    sanitized_names = c(sanitized_names, name)
  }
  paste(sanitized_names, collapse = "-")
}

apply(test_frame, 1, names_of_true2)
#> [1] "a-C_" "a"    "a-C_"

Created on 2020-03-31 by the reprex package (v0.3.0)

Additionally I was wondering what the reason was for using a for loop in this function as grepl and gsub support vector inputs, removing the for loop could have significant performance gains especially for very 'wide' data

#test_data 10 obs 4000 variables
test_data <-data.frame(replicate(4000,sample(c(TRUE,FALSE),10,rep=TRUE)))

#Simple mock-up
names_of_true3<-function (row)
{
  true_row_names <- names(which(row))
  fixed_row_names <- gsub("-","_",true_row_names)
  if(any(grepl("-",fixed_row_names, fixed = TRUE))) {stop("- detected")}
  
  paste(fixed_row_names, collapse = "-")
}

bench::mark(
  apply(test_data, 1, names_of_true3),
  apply(test_data, 1, ComplexUpset::names_of_true)
)
#> Warning: Some expressions had a GC in every iteration; so filtering is disabled.
#> # A tibble: 2 x 6
#>   expression                                           min  median `itr/sec`
#>   <bch:expr>                                       <bch:t> <bch:t>     <dbl>
#> 1 apply(test_data, 1, names_of_true3)               24.4ms  27.2ms     37.0 
#> 2 apply(test_data, 1, ComplexUpset::names_of_true) 124.1ms 129.8ms      7.76
#> # ... with 2 more variables: mem_alloc <bch:byt>, `gc/sec` <dbl>

Created on 2020-03-31 by the reprex package (v0.3.0)

Slow plotting of a big dataset (10^6 observations, 11 sets)

Hello,

thanks for this package, very cool looking and I am glad you help making live the upset concept in R. I have a dataset that looks like this:

              ID control D2A1 D2B3 D3A1 D4A3 D5B3 H2A3 H2C3 H4A4 H4C2 H5A3
3  Chrom_3_1398_C_T            1    0    0    0    0    0    0    0    0    1    0
10 Chrom_3_4061_A_T            0    1    1    1    1    0    1    1    1    1    1
11 Chrom_3_4064_C_T            0    1    1    1    1    0    1    1    1    1    1
12 Chrom_3_4065_G_A            0    1    1    1    1    0    1    1    1    1    1
13 Chrom_3_4069_C_T            0    1    1    1    1    0    1    1    1    1    1
14 Chrom_3_4093_A_C            1    1    1    1    1    0    1    1    1    1    1

Basically it's just a list of genomic mutations (ID column), across different biological samples (other columns).
My code is

sampName = list(colnames(DT3)[2:12])
upset(DT3, sampName, name='SNP', width_ratio=0.1)

The data set is roughly 1,5 million rows long and it seems to be taking forever to plot.

Consider renaming the parameters of intersection_size

intersection_size and intersection_ratio accept:

  • bar_number_threshold (could be bar_label_threshold?)
  • text and text_aes can be merged into a list, same way as annotations?
  • aest - rename to mapping?
  • text_colors - allow to specify one color for both easily

Maybe something like:

intersection_size(
  bar=list(aes=aes()),
  # could be "text" instead of "counts"
  counts=upset_counts(aes=aes(), on_bar_when_lt=0.75, geom=list()),
)

when counts=FALSE, then do not display counts. Remember to update upset_text_percentage.

Large counts numbers do not fit the bars

Hello, it's me again
I noticed sometimes the numbers displayed in the bars are not correct
example

The bar for the first intersection set is obviously not 39123 but more than 1 million. I would guess as the figure is big and doesn't fit inside the bar it's just chopped off.

Highlight the empty intersection

Is it possible to highlight the "empty" intersection / complement (i.e. the intersection where all the binary variable are false)?

There is no problem plotting the empty intersection, but none of these hypothetical queries, work:

upset_query(intersect = character(), fill='yellow')
upset_query(intersect = c(), fill='yellow')
upset_query(intersect = NA, fill='yellow')

Error message when running GitHub R example of ComplexUpset

Hi Mike, 

ComplexUpset is GREAT! .

A quick question...

...when I run your R code movies example,
in link: 
https://github.com/krassowski/complex-upset#showcase
(the example R source code just under the nice upset plot!...),

I get this error message:

[1] "Converting non-logical columns to binary: Action, Animation, Comedy, Drama, Documentary, Romance"
Error in stack.data.frame(data, intersect) : no vector columns were selected**

Yet,
ggplot2movies, beeswarm, etc. 
+all required pkgs are loaded ok...

Help! what am I missing?
sfd99
San Francisco
Ubuntu Linux 18.04,
latest versions of Rstudio and R.

Total numer of cases

Hello, I was wondering if you can add the total numer of cases in the insersection size plot. I mean the sum() each intersection size.
Thanks!

Highlight multiple intersections

Thanks for the great package. Is it possible to highlight / query multiple intersections in the intersection matrix using different color?

If I update the example from the doc, using

...
queries=list(
    upset_query(
      intersect=c('Drama', 'Comedy'),
      color='red',
      fill='red',
      only_components=c('intersections_matrix')
    ),
    upset_query(
      intersect=c('Romance', 'Drama'),
      color='yellow',
      only_components=c('intersections_matrix')
    )
  )
...

I receive the error

Error: Aesthetics must be either length 1 or the same as the data (4): colour

Thanks.

Add ignore_tag=TRUE to the intersection matrix

For better compatibility with plots composition, ignore_tag should be set on the intersection matrix; it should be optional. An article om composing multiple upset plots should be also added.

Order intersections

Is it possible to prespecify the order of the intersections? I know there are option sort_intersections and sort_intersections_by but they don't allow ordering by, say, a factor in the input data frame.
Thanks.

Causes error with knitr?

Hello,

I don't know if it's a knitr or upset issue, but trying to knit the Rstudio markdown returns

Quitting from lines 734-744 (NDPD_calling.Rmd) 
Error in `$<-.data.frame`(x, name, value) : 
  replacement has 0 rows, data has 1585017
Calls: <Anonymous> ... upset_data -> $<- -> $<-.data.table -> $<-.data.frame
In addition: Warning message:
In get_engine(options$engine) :
  Unknown language engine 'bas' (must be registered via knit_engines$set()).
Execution halted

Here is the code of lines 734 - 744

DT2 = DT%>%mutate_at(-1, ~case_when(grepl('^0/1', .) ~ 1L, 
                           grepl('^0/0', .) ~ 0L,     
                           grepl('^1/1', .) ~ 1L, 
                           TRUE~ NA_integer_))
sum(Reduce('|', lapply(DT2, is.na)))
DT3 = na.omit(DT2)
DT3 = as.data.table(DT3)
sampName = list(colnames(test)[2:12])
upset(DT3, sampName, name='SNP', width_ratio=0.5, min_size=1000, sort_sets=FALSE)

Commenting out the upset command resolves the error message.

Add an example showing how to display counts on "Set size"s

Based on the suggestion from #23 (comment) by @sfd99.

One quick solution:

upset(
    movies, genres,
    min_size=10,
    set_sizes=upset_set_size(
        geom=function(...) {
            list(
                geom_bar(...),
                geom_text(..., aes(label=..count..))
            )
        },
        stat='count'
    )
)

but I will also consider:

  • adding a dedicated helper function
  • a new parameter to upset_set_size
  • and other possible ways of achieving that without modifying the package

How to use the aes parameter?

Hello,

this code

upset(DT3, sampName, name='SNP', width_ratio=0.5, min_size=1000, sort_sets=FALSE, 
      base_annotations=list(
        'Intersection size'=intersection_size(text_colors=c(on_background='black', on_bar='black')
        ),
        queries=list(
          upset_query(set='H4A4', fill=vc[2]), upset_query(intersect = sampName, color=vc[3], fill=vc[3], only_components=c('intersections_matrix', 'Intersection size'))
        )
      )
    )

returns:

Error: Mapping should be created with `aes() or `aes_()`.

It seems to be expecting an aesthetic mapping for fill and color argument? I am just trying to color some bars and intersections as per the doc:

upset(
    movies, genres, name='genre', width_ratio=0.1, min_size=10,
    annotations = list(
        'Length'=list(
            aes=aes(x=intersection, y=length),
            geom=geom_boxplot()
        )
    ),
    queries=list(
        upset_query(
            intersect=c('Drama', 'Comedy'),
            color='red',
            fill='red',
            only_components=c('intersections_matrix', 'Intersection size')
        ),
        upset_query(
            set='Drama',
            fill='blue'
        ),
        upset_query(
            intersect=c('Romance', 'Comedy'),
            fill='yellow',
            only_components=c('Length')
        )
    )
)

Highlight covers on-bar counts

I might be doing something wrong, but it seems that if a bar on the intersection sizes plot is highlighted, then any on-bar counts are hidden.

In the example below, the count is on the bar for the first 2 bars, but when the second is highlighted the count isn't visible on that one. I tried changing the text colours, but it didn't have any effect on the highlighted bar.

library(ggplot2)
library(ComplexUpset)
model <-
  data.frame(
    guess = c(T,T,T,T,F,F,F,F),
    real  = c(F,T,T,T,T,F,T,T)
  )

upset(
  model,
  intersect = c("guess", "real"),
  queries = list(
    upset_query(
      intersect = c("guess", "real"),
      fill = "blue"
    ),
    upset_query(
      intersect = NA,
      fill = "blue"
    )
  )
)

Created on 2020-06-18 by the reprex package (v0.3.0)

Double/dodged bars

Great package!

I'm wondering if there is an easy way to have two side-by-side bars for each intersection?
I have my observed data that I want to mainly plot, but by each intersection I want the expected (based on my null model) intersection size so that I can clearly see how different the observed is from the expected. Sometimes expected is > observed and sometimes < observed so the stacked bars isn't clear for that.

Don't use hyphens in variable names

I don't know why it behaves like this, but if you use eg Co-amoxiclav instead of Co amoxiclav - you get an incorrect upset plot where all of the points of Co-amoxiclav are missing. Using Co amoxiclav fixes this. Took me about an hour to work out what was going on here so hopefully helpful to someone else (maybe even easily fixable).

Error in unlist(intersect) : object 'genres' not found

Using the sample data from the readme:

library(ggplot2)
library(ComplexUpset)


ComplexUpset::upset(
  movies,
  genres,
  annotations = list(
    'Length'=list(
      aes=aes(x=intersection, y=length),
      geom=geom_boxplot()
    ),
    'Rating'=list(
      aes=aes(x=intersection, y=rating),
      geom=list(
        # if you do not want to install ggbeeswarm, you can use geom_jitter
        geom_jitter(aes(color=log10(votes))),
        geom_violin(width=1.1, alpha=0.5)
      )
    )
  ),
  queries=list(
    upset_query(
      intersect=c('Drama', 'Comedy'),
      color='red',
      fill='red',
      only_components=c('intersections_matrix', 'Intersection size')
    ),
    upset_query(
      set='Drama',
      fill='blue'
    ),
    upset_query(
      intersect=c('Romance', 'Drama'),
      fill='yellow',
      only_components=c('Length')
    )
  ),
  min_size=10,
  width_ratio=0.1
)

I get the following error:

Error in unlist(intersect) : object 'genres' not found

Is this related to the ggplot2 update?

Here is my sessionInfo():

R version 3.6.2 (2019-12-12)
Platform: x86_64-apple-darwin15.6.0 (64-bit)
Running under: macOS Catalina 10.15.2

Matrix products: default
BLAS:   /System/Library/Frameworks/Accelerate.framework/Versions/A/Frameworks/vecLib.framework/Versions/A/libBLAS.dylib
LAPACK: /Library/Frameworks/R.framework/Versions/3.6/Resources/lib/libRlapack.dylib

locale:
[1] en_US.UTF-8/en_US.UTF-8/en_US.UTF-8/C/en_US.UTF-8/en_US.UTF-8

attached base packages:
[1] stats     graphics  grDevices utils     datasets  methods   base     

other attached packages:
[1] ComplexUpset_0.4.0 ggplot2_3.3.0.9000 testthat_2.3.2     devtools_2.2.2     usethis_1.5.1     

loaded via a namespace (and not attached):
 [1] Rcpp_1.0.3        compiler_3.6.2    pillar_1.4.3      prettyunits_1.1.1 remotes_2.1.1    
 [6] tools_3.6.2       digest_0.6.25     pkgbuild_1.0.6    pkgload_1.0.2     memoise_1.1.0    
[11] lifecycle_0.2.0   tibble_2.1.3      gtable_0.3.0      pkgconfig_2.0.3   rlang_0.4.5      
[16] cli_2.0.2         rstudioapi_0.11   patchwork_1.0.0   withr_2.1.2       dplyr_0.8.5      
[21] desc_1.2.0        fs_1.3.2          tidyselect_1.0.0  rprojroot_1.3-2   grid_3.6.2       
[26] glue_1.3.1        R6_2.4.1          processx_3.4.2    fansi_0.4.1       sessioninfo_1.1.1
[31] purrr_0.3.3       callr_3.4.2       magrittr_1.5      backports_1.1.5   scales_1.1.0     
[36] ps_1.3.2          ellipsis_0.3.0    assertthat_0.2.1  colorspace_1.4-1  munsell_0.5.0    
[41] crayon_1.3.4     

Single legend for side-by-side plots?

Thanks for this great package. I really like the ability to stack the intersection plots and I have been looking for something like this for a long time. I'm presenting two upsets side-by-side, but I would like like to be able to show a single legend. In the image below I would like to have just one legend showing the colors for the phyla.
Thanks! Chuck
image

custom titles

I can't find a way to change the words "Intersection size" at the y-axis. Would be great to have an option to set all the titles manually, same as in ggplot. Or if I am blind, please show me the way.
Thank you in advance

Recommend Projects

  • React photo React

    A declarative, efficient, and flexible JavaScript library for building user interfaces.

  • Vue.js photo Vue.js

    🖖 Vue.js is a progressive, incrementally-adoptable JavaScript framework for building UI on the web.

  • Typescript photo Typescript

    TypeScript is a superset of JavaScript that compiles to clean JavaScript output.

  • TensorFlow photo TensorFlow

    An Open Source Machine Learning Framework for Everyone

  • Django photo Django

    The Web framework for perfectionists with deadlines.

  • D3 photo D3

    Bring data to life with SVG, Canvas and HTML. 📊📈🎉

Recommend Topics

  • javascript

    JavaScript (JS) is a lightweight interpreted programming language with first-class functions.

  • web

    Some thing interesting about web. New door for the world.

  • server

    A server is a program made to process requests and deliver data to clients.

  • Machine learning

    Machine learning is a way of modeling and interpreting data that allows a piece of software to respond intelligently.

  • Game

    Some thing interesting about game, make everyone happy.

Recommend Org

  • Facebook photo Facebook

    We are working to build community through open source technology. NB: members must have two-factor auth.

  • Microsoft photo Microsoft

    Open source projects and samples from Microsoft.

  • Google photo Google

    Google ❤️ Open Source for everyone.

  • D3 photo D3

    Data-Driven Documents codes.