krassowski / complex-upset Goto Github PK
View Code? Open in Web Editor NEWA library for creating complex UpSet plots with ggplot2 geoms
License: MIT License
A library for creating complex UpSet plots with ggplot2 geoms
License: MIT License
Hello, I was wondering if you can add the total numer of cases in the insersection size plot. I mean the sum() each intersection size.
Thanks!
Thanks for the great package. Is it possible to highlight / query multiple intersections in the intersection matrix using different color?
If I update the example from the doc, using
...
queries=list(
    upset_query(
      intersect=c('Drama', 'Comedy'),
      color='red',
      fill='red',
      only_components=c('intersections_matrix')
    ),
    upset_query(
      intersect=c('Romance', 'Drama'),
      color='yellow',
      only_components=c('intersections_matrix')
    )
  )
...
I receive the error
Error: Aesthetics must be either length 1 or the same as the data (4): colour
Thanks.
Hello,
this code
upset(DT3, sampName, name='SNP', width_ratio=0.5, min_size=1000, sort_sets=FALSE,
      base_annotations=list(
        'Intersection size'=intersection_size(text_colors=c(on_background='black', on_bar='black')
        ),
        queries=list(
          upset_query(set='H4A4', fill=vc[2]), upset_query(intersect = sampName, color=vc[3], fill=vc[3], only_components=c('intersections_matrix', 'Intersection size'))
        )
      )
    )
returns:
Error: Mapping should be created with `aes() or `aes_()`.
It seems to be expecting an aesthetic mapping for fill and color argument? I am just trying to color some bars and intersections as per the doc:
upset(
    movies, genres, name='genre', width_ratio=0.1, min_size=10,
    annotations = list(
        'Length'=list(
            aes=aes(x=intersection, y=length),
            geom=geom_boxplot()
        )
    ),
    queries=list(
        upset_query(
            intersect=c('Drama', 'Comedy'),
            color='red',
            fill='red',
            only_components=c('intersections_matrix', 'Intersection size')
        ),
        upset_query(
            set='Drama',
            fill='blue'
        ),
        upset_query(
            intersect=c('Romance', 'Comedy'),
            fill='yellow',
            only_components=c('Length')
        )
    )
)
So the user can narrow down the intersections to the size range of interest.
Hello, it's me again
I noticed sometimes the numbers displayed in the bars are not correct
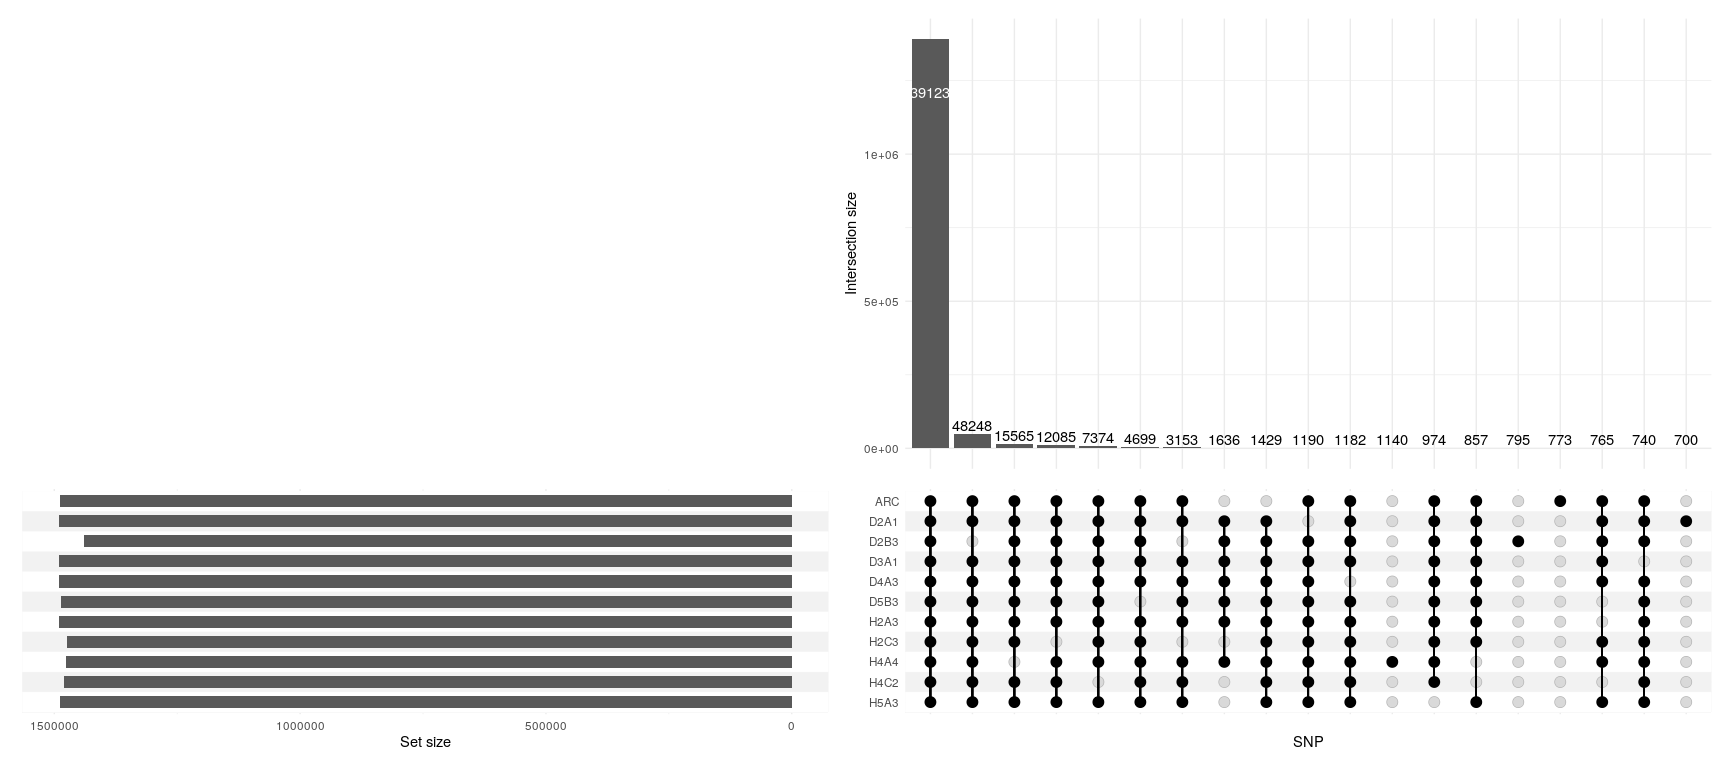
The bar for the first intersection set is obviously not 39123 but more than 1 million. I would guess as the figure is big and doesn't fit inside the bar it's just chopped off.
Hi Mike,
Today, noticed that
in the upset() plot everything is ok,
but
the vertical lines "connecting" any dots in a column
are not displayed anymore.
The black dots display fine,
but without "connector" lines btw them.
Ex:
Simple Upset Plot
(or with any other +complex example),
no vertical "connector" lines are shown btw dots.
upset(
movies, genres,
base_annotations=list('Intersection size'=intersection_size(counts=FALSE)),
min_size=100,
width_ratio=0.3
)
ComplexUpset pkg v 052,
w/ Ubuntu Linux 18.04, latest Rstudio and R.
see image below:

Hi, I wanted to know how to situate a geom_text related to the max intersection of the plot.
Code:
'EDAD'=list(
  aes=aes(x=intersection, y=EDAD)
  ,geom=list(geom_boxplot()
             ,geom_hline(aes(yintercept = median(EDAD))
                         ,color='coral'
                         ,linetype="dashed")
             ,geom_text(aes(max(intersection),median(EDAD),label = round(median(EDAD),1), vjust = -1))
  )
)
Output:
It locates in the red circle, and wanted to situate it in the red arrow.

Great package!
I'm wondering if there is an easy way to have two side-by-side bars for each intersection?
I have my observed data that I want to mainly plot, but by each intersection I want the expected (based on my null model) intersection size so that I can clearly see how different the observed is from the expected. Sometimes expected is > observed and sometimes < observed so the stacked bars isn't clear for that.
Sorry about this basic question...
I have this:
annotations = list(
  'LETALIDAD'=list(
    aes=aes(x=intersection, fill=FALLECIDOS)
    ,geom=list(
      geom_bar(stat='count', position='fill')
      ,scale_fill_manual(values=as.vector(c(GRIS,ROJO)))
      ,scale_y_continuous(labels=scales::percent_format())))
)
Output:

I need to add the geom_text in black color only in the red bars
Is it possible to prespecify the order of the intersections? I know there are option sort_intersections and sort_intersections_by but they don't allow ordering by, say, a factor in the input data frame.
Thanks.
I can't find a way to change the words "Intersection size" at the y-axis. Would be great to have an option to set all the titles manually, same as in ggplot. Or if I am blind, please show me the way.
Thank you in advance
Hello,
I don't know if it's a knitr or upset issue, but trying to knit the Rstudio markdown returns
Quitting from lines 734-744 (NDPD_calling.Rmd)
Error in `$<-.data.frame`(x, name, value) :
  replacement has 0 rows, data has 1585017
Calls: <Anonymous> ... upset_data -> $<- -> $<-.data.table -> $<-.data.frame
In addition: Warning message:
In get_engine(options$engine) :
  Unknown language engine 'bas' (must be registered via knit_engines$set()).
Execution halted
Here is the code of lines 734 - 744
DT2 = DT%>%mutate_at(-1, ~case_when(grepl('^0/1', .) ~ 1L,
                           grepl('^0/0', .) ~ 0L,
                           grepl('^1/1', .) ~ 1L,
                           TRUE~ NA_integer_))
sum(Reduce('|', lapply(DT2, is.na)))
DT3 = na.omit(DT2)
DT3 = as.data.table(DT3)
sampName = list(colnames(test)[2:12])
upset(DT3, sampName, name='SNP', width_ratio=0.5, min_size=1000, sort_sets=FALSE)
Commenting out the upset command resolves the error message.
Hi, I'm trying to plot in Markdown but it ain't working.
plot(x)
I don't know why it behaves like this, but if you use eg Co-amoxiclav instead of Co amoxiclav - you get an incorrect upset plot where all of the points of Co-amoxiclav are missing. Using Co amoxiclav fixes this. Took me about an hour to work out what was going on here so hopefully helpful to someone else (maybe even easily fixable).
Currently, the y-axis label (title) is centred on the intersection size; it is often desired, but sometimes it would be good to have a way to centre it with respect to the entire plot.
Using the sample data from the readme:
library(ggplot2)
library(ComplexUpset)


ComplexUpset::upset(
  movies,
  genres,
  annotations = list(
    'Length'=list(
      aes=aes(x=intersection, y=length),
      geom=geom_boxplot()
    ),
    'Rating'=list(
      aes=aes(x=intersection, y=rating),
      geom=list(
        # if you do not want to install ggbeeswarm, you can use geom_jitter
        geom_jitter(aes(color=log10(votes))),
        geom_violin(width=1.1, alpha=0.5)
      )
    )
  ),
  queries=list(
    upset_query(
      intersect=c('Drama', 'Comedy'),
      color='red',
      fill='red',
      only_components=c('intersections_matrix', 'Intersection size')
    ),
    upset_query(
      set='Drama',
      fill='blue'
    ),
    upset_query(
      intersect=c('Romance', 'Drama'),
      fill='yellow',
      only_components=c('Length')
    )
  ),
  min_size=10,
  width_ratio=0.1
)
I get the following error:
Error in unlist(intersect) : object 'genres' not found
Is this related to the ggplot2 update?
Here is my sessionInfo():
R version 3.6.2 (2019-12-12)
Platform: x86_64-apple-darwin15.6.0 (64-bit)
Running under: macOS Catalina 10.15.2

Matrix products: default
BLAS:   /System/Library/Frameworks/Accelerate.framework/Versions/A/Frameworks/vecLib.framework/Versions/A/libBLAS.dylib
LAPACK: /Library/Frameworks/R.framework/Versions/3.6/Resources/lib/libRlapack.dylib

locale:
[1] en_US.UTF-8/en_US.UTF-8/en_US.UTF-8/C/en_US.UTF-8/en_US.UTF-8

attached base packages:
[1] stats     graphics  grDevices utils     datasets  methods   base

other attached packages:
[1] ComplexUpset_0.4.0 ggplot2_3.3.0.9000 testthat_2.3.2     devtools_2.2.2     usethis_1.5.1

loaded via a namespace (and not attached):
 [1] Rcpp_1.0.3        compiler_3.6.2    pillar_1.4.3      prettyunits_1.1.1 remotes_2.1.1
 [6] tools_3.6.2       digest_0.6.25     pkgbuild_1.0.6    pkgload_1.0.2     memoise_1.1.0
[11] lifecycle_0.2.0   tibble_2.1.3      gtable_0.3.0      pkgconfig_2.0.3   rlang_0.4.5
[16] cli_2.0.2         rstudioapi_0.11   patchwork_1.0.0   withr_2.1.2       dplyr_0.8.5
[21] desc_1.2.0        fs_1.3.2          tidyselect_1.0.0  rprojroot_1.3-2   grid_3.6.2
[26] glue_1.3.1        R6_2.4.1          processx_3.4.2    fansi_0.4.1       sessioninfo_1.1.1
[31] purrr_0.3.3       callr_3.4.2       magrittr_1.5      backports_1.1.5   scales_1.1.0
[36] ps_1.3.2          ellipsis_0.3.0    assertthat_0.2.1  colorspace_1.4-1  munsell_0.5.0
[41] crayon_1.3.4
Following up on this comment from @gofraidh, it would be good to consider adding an example, or even a helper function to make working with the data in a long format easier.
Hello,
Not sure it's an issue actually, I mean that I don't know if there is something that can be done about this but:
I tried with a combination matrix of 10^9 rows x 2 sets/
It didn't go well ... 64 Go of ram is not enough.
The parameter min_degree fails to work as intended. When given the parameter min_degree = 0, it will plot all intersections as expected included the case of the null set of intersections. However when given the parameter min_degree = 1, it will exclude not only the null set but any set consisting of just one intersection which removes the opportunity to exclude the null set.
0,0,0 0,0,0 0,0,1 0,1,0 0,1,1
When tested on the above csv, we get the following outcomes:


In my case, I am working with categorical data dealing with cases of a medical event which is massively sparse so the vast majority of people don't have any events recording but I need to exclude them in this analysis.
Hope that this can be resolved as otherwise I am very impressed with the package.
sort_sets=FALSE) - see #13 (comment)sort_intersections=FALSE)Is it possible to sort intersections by degree? I would like to be able to sort the intersections with the highest degree first (e.g., have the intersection shared between the most number of sets come first). This is possible with in the UpSetR package with UpSetR::upset(order.by = "degree")
The picture below is an example where the Short category could have been hidden as it does not have any large overlap:

Is it possible to highlight the "empty" intersection / complement (i.e. the intersection where all the binary variable are false)?
There is no problem plotting the empty intersection, but none of these hypothetical queries, work:
upset_query(intersect = character(), fill='yellow')
upset_query(intersect = c(), fill='yellow')
upset_query(intersect = NA, fill='yellow')Is this possible?
Hello,
First of all great package, I really like the extensibility of it !
I have discovered that the 'x' parameter in the gsub function in names_of_true is missing, which causes an error if the colnames contain a '-' character. Reprex is below:
test_frame<-data.frame(
  a = c(TRUE, TRUE, TRUE),
  b = c(FALSE, FALSE, FALSE),
  c = c(TRUE, FALSE, TRUE)
)

colnames(test_frame) <- c("a","b","C-")
apply(test_frame, 1, ComplexUpset::names_of_true)
#> Error in gsub("-", "_"): argument "x" is missing, with no default

#add name as 'x' parameter for gsub
names_of_true2<-function (row)
{
  sanitized_names = c()
  for (name in names(which(row))) {
    if (grepl("-", name, fixed = TRUE)) {
      name = gsub("-", "_",name)
      if (name %in% names(which(row))) {
        stop("The group names contain a combination of minus characters (-) which could not be simplified; please remove those.")
      }
    }
    sanitized_names = c(sanitized_names, name)
  }
  paste(sanitized_names, collapse = "-")
}

apply(test_frame, 1, names_of_true2)
#> [1] "a-C_" "a"    "a-C_"
Created on 2020-03-31 by the reprex package (v0.3.0)
Additionally I was wondering what the reason was for using a for loop in this function as grepl and gsub support vector inputs, removing the for loop could have significant performance gains especially for very 'wide' data
#test_data 10 obs 4000 variables
test_data <-data.frame(replicate(4000,sample(c(TRUE,FALSE),10,rep=TRUE)))

#Simple mock-up
names_of_true3<-function (row)
{
  true_row_names <- names(which(row))
  fixed_row_names <- gsub("-","_",true_row_names)
  if(any(grepl("-",fixed_row_names, fixed = TRUE))) {stop("- detected")}

  paste(fixed_row_names, collapse = "-")
}

bench::mark(
  apply(test_data, 1, names_of_true3),
  apply(test_data, 1, ComplexUpset::names_of_true)
)
#> Warning: Some expressions had a GC in every iteration; so filtering is disabled.
#> # A tibble: 2 x 6
#>   expression                                           min  median `itr/sec`
#>   <bch:expr>                                       <bch:t> <bch:t>     <dbl>
#> 1 apply(test_data, 1, names_of_true3)               24.4ms  27.2ms     37.0
#> 2 apply(test_data, 1, ComplexUpset::names_of_true) 124.1ms 129.8ms      7.76
#> # ... with 2 more variables: mem_alloc <bch:byt>, `gc/sec` <dbl>
Created on 2020-03-31 by the reprex package (v0.3.0)
Hello,
is this possible?
Also, how does one change the font size?
It can be done easily as shown in #37, it would be nice to have an example in the documentation.
Passing optional argument add_caption=TRUE could generate a caption such as:
Showing overlap > 10; There are 21 smaller overlaps that do not meet these criteria.
Thanks for the great package! I read through the whole example documentation. I understand how to change color of all bars in set size but I don't understand how to make any color change for interaction size and matrix.
Do I need to pass each interaction to an upset query?
Hi,
I've been trying to get upset to display all overlapping elements between sets but I can't, and its behaviour is puzzling:
# Example data
test <- data.frame(
  stringsAsFactors = FALSE,
           id_set1 = c("a", "b", "c", "d", "e", "f", "g", "h", "i", "j"),
           id_set2 = c(NA, NA, NA, NA, "e", NA, NA, "h", "i", "j"),
           id_set3 = c("a", "b", NA, "d", "e", "f", "g", "h", "i", "j"),
           id_set4 = c("a", "b", "c", "d", "e", "f", "g", "h", "i", "j")
        )

# Turn the values into Boolean
elements <- c("a", "b", "c", "d", "e", "f", "g", "h", "i", "j")

test2 = data.frame(
	set1 = ifelse(test[,1] %in% elements, 1, 0),
	set2 = ifelse(test[,2] %in% elements, 1, 0),
	set3 = ifelse(test[,3] %in% elements, 1, 0),
	set4 = ifelse(test[,4] %in% elements, 1, 0))

upset(test2, colnames(test2))

I thought that the height of the bars should show counts of common elements in the given sets (their intersections, in the sense of intersect()), but it doesn't. For example, the plot suggests there are five common elements in sets 1, 3 and 4. But we can see from the table that there are nine (the only missing element is c in set3). On the other hand, it correctly shows that there are four common elements across all four sets (e, h, i, j). Then again, sets 1 and 4 are identical, so they have ten common elements. Where does the 1 come from on the plot? (I also don't mention here that not all combination of sets are shown)
Could someone please clarify this behaviour?
kJ
Is there a way to selectively display only intersections with degree <= 2 or something similar to nintersects in UpsetR?
Or make it explicit
Hi, I wanted to know how to change the height of this annotations:
code:
UPSETPLOT<-upset(TRATAMIENTO_ANTI_COVID_CON_VMI
                 ,TRATAMIENTO_ANTI_COVID_COLUMNAS
                 ,width_ratio=0.1
                 ,name='TERAPIAS ANTI COVID19'
                 ,stripes=c("white", "#B4D5DE")
                 ,min_degree=0
                 ,keep_empty_groups = TRUE
                 ,base_annotations=list(
                   'Intersection size'=intersection_size(text_aes=aes(label=paste0(round(intersection_size/union_size * 100), "%|",intersection_size,"")))
                 )
                 ,themes=upset_modify_themes(
                   list(
                     'intersections_matrix'=theme(text=element_text(size=15)),
                     'overall_sizes'=theme(axis.text.x=element_text(angle=90))
                   ))
                 ,annotations = list(
                   'ESTADIA\nHOSPITALARIA'=list(
                     aes=aes(x=intersection, y=LOS_DIAS),
                     geom=geom_boxplot()
                   ),
                   'LETALIDAD'=list(
                     aes=aes(x=intersection, fill=FALLECIDOS)
                     ,geom=list(
                       geom_bar(stat='count', position='fill')
                       ,scale_fill_manual(values=as.vector(c(GRIS,ROJO)))
                       ,scale_y_continuous(labels=scales::percent_format())))
                 ))
output:

I need to obtain something like this:

Based on the suggestion from #23 (comment) by @sfd99.
One quick solution:
upset(
    movies, genres,
    min_size=10,
    set_sizes=upset_set_size(
        geom=function(...) {
            list(
                geom_bar(...),
                geom_text(..., aes(label=..count..))
            )
        },
        stat='count'
    )
)
but I will also consider:
upset_set_sizeOne option using themes is demonstrated here #13 (comment)
Thanks for this great package. I really like the ability to stack the intersection plots and I have been looking for something like this for a long time. I'm presenting two upsets side-by-side, but I would like like to be able to show a single legend. In the image below I would like to have just one legend showing the colors for the phyla.
Thanks! Chuck

I might be doing something wrong, but it seems that if a bar on the intersection sizes plot is highlighted, then any on-bar counts are hidden.
In the example below, the count is on the bar for the first 2 bars, but when the second is highlighted the count isn't visible on that one. I tried changing the text colours, but it didn't have any effect on the highlighted bar.
library(ggplot2)
library(ComplexUpset)
model <-
  data.frame(
    guess = c(T,T,T,T,F,F,F,F),
    real  = c(F,T,T,T,T,F,T,T)
  )

upset(
  model,
  intersect = c("guess", "real"),
  queries = list(
    upset_query(
      intersect = c("guess", "real"),
      fill = "blue"
    ),
    upset_query(
      intersect = NA,
      fill = "blue"
    )
  )
)
Created on 2020-06-18 by the reprex package (v0.3.0)
For better compatibility with plots composition, ignore_tag should be set on the intersection matrix; it should be optional. An article om composing multiple upset plots should be also added.
Hi Mike,
ComplexUpset is GREAT! .
A quick question...
...when I run your R code movies example,
in link:
https://github.com/krassowski/complex-upset#showcase
(the example R source code just under the nice upset plot!...),
I get this error message:
[1] "Converting non-logical columns to binary: Action, Animation, Comedy, Drama, Documentary, Romance"
Error in stack.data.frame(data, intersect) : no vector columns were selected**
Yet,
ggplot2movies, beeswarm, etc.
+all required pkgs are loaded ok...
Help! what am I missing?
sfd99
San Francisco
Ubuntu Linux 18.04,
latest versions of Rstudio and R.
intersection_size and intersection_ratio accept:
bar_number_threshold (could be bar_label_threshold?)text and text_aes can be merged into a list, same way as annotations?aest - rename to mapping?text_colors - allow to specify one color for both easilyMaybe something like:
intersection_size(
  bar=list(aes=aes()),
  # could be "text" instead of "counts"
  counts=upset_counts(aes=aes(), on_bar_when_lt=0.75, geom=list()),
)
when counts=FALSE, then do not display counts. Remember to update upset_text_percentage.
in case where there is no combination matrix but an intersection matrix?
I mean this, let's say we have 3 sets and that the number of elements for each set and all intersections are already computed. Can this be fed to complex-upset?
Thank you
for intersection size
Hi, how to remove legend from geom_bar??
Hello,
thanks for this package, very cool looking and I am glad you help making live the upset concept in R. I have a dataset that looks like this:
              ID control D2A1 D2B3 D3A1 D4A3 D5B3 H2A3 H2C3 H4A4 H4C2 H5A3
3  Chrom_3_1398_C_T            1    0    0    0    0    0    0    0    0    1    0
10 Chrom_3_4061_A_T            0    1    1    1    1    0    1    1    1    1    1
11 Chrom_3_4064_C_T            0    1    1    1    1    0    1    1    1    1    1
12 Chrom_3_4065_G_A            0    1    1    1    1    0    1    1    1    1    1
13 Chrom_3_4069_C_T            0    1    1    1    1    0    1    1    1    1    1
14 Chrom_3_4093_A_C            1    1    1    1    1    0    1    1    1    1    1
Basically it's just a list of genomic mutations (ID column), across different biological samples (other columns).
My code is
sampName = list(colnames(DT3)[2:12])
upset(DT3, sampName, name='SNP', width_ratio=0.1)
The data set is roughly 1,5 million rows long and it seems to be taking forever to plot.
Hi- I just started playing with ComplexUpset (0.5.15), thank you - great stuff!
As per title, it would be useful to have the option to have columns in the intersection matrix ordered by degree than by cardinality. E.g. like sort_intersections_by = c('degree', 'cardinality').
Probably a separate feature request: It would be nice if the intersect parameter (or some other parameter) could take a list of lists of intersections and plot only those (similar to the original upset in UpSetR), optionally respecting the order in the outer list
Something like:
geom_text(
    aes(label=residue, size=log(..count..)/1.5),
    check_overlap=TRUE, stat='count', position=position_fill(vjust=0.5), hjust=0.5,
    vjust=0.5, show_guide=FALSE
),A declarative, efficient, and flexible JavaScript library for building user interfaces.
🖖 Vue.js is a progressive, incrementally-adoptable JavaScript framework for building UI on the web.
TypeScript is a superset of JavaScript that compiles to clean JavaScript output.
An Open Source Machine Learning Framework for Everyone
The Web framework for perfectionists with deadlines.
A PHP framework for web artisans
Bring data to life with SVG, Canvas and HTML. 📊📈🎉
JavaScript (JS) is a lightweight interpreted programming language with first-class functions.
Some thing interesting about web. New door for the world.
A server is a program made to process requests and deliver data to clients.
Machine learning is a way of modeling and interpreting data that allows a piece of software to respond intelligently.
Some thing interesting about visualization, use data art
Some thing interesting about game, make everyone happy.
We are working to build community through open source technology. NB: members must have two-factor auth.
Open source projects and samples from Microsoft.
Google ❤️ Open Source for everyone.
Alibaba Open Source for everyone
Data-Driven Documents codes.
China tencent open source team.
