Git Product home page Git Product logo

pips2's Introduction

Long-Term Point Tracking with PIPs++

This is the official code release for the PIPs++ model presented in our ICCV 2023 paper, "PointOdyssey: A Large-Scale Synthetic Dataset for Long-Term Point Tracking".

[Paper] [Project Page]

Requirements

The lines below should set up a fresh environment with everything you need:

conda create -n pips2 python=3.8
conda activate pips2
conda install pytorch torchvision torchaudio pytorch-cuda=11.8 -c pytorch -c nvidia
pip install -r requirements.txt

Demo

To download our reference model, run this line:

sh get_reference_model.sh

Or, use the dropbox link inside that file.

To try this model on a sample video, run this:

python demo.py

This will run the model on the video included in stock_videos/.

For each 8-frame subsequence, the model will return trajs_e. This is estimated trajectory data for a set of points, shaped B,S,N,2, where S is the sequence length and N is the number of particles, and 2 is the x and y coordinates. The script will also produce tensorboard logs with visualizations, which go into logs_demo/.

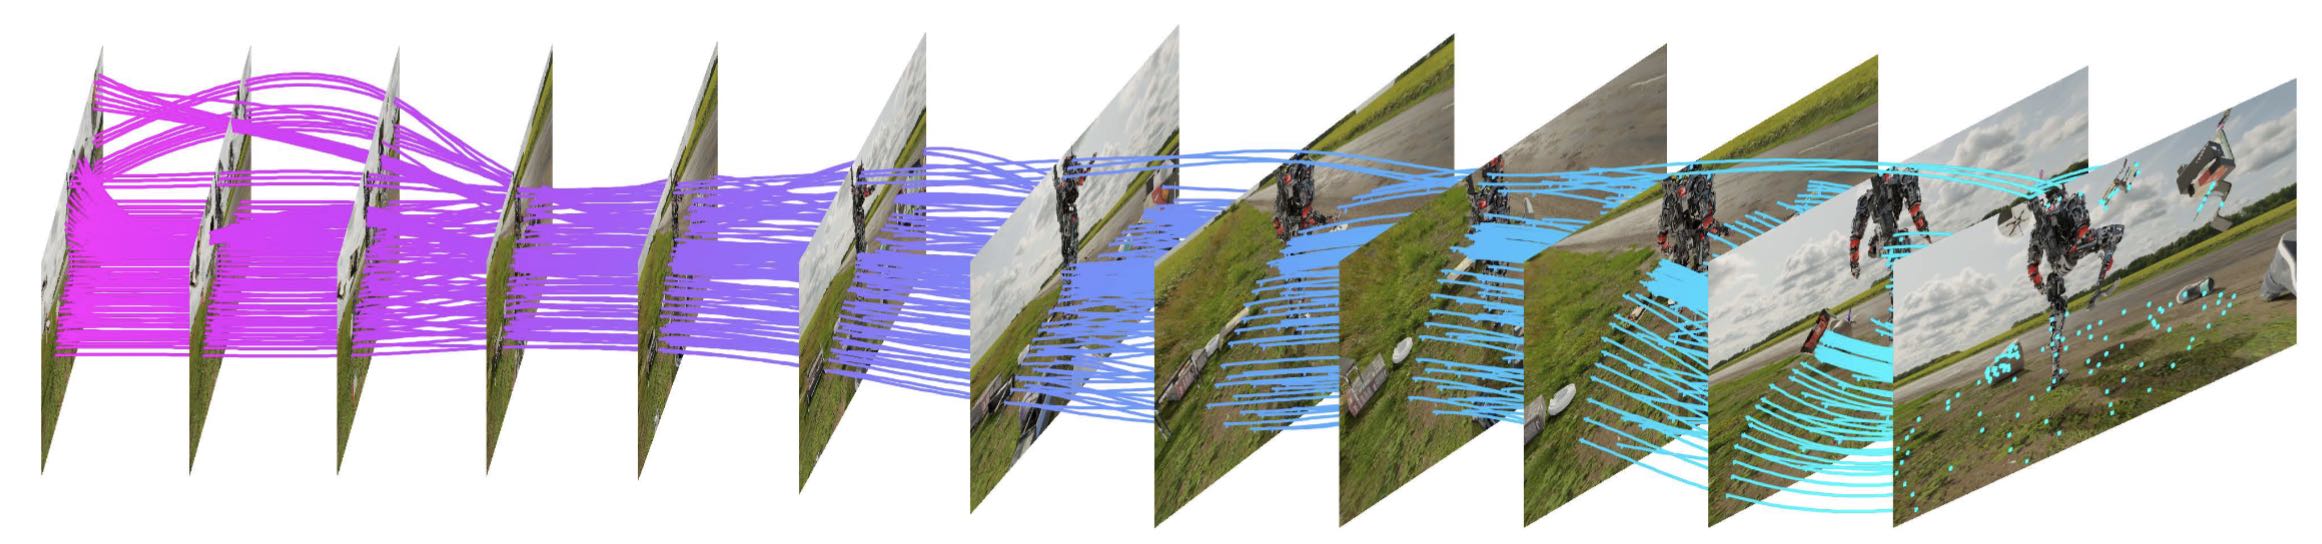
In the tensorboard for logs_demo/ you should be able to find visualizations like this:

PointOdyssey

We train our model on the PointOdyssey dataset.

With a standard dataloader (e.g., datasets/pointodysseydataset.py), loading PointOdyssey's high-resolution images can be a bottleneck at training time. To speed things up, we export mp4 clips from the dataset, at the resolution we want to train at, with augmentations baked in. To do this, run:

python export_mp4_dataset.py

This will produce a dataset of clips, in pod_export/$VERSION_$SEQLEN. The script will also produce some temporary folders to help write the data; these can be safely deleted afterwards. The script should also be safe to run in multiple threads in parallel. Depending on disk speeds, writing the full dataset with 4 threads should take about 24h.

The script output should look something like this:

.36_A_em00_aa_110247; step 000676/153264; this_step 018524; itime 3.77
.36_A_em00_aa_110247; step 000677/153264; this_step 017116; itime 2.74
.36_A_em00_aa_110247; step 000678/153264; this_step 095616; itime 6.11
sum(~mot_ok) 276
xN=0
sum(~mot_ok) 2000
N=0
:::sum(~mot_ok) 14
.36_A_em00_aa_110247; step 000685/153264; this_step 002960; itime 6.51
.36_A_em00_aa_110247; step 000686/153264; this_step 034423; itime 6.91

Note that the clips are produced in random order. The script is fairly friendly to multiple parallel runs, and avoids re-writing mp4s that have already been produced. Sometimes sampling from PointOdyssey will fail, and the script will report the reason for the failure (e.g., no valid tracks after applying augmentations).

As soon as you have a few exported clips, you can start playing with the trainer. The trainer will load the exported data using dataset/exportdataset.py.

Training

To train a model, simply run train.py.

It should first print some diagnostic information about the model and dataset. Then it should print a message for each training step, indicating the model name, progress, read time, iteration time, and loss.

model_name 4_36_128_i6_5e-4s_A_aa03_113745
loading export...
found 57867 folders in pod_export/aa_36
+--------------------------------------------------------+------------+
|                        Modules                         | Parameters |
+--------------------------------------------------------+------------+
|           module.fnet.layer3.0.conv1.weight            |   110592   |
|           module.fnet.layer3.0.conv2.weight            |   147456   |
|           module.fnet.layer3.1.conv1.weight            |   147456   |
|           module.fnet.layer3.1.conv2.weight            |   147456   |
|           module.fnet.layer4.0.conv1.weight            |   147456   |
|           module.fnet.layer4.0.conv2.weight            |   147456   |
|           module.fnet.layer4.1.conv1.weight            |   147456   |
|           module.fnet.layer4.1.conv2.weight            |   147456   |
|                module.fnet.conv2.weight                |   958464   |
|    module.delta_block.first_block_conv.conv.weight     |   275712   |
| module.delta_block.basicblock_list.2.conv2.conv.weight |   196608   |
| module.delta_block.basicblock_list.3.conv1.conv.weight |   196608   |
| module.delta_block.basicblock_list.3.conv2.conv.weight |   196608   |
| module.delta_block.basicblock_list.4.conv1.conv.weight |   393216   |
| module.delta_block.basicblock_list.4.conv2.conv.weight |   786432   |
| module.delta_block.basicblock_list.5.conv1.conv.weight |   786432   |
| module.delta_block.basicblock_list.5.conv2.conv.weight |   786432   |
| module.delta_block.basicblock_list.6.conv1.conv.weight |  1572864   |
| module.delta_block.basicblock_list.6.conv2.conv.weight |  3145728   |
| module.delta_block.basicblock_list.7.conv1.conv.weight |  3145728   |
| module.delta_block.basicblock_list.7.conv2.conv.weight | 3145728  |
+--------------------------------------------------------+------------+
total params: 17.57 M
4_36_128_i6_5e-4s_A_aa03_113745; step 000001/200000; rtime 3.69; itime 5.63; loss 35.030; loss_t 35.03; d_t 1.8; d_v nan
4_36_128_i6_5e-4s_A_aa03_113745; step 000002/200000; rtime 0.00; itime 1.45; loss 31.024; loss_t 33.03; d_t 2.5; d_v nan
4_36_128_i6_5e-4s_A_aa03_113745; step 000003/200000; rtime 0.00; itime 1.45; loss 30.908; loss_t 32.32; d_t 2.7; d_v nan
4_36_128_i6_5e-4s_A_aa03_113745; step 000004/200000; rtime 0.00; itime 1.45; loss 31.327; loss_t 32.07; d_t 2.8; d_v nan
4_36_128_i6_5e-4s_A_aa03_113745; step 000005/200000; rtime 0.00; itime 1.45; loss 29.762; loss_t 31.61; d_t 2.9; d_v nan
[...]

The final items in each line, d_t and d_v, show the result of the d_avgmetric on the training set and the validation set. Note thatd_vwill shownan` until the first validation step.

To reproduce the reference model, you should train for 200k iterations (using the fully-exported dataset), with B=4, S=36, crop_size=(256,384). Then, fine-tune for 10k iterations using higher resolution and longer clips: B=1, S=64, crop_size=(512,896). If you can afford a higher batch size, you should use it. For this high-resolution finetuning, you can either export new mp4s, or use pointodysseydataset.py directly.

Testing

We provide evaluation scripts for all of the datasets reported in the paper. The values in this repo are slightly different than those in the PDF, largely because we fixed some bugs in the dataset and re-trained the model for this release.

TAP-VID-DAVIS

For each point with a valid annotation in frame0, we track it to the end of the video (<200 frames). The data comes from the DeepMind TAP-NET repo.

With the reference model, test_on_tap.py should produce d_avg 70.6; survival_16 89.3; median_l2 6.9.

CroHD

We chop the videos in to 1000-frame clips, and track heads from the beginning to the end. The data comes from the "Get all data" link on the Head Tracking 21 MOT Challenge page. Downloading and unzipping that should give you the folders HT21 and HT21Labels, which our dataloader relies on.

With the reference model, test_on_cro.py should produce d_avg 35.5; survival_16 48.2; median_l2 20.7.

PointOdyssey test set

For each point with a valid annotation in frame0, we track it to the end of the video (~2k frames). Note that here we use the pointodysseydataset_fullseq.py dataloader, and we load S=128 frames at a time, because 2k frames will not fit in memory.

With the reference model, test_on_pod.py should produce d_avg 31.3; survival_16 32.7; median_l2 33.0.

Citation

If you use this code for your research, please cite:

PointOdyssey: A Large-Scale Synthetic Dataset for Long-Term Point Tracking. Yang Zheng, Adam W. Harley, Bokui Shen, Gordon Wetzstein, Leonidas J. Guibas. In ICCV 2023.

Bibtex:

@inproceedings{zheng2023point,
 author = {Yang Zheng and Adam W. Harley and Bokui Shen and Gordon Wetzstein and Leonidas J. Guibas},
 title = {PointOdyssey: A Large-Scale Synthetic Dataset for Long-Term Point Tracking},
 booktitle = {ICCV},
 year = {2023}
}

pips2's People

Contributors

aharley avatar dli7319 avatar eugenelyj avatar

Stargazers

 avatar  avatar  avatar  avatar  avatar  avatar  avatar  avatar  avatar  avatar  avatar  avatar  avatar  avatar  avatar  avatar  avatar  avatar  avatar  avatar  avatar  avatar  avatar  avatar  avatar  avatar  avatar  avatar  avatar  avatar  avatar  avatar  avatar  avatar  avatar  avatar  avatar  avatar  avatar  avatar  avatar  avatar  avatar  avatar  avatar  avatar  avatar  avatar  avatar  avatar  avatar  avatar  avatar  avatar  avatar  avatar  avatar  avatar  avatar  avatar  avatar  avatar  avatar  avatar  avatar  avatar  avatar  avatar  avatar  avatar  avatar  avatar  avatar  avatar  avatar  avatar  avatar  avatar  avatar  avatar  avatar  avatar  avatar  avatar  avatar  avatar  avatar  avatar  avatar  avatar  avatar  avatar  avatar  avatar  avatar  avatar  avatar  avatar  avatar  avatar

Watchers

 avatar  avatar  avatar  avatar

pips2's Issues

Coordinate System of Trajectory

Hi Admins,

I was asking myself while exploring your repo where the origin of the coordinate system for the trajectories is? Is it the upper left corner?
Because I noticed that the trajectories which I loaded with the data loader from the file pointodysseydataset.py include negative values. Is this because the point is moving out of the image? And if so, are these points always marked as not visible?

Thanks a lot for you answer.

Use export_mp4_dataset to create training data

Hi

Thank you so much for sharing your great work!
I'm trying to train a similar model on PointOdyssey dataset.

  1. What is the difference between train.tar.gz, train.tar.gz.partaa and train.tar.gz.partXX and so on?
  2. Should I run export_mp4_dataset.py for each of mod and its corresponding training chunk in this code:
    mod = 'aa' # copy from dev repo; crop_size=(256x384), S=36
    mod = 'ab' # allow more OOB, by updating threshs to 64; export at 384,512; output 256; export as long as we have N//2
    mod = 'ac' # N=128
    mod = 'ad' # put more info into name; also print rtime
    mod = 'ae' # allow trajs to go behind camera during S
  1. Should the resize tuple depends on crop value in this line?

Visualize tracked points on long videos?

It seems like the points get re-initialized every S frames in demo.py, so the resulting logs are chopped up into segments.
And test_on_pod.py doesn't visualize the predictions.
I could probably manually chain the points in demo, but was wondering if there's a better way to visualize points for the entire video?

Simple demo

Other then test_* for the specific datasets do you have a minimal inference demo script for generic image sequences or video?

Trajectory has incorrect segments in the beginning

The videos logged to tensorboard seem fine, but when I plot the trajectories in 2d and 3d, even if the point doesn't move in the first few frames, the trajectories seems to indicate lots of movement in the beginning, so the plots always have an extra segment. Has anyone else observed this?
suc_1

Tracking beyond border

Hey,
is there a way to handle points tracked beyond the borders of the image?

Thank you for the great work!

Result of the demo is bad

Hi, I just tried the camel demo, but the result I got was messed up, I tried modify some parameters but the result were the same, did I do something wrong or the demo model is for test only?

Thanks for any help!

image

demo.py still uses delta_mult

In 9f901be, delta_mult was removed as an argument to the Pips' forward. However, it is still referenced if beautify=True and is still used in demo.py.

When calling demo.py, this results in

TypeError: Pips.forward() got an unexpected keyword argument 'delta_mult'

Issues with sequence_loss() during training.

I was trying to train the model with S=8, N=75 but got this error. It seems there is an error either in the sequence_loss function or passing argument. Can you please make sure and provide a resolution?

line 120, in sequence_loss
i_loss = (flow_pred - flow_gt).abs() # B,S,N,2
~~~~~~~~~~^~~~~~~~~
RuntimeError: The size of tensor a (8) must match the size of tensor b (75) at non-singleton dimension 2

Evaluation on PointOdyssey

Hi @aharley,

Thank you for the great work!

I'm trying to reproduce the results on the test split of PointOdyssey. That's the link that I used to download the dataset. After following the installation instructions, I launched test_on_pod.py with S=128 and sur_thr=50, which produced the following output:

1_128_i16_pod05_212310; step 000001/12; rtime 0.97; itime 23.07; d_x 13.7; sur_x 23.0; med_x 69.7
1_128_i16_pod05_212310; step 000002/12; rtime 1.01; itime 26.43; d_x 16.9; sur_x 27.1; med_x 56.1
1_128_i16_pod05_212310; step 000003/12; rtime 13.41; itime 98.56; d_x 18.3; sur_x 35.4; med_x 45.0
1_128_i16_pod05_212310; step 000004/12; rtime 16.99; itime 134.77; d_x 28.2; sur_x 49.8; med_x 36.1
1_128_i16_pod05_212310; step 000006/12; rtime 19.53; itime 104.47; d_x 23.7; sur_x 40.7; med_x 47.3
1_128_i16_pod05_212310; step 000007/12; rtime 6.80; itime 42.10; d_x 24.4; sur_x 43.5; med_x 45.4
1_128_i16_pod05_212310; step 000008/12; rtime 3.20; itime 36.09; d_x 26.9; sur_x 48.2; med_x 42.0
1_128_i16_pod05_212310; step 000009/12; rtime 13.59; itime 121.77; d_x 25.3; sur_x 47.2; med_x 42.8
1_128_i16_pod05_212310; step 000010/12; rtime 13.38; itime 82.74; d_x 25.1; sur_x 48.6; med_x 50.3
1_128_i16_pod05_212310; step 000011/12; rtime 8.20; itime 75.24; d_x 28.2; sur_x 47.5; med_x 46.7
1_128_i16_pod05_212310; step 000012/12; rtime 10.96; itime 77.90; d_x 29.1; sur_x 47.0; med_x 44.8

My results are slightly different from what is described in the Testing section. Even though I have a different survival threshold, d_avg and median_l2 should be 31.3 and 33.0, respectively. Do you know why this might be the case?

In order to load the dataset, I had to change annotations.npz to annot.npz:

annotations_path = os.path.join(seq, 'annotations.npz')

and visibilities to visibs here:

visibs = annotations['visibilities'][full_idx].astype(np.float32)

Can it be a different version of the dataset?

test_on_tap.py results don't match expected results.

Hello,
When running test_on_tap.py, I get different results than reported in the testing section.
The mean d_avg of all 30 videos (output is added below) is 72.376, compared to d_avg 70.6; survival_16 89.3; median_l2 6.9 reported.
I download the reference mode using sh get_reference_model.sh, and I test on tapvid_davis.pkl which I downloaded and unzipped from https://storage.googleapis.com/dm-tapnet/tapvid_davis.zip.

I would really appreciate any assistance and clarifications on the matter!
Assaf

generalizability of the method

Hi,

Congratulations on your excellent work and significant contributions. I have a question regarding the zero-shot capabilities of your trained model: do you consider it reliable enough for point tracking in unseen videos?

Track new area

Is there a way to allocate more grid points as new areas enter in the scene with new frames and other points/track disappear without relying on multiple inference passes on the full sequence?

Can I get the visibility confidence score?

Thank you for your great work!!

In pips(the previous version), in order to chain the results, the visibility confidence vis is used in chain_demo.py. The main idea is to choose the location which has the highest visibility confidence in the last segment as the start of next inference on the following segments.
In pips, the vis is part of the output of forward function.

I'm curious if I can get visibility confidence in pips++? My video is much longer than 48 frames, I need to chain the results.

How do we know when the tracking fails?

Is there anyways to find the tracking failure from the demo.py code?

Can we decide it ourselves by checking the score thresholds ? How to check the score thresholds for each point predicted ?

How can we set the criterion to stop the tracking ?

Processing Time for Tracking with PIPs++

Hi,

I am interested in understanding the processing time associated with using PIPs++ for tracking points across a standard video clip. Would it be possible to provide any benchmark data or insights regarding the time it takes to process a video of a common resolution and length, say 800x800 and 500 frames long?

Additionally, I'd appreciate any information on the hardware configurations used for any provided benchmark data to better understand the performance characteristics of PIPs++.

Thank you for your time and assistance!

Simplify demo.py

Can you simplify the demo to just return, tracks, visibility and eventually a video writer?
All the Tensorboard summary logics for a simple/minial inference demo it It is too convoluted to incentivize the pip2 testability

Recommend Projects

  • React photo React

    A declarative, efficient, and flexible JavaScript library for building user interfaces.

  • Vue.js photo Vue.js

    🖖 Vue.js is a progressive, incrementally-adoptable JavaScript framework for building UI on the web.

  • Typescript photo Typescript

    TypeScript is a superset of JavaScript that compiles to clean JavaScript output.

  • TensorFlow photo TensorFlow

    An Open Source Machine Learning Framework for Everyone

  • Django photo Django

    The Web framework for perfectionists with deadlines.

  • D3 photo D3

    Bring data to life with SVG, Canvas and HTML. 📊📈🎉

Recommend Topics

  • javascript

    JavaScript (JS) is a lightweight interpreted programming language with first-class functions.

  • web

    Some thing interesting about web. New door for the world.

  • server

    A server is a program made to process requests and deliver data to clients.

  • Machine learning

    Machine learning is a way of modeling and interpreting data that allows a piece of software to respond intelligently.

  • Game

    Some thing interesting about game, make everyone happy.

Recommend Org

  • Facebook photo Facebook

    We are working to build community through open source technology. NB: members must have two-factor auth.

  • Microsoft photo Microsoft

    Open source projects and samples from Microsoft.

  • Google photo Google

    Google ❤️ Open Source for everyone.

  • D3 photo D3

    Data-Driven Documents codes.