wilkelab / ggtext Goto Github PK
View Code? Open in Web Editor NEWImproved text rendering support for ggplot2
Home Page: https://wilkelab.org/ggtext/
License: GNU General Public License v2.0
Improved text rendering support for ggplot2
Home Page: https://wilkelab.org/ggtext/
License: GNU General Public License v2.0


Ideally, to have a function able to insert into geom_textbox()
small summary tibbles (2-3 columns by 2-6 rows)
and to have the textbox sized to the appropriate width and height
(using information from the initial tibble)
related to, but a bit fancier than, current issue #36
# Example (can likely be done much more elegantly)

# build a simple table
iris %>%
  count(Species) %>%
  select(n, Species)->
table

# glue together text into a single variable
# ideally would auto-extract colnames to do this, rather than manual gluing
table %>%
  mutate(text_f = glue("{n} {Species}<br>")) ->
table_f

# count the maximum width in characters
# subtract 4 for "<br>"
char_wide <- max(nchar(table_f$text_f)) - 4

# collapse text to a single text string with linebreaks (except for the last line)
label <- glue_collapse(table_f$text_f) %>%
  str_extract(pattern = "^.+(?=<br>$)")

# set up locations of text boxes
df <- tibble( label = label,
              x = c(0.2, .6),
              y = c(0.8, .5))

# plot text boxes, with width in cm related to character count (plus one for spaces)
ggplot(df) +
  aes(
    x, y, label = label,
    hjust = c(0.5,0.5), vjust = c(0.5,0.5)
    ) +
    geom_textbox(width = unit((char_wide)*0.2, "cm")) +
    xlim(0, 1) + ylim(0, 1)
Line type, line width, radius.
https://stackoverflow.com/a/60142657/4975218
Hi Wilke;
There're a problem when I installing the ggtext package. The message error is :
Warning message:
package ‘ggtext’ is not available (for R version 3.6.3)
Any solution plz?
Hello:
I have using ggtext to edit my ggplot titles.
However, today it is not working. No error messages appear, just the command description in the plot.
I.e.
library(ggplot2)
library(wesanderson)
library(ggtext)

ggplot(yearling,aes(x = Generation, y= K, group= Gender,
                color=Gender, linetype=Gender,shape=Gender ))+
  geom_line()+geom_point()+
  scale_color_manual(values=c("firebrick1","turquoise3"))+
  scale_linetype_discrete()+
  labs(title = "<b>A. Yearling cattle temperament: percentage of known parents per generation</b><br>
        <span style = 'font-size:13pt'>The color and shape represent <b><span style = 'color:firebrick1;'>female</span></b> and <b><span style = 'color:turquoise3;'>male</span></b></span>."
       , x = "Generations", y = "% of pedigree completeness")+
  theme_classic()+ theme(axis.text.x = element_text(angle = 90, hjust = 1))
The outcome:

I appreciate your help,
Thank you!
First, many thanks for this awesome package - no more dreadful struggles with plotmath!
Not sure if this is intended, or just a bug but setting font-size lower than 10pt results in an error, e.g.: Error: The string '9pt' does not represent a valid CSS unit.. I think that it would be nice to allow values less than 10 points. I've just installed from GitHub master with devtools, R 3.6.1.
library(ggplot2)
library(ggtext)

ggplot(iris, aes(Sepal.Length, Sepal.Width, color = Species)) +
  geom_point(size = 3) +
  scale_color_manual(
    name = NULL,
    values = c(setosa = "#0072B2", virginica = "#009E73", versicolor = "#D55E00"),
    labels = c(
      setosa = "<i style='color:#0072B2'>I. setosa</i>",
      virginica = "<i style='color:#009E73'>I. virginica</i>",
      versicolor = "<i style='color:#D55E00'>I. versicolor</i>")
  ) +
  labs(
    title = "**Fisher's *Iris* dataset**
    <span style='font-size:9pt'>Sepal width vs. sepal length for three *Iris*
    species</span>",
    x = "Sepal length (cm)", y = "Sepal width (cm)"
  ) +
  theme_minimal() +
  theme(
    plot.title = element_markdown(lineheight = 1.1),
    legend.text = element_markdown(size = 11)
  )
#> Warning in e1[n] <- e2[n]: number of items to replace is not a multiple of
#> replacement length

#> Warning in e1[n] <- e2[n]: number of items to replace is not a multiple of
#> replacement length
#> Error: The string '9pt' does not represent a valid CSS unit.

Created on 2019-11-26 by the reprex package (v0.3.0)
The vignette has four sections, covering the following functions:
element_markdown()element_textbox()geom_richtext()geom_textbox()Would it be possible to connect ggtext with ggrepel to create geom_richtext_repel()?
Hi,
First quick note: Love the package; usually saves me loads of time.
Not sure if this is issue or something I am missing...
When I run below it adds extra space before superscripted -3 and maybe squashes yr and superscripted -1 together too much.
Any fix or workaround for this?
require(ggplot2)
require(ggtext)
d <- data.frame(a = 1:10, b=1:10)
ggplot(d) +
geom_point(aes(a, b)) +
xlab("some text<br>NO<sub>2</sub> [μg.m<sup>-3</sup>.yr<sup>-1</sup>]") +
theme(axis.title.x = element_markdown())Tried to run the following code from the README examples and get an error.
library(cowplot)

ggplot(mpg, aes(cty, hwy)) +
  geom_point() +
  facet_wrap(~class) +
  theme_half_open(12) +
  background_grid() +
  theme(
    strip.background = element_blank(),
    strip.text = element_textbox(
      size = 12,
      color = "white", fill = "#5D729D", box.color = "#4A618C",
      halign = 0.5, linetype = 1, r = unit(5, "pt"), width = unit(1, "npc"),
      padding = margin(2, 0, 1, 0), margin = margin(3, 3, 3, 3)
    )
  )
Error in unit(rep(just$hjust, n), "npc") :
'x' and 'units' must have length > 0
In addition: Warning messages:
1: In e1[n] <- e2[n] :
number of items to replace is not a multiple of replacement length
2: In numnotnull("lineheight") : NAs introduced by coercion
Any thoughts on why?
See here for my initial look at the issue:
tidyverse/dplyr#5243
I have continued to work on this all week and figured some things out. Essentially, all of the data in my example is required to reproduce the problem and so is ggtext.
You need 3 components:
RDS: https://drive.google.com/file/d/1lhz7kOTZTKT7Dt0D5bcmbwSldiOLwe6F/view?usp=sharing
RMD: https://gist.github.com/bhive01/6f68c3301dbfb75ba0063db2abbc7f64
Rscript: https://gist.github.com/bhive01/e293135e904745a129165794bd4c0032
The RDS is compressed and uncompresses to about 2 GB in RAM. It is a very large multilayered tibble with premade plots embedded. When I run the Rscript with the entire dataset and ggtext, I get:
processing file: PerTrialReportDev.Rmd
  |.............................                                                                                                                                                  |  17%
  |..........................................................                                                                                                                     |  33%
  |........................................................................................                                                                                       |  50%
  |.....................................................................................................................                                                          |  67%
  |..................................................................................................................................................                             |  83%
  |...............................................................................................................................................................................| 100%
label: outputs (with options)
List of 7
 $ message   : logi FALSE
 $ warning   : logi FALSE
 $ error     : logi FALSE
 $ fig.retina: logi TRUE
 $ fig.height: num 7
 $ fig.width : num 8
 $ results   : chr "asis"

Error: segfault from C stack overflow
This happens consistently for me (session_info's below). If you '#' out library(ggtext) it runs without issue. I've tried it with only slice 1, 2, 3, 1&2, 1&3, 2&3 and it works, but all 3 rows and it segfaults (with ggtext). In Rstudio you get the bomb, I'm using R-gui.
When I run the script without ggtext:
processing file: PerTrialReportDev.Rmd
  |.............................                                                                                                                                                  |  17%
  |..........................................................                                                                                                                     |  33%
  |........................................................................................                                                                                       |  50%
  |.....................................................................................................................                                                          |  67%
  |..................................................................................................................................................                             |  83%
  |...............................................................................................................................................................................| 100%
label: outputs (with options)
List of 7
 $ message   : logi FALSE
 $ warning   : logi FALSE
 $ error     : logi FALSE
 $ fig.retina: logi TRUE
 $ fig.height: num 7
 $ fig.width : num 8
 $ results   : chr "asis"


output file: PerTrialReportDev.knit.md

/usr/local/bin/pandoc +RTS -K512m -RTS PerTrialReportDev.utf8.md --to html4 --from markdown+autolink_bare_uris+tex_math_single_backslash+smart --output pandoc100c61db9570d.html --email-obfuscation none --self-contained --standalone --section-divs --table-of-contents --toc-depth 4 --variable toc_float=1 --variable toc_selectors=h1,h2,h3,h4 --variable toc_collapsed=1 --variable toc_smooth_scroll=1 --variable toc_print=1 --template /Library/Frameworks/R.framework/Versions/4.0/Resources/library/rmarkdown/rmd/h/default.html --no-highlight --variable highlightjs=1 --variable 'theme:bootstrap' --include-in-header /var/folders/y8/67ytt5n148qfmft0xgrb663m0000gn/T//RtmpAcnOAe/rmarkdown-str100c63c1b331f.html --mathjax --variable 'mathjax-url:https://mathjax.rstudio.com/latest/MathJax.js?config=TeX-AMS-MML_HTMLorMML' --lua-filter /Library/Frameworks/R.framework/Versions/4.0/Resources/library/rmarkdown/rmd/lua/pagebreak.lua --lua-filter /Library/Frameworks/R.framework/Versions/4.0/Resources/library/rmarkdown/rmd/lua/latex-div.lua

Output created: DEVoutputs/Strawberry/NZPN/NZS1802/NZPN_NZS1802_Experiment_Data_Summary.html
session_info taken after running
without ggtext: https://gist.github.com/bhive01/491477484034ad109b9f6791d99afa75
with ggtext: https://gist.github.com/bhive01/43e7aa0f1e52e5e53d8f48801153d403
This package looks great- I'll use it quite a bit, especially for the image labels and text formatting. Thanks! I'm an end-user, not a programmer so please excuse if this is a trivial misunderstanding of how to use.
An issue that ggplot seems to have fixed- using greek symbols, now worked around by using unicode in text-, is giving me an issue when mixed into html ggtext.
see relavent SO question here
Just an example- adding the greek mu symbol with unicode into the html style text is not interpreted as I expect (may be my misunderstanding?).
library(ggplot2)
library(ggtext)

ggplot(iris, aes(Sepal.Length, Sepal.Width, color = Species)) +
  geom_point(size = 3) +
  scale_color_manual(
    name = NULL,
    values = c(setosa = "#0072B2", virginica = "#009E73", versicolor = "#D55E00"),
    labels = c(
      setosa = "<i style='color:#0072B2'>I. setosa  \u03bc </i>",
      virginica = "<i style='color:#009E73'>I. virginica  \u03bc </i>",
      versicolor = "<i style='color:#D55E00'>I. versicolor  \u03bc </i>")
  ) +
  labs(
    title = "**Fisher's *Iris* dataset  (test unicode symbol: \u03bc)**
    <span style='font-size:11'>Sepal width vs. sepal length for three *Iris*
    species  \u03bc </span>",
    x = "Sepal length (cm)\n (test unicode symbol: \u03bc)",
    y = "Sepal width (cm)\n (test unicode symbol: \u03bc)"
    ) +
  theme_minimal() +
  theme(
    plot.title = element_markdown(lineheight = 1.1),
    legend.text = element_markdown(size = 11)
  )
Here's the basic example of what I'm looking for, without ggtext.
ggplot(iris, aes(Sepal.Length, Sepal.Width, color = Species)) +
  geom_point(size = 3) +
  labs(
    title = "Fisher's *Iris* dataset (test unicode symbol: \u03bc)",
    x = "Sepal length (cm)\n (test unicode symbol: \u03bc)",
    y = "Sepal width (cm)\n (test unicode symbol: \u03bc)",
    color = "Species \n (test unicode symbol: \u03bc)"
  ) +
  theme_minimal()
Created on 2019-08-09 by the reprex package (v0.3.0)
I would like to apply a background color to axis.text as it is applied in axis.title in the following example:
library(ggplot2)
library(ggtext)

ggplot(mtcars, aes(disp, mpg)) +
  geom_point() +
  labs(
    title = "<b>Fuel economy vs. engine displacement</b><br>
    <span style = 'font-size:10pt'>Lorem ipsum *dolor sit amet,*
    consectetur adipiscing elit, **sed do eiusmod tempor incididunt** ut
    labore et dolore magna aliqua. <span style = 'color:red;'>Ut enim
    ad minim veniam,</span> quis nostrud exercitation ullamco laboris nisi
    ut aliquip ex ea commodo consequat.</span>",
    x = "displacement (in<sup>3</sup>)",
    y = "Miles per gallon (mpg)<br><span style = 'font-size:8pt'>A measure of
    the car's fuel efficiency.</span>"
  ) +
  theme(
    plot.title.position = "plot",
    plot.title = element_textbox_simple(
      size = 13,
      lineheight = 1,
      padding = margin(5.5, 5.5, 5.5, 5.5),
      margin = margin(0, 0, 5.5, 0),
      fill = "cornsilk"
    ),
    axis.title.x = element_textbox_simple(
      width = NULL,
      padding = margin(4, 4, 4, 4),
      margin = margin(4, 0, 0, 0),
      linetype = 1,
      r = grid::unit(8, "pt"),
      fill = "azure1"
    ),
    axis.title.y = element_textbox_simple(
      hjust = 0,
      orientation = "left-rotated",
      minwidth = unit(1, "in"),
      maxwidth = unit(2, "in"),
      padding = margin(4, 4, 2, 4),
      margin = margin(0, 0, 2, 0),
      fill = "lightsteelblue1"
    )
  )
Created on 2020-03-21 by the reprex package (v0.3.0)
I tried the following:
library(ggplot2)
library(ggtext)
library(dplyr)

df <- iris %>%
  as_tibble() %>%
  select(Species, Sepal.Width) %>%
  mutate(Species = formattable::color_tile("pink", "lightblue")(Species)) %>%
  print()
#> # A tibble: 150 x 2
#>    Species                                                           Sepal.Width
#>    <chr>                                                                   <dbl>
#>  1 "<span style=\"display: block; padding: 0 4px; border-radius: 4p…         3.5
#>  2 "<span style=\"display: block; padding: 0 4px; border-radius: 4p…         3
#>  3 "<span style=\"display: block; padding: 0 4px; border-radius: 4p…         3.2
#>  4 "<span style=\"display: block; padding: 0 4px; border-radius: 4p…         3.1
#>  5 "<span style=\"display: block; padding: 0 4px; border-radius: 4p…         3.6
#>  6 "<span style=\"display: block; padding: 0 4px; border-radius: 4p…         3.9
#>  7 "<span style=\"display: block; padding: 0 4px; border-radius: 4p…         3.4
#>  8 "<span style=\"display: block; padding: 0 4px; border-radius: 4p…         3.4
#>  9 "<span style=\"display: block; padding: 0 4px; border-radius: 4p…         2.9
#> 10 "<span style=\"display: block; padding: 0 4px; border-radius: 4p…         3.1
#> # … with 140 more rows

df %>%
  ggplot(aes(Species, Sepal.Width)) +
  geom_boxplot() +
  theme(
    axis.text.x = element_markdown()
  )
Created on 2020-03-21 by the reprex package (v0.3.0)
But nothing happens.. Is it possible to do somehow?
My native language has a lot of umlauts so I came across this bug. Using the provided example (rendering a reprex is also impossible for some reason):
library(ggplot2)
library(ggtext)

ggplot(iris, aes(Sepal.Length, Sepal.Width, color = Species)) +
  geom_point(size = 3) +
  scale_color_manual(
    name = NULL,
    values = c(setosa = "#0072B2", virginica = "#009E73", versicolor = "#D55E00"),
    labels = c(
      setosa = "<i style='color:#0072B2'>I. setosa</i>",
      virginica = "<i style='color:#009E73'>I. virginica</i>",
      versicolor = "<i style='color:#D55E00'>I. versicolor</i>")
  ) +
  labs(
    title = "**Fisher's *Iris* úúúúú dataset**
    <span style='font-size:11pt'>Sepal width vs. sepal length ääääää for three *Iris*
    species</span>",
    x = "Sepal length (cm)", y = "Sepal width (cm)"
  ) +
  theme_minimal() +
  theme(
    plot.title = element_markdown(lineheight = 1.1),
    legend.text = element_markdown(size = 11)
  )

Let's say I have the following function where I pass a dataframe and a variable name:
plot_breaks <- function(data, dv){
 ggplot(data = data, aes(x = date, y = dv)) +
    geom_line() +
    ggtitle(paste("Time Series of ", dv)) +
    xlab("Date")
}
I want to italicize the string passed as part of the dv variable. How would I do this in ggtext?
A very short question:
I tried using opacity in my html code.
Is this supported and I just did something wrong?
I didn't see it in any ggtext documentation - if not already possible it would be a great addition to future versions.
Great package!
Howdy,
The package ggtext is wonderful for simplifying labels in ggplot using element_markdown. It was working fine about a week ago, but it is now giving the following error message:
Error: gridtext has encountered a tag that isn't supported yet:
Only a very limited number of tags are currently supported.I've reproduced the issue as shown below. The only tags that I am using are for superscript and line break. I am using R version 4.0.2 with RStudio version 1.2.5003, and all my packages are up to date.
Thank you in advance for your assistance!
library(ggplot2)
library(dplyr)
#>
#> Attaching package: 'dplyr'
#> The following objects are masked from 'package:stats':
#>
#>     filter, lag
#> The following objects are masked from 'package:base':
#>
#>     intersect, setdiff, setequal, union
library(ggtext)
library(RColorBrewer)

df = mtcars

# Labels with
labs = c("Within Budget",
         ">0,<br><3 months",
         "<50 m<sup>3</sup>,<br>≥3 months"
         )
my.pal = brewer.pal(3,"Set1")

p = ggplot(df, aes(x=hp, y=mpg, color = factor(gear))) +
  geom_point(stat="identity") +
  scale_color_manual(values = my.pal,
                     aesthetics = "color",
                     labels = labs) +
  theme(legend.position = "bottom",
        legend.text = element_markdown(size=8)
        )
p
#> Error: gridtext has encountered a tag that isn't supported yet: <blockquote>
#> Only a very limited number of tags are currently supported.
Created on 2020-09-12 by the reprex package (v0.3.0)
Using theme(axis.text.x = element_markdown()) with coord_polar causes an error (but still correctly draws the plot):
Error in grid.Call.graphics(C_setviewport, vp, TRUE) :
non-finite location and/or size for viewport
Minimal & reproducible example:
df <- data.frame(name = sprintf("**%s**", LETTERS[1:4]), value = 1:4)

library(ggtext)
library(ggplot2)

ggplot(df, aes(name, value)) +
    geom_point() +
    coord_polar() +
    theme(axis.text.x = element_markdown())
This issue seems to be related to the polar coordinates, as removing coord_polar gets rid of the error
ggplot(df, aes(name, value)) +
    geom_point() +
    theme(axis.text.x = element_markdown())
I have run the code suggested on stackoverflow: https://stackoverflow.com/questions/14070953/photo-alignment-with-graph-in-r Images do show up when using the stackoverflow code chunk, but the images are not separated as they appear in the stackoverflow content but are all contiguous. When running the ggtext code chunk, the images are black with Error message "object is not supported." The library markdown is loaded but R could not find element_markdown object.
Brief description of the problem or desired feature.
library(ggplot2)  #> Warning: package 'ggplot2' was built under R version 4.0.2
library(markdown)

set.seed(123)
myd<- expand.grid('cat' = LETTERS[1:5], 'cond'= c(F,T), 'phase' = c("Interphase", "Prophase", "Metaphase", "Anaphase", "Telophase"))
myd$value <- floor((rnorm(nrow(myd)))*100)
myd$value[myd$value < 0] <- 0


labels <- c(
  Interphase = "<img src=' img/interphase.png'  width='50' /><br>Interphase",
   Prophase =  "<img src=' img/prophase.png'    width='50' /><br>Prophase",
   Metaphase = "<img src=' img/metaphase.png'   width='50' /><br>Metaphase",
   Anaphase =  "<img src=' img/anaphase.png'    width='50' /><br>Anaphase",
   Telophase = "<img src=' img/telophase.png'   width='50' /><br>Telophase"
)

ggplot(myd, aes(phase, value, fill= cat))+
  geom_col(position = "dodge") +
  scale_x_discrete(name=NULL, labels=labels)  +
  theme(axis.text.x = element_markdown(lineheight = 1.2))
#> Error in element_markdown(lineheight = 1.2): could not find function "element_markdown"
Created on 2020-09-25 by the reprex package (v0.3.0)
package ‘ggtext’ is not available (for R version 3.6.2)
Hello,
After running
remotes::install_github("wilkelab/ggtext")
I'm getting the following error:
Error: Failed to install 'ggtext' from GitHub:
  (converted from warning) unable to access index for repository https://www.stats.ox.ac.uk/pub/RWin/bin/windows/contrib/3.6:
  cannot open URL 'https://www.stats.ox.ac.uk/pub/RWin/bin/windows/contrib/3.6/PACKAGES'
Could you advise how I might be able to resolve this? Thank you.
Hello,
I have been trying to implement titles in my DAGS that use ggtext, but it seems there is a conflict because ggtext is dependent on the github version of ggplot (which then doesn't allow me to make a ggdag plot). Is it possible to have ggtext use the CRAN version of ggplot to minimize conflicts with other packages that are not yet compatible with the github version of ggplot?
Thank you!
not working
df = mtcars

# Labels with
labs = c("Within        Budget")


p = ggplot(df, aes(x=hp, y=mpg, color = factor(gear))) +
  geom_point(stat="identity") +
  scale_color_manual(values =c("red","black","green"),
                     aesthetics = "color",
                     labels = labs) +
  theme(legend.position = "bottom",
        legend.text = element_markdown(size=8)
  )
p
From the demos which support HTML, it seems like you could support icon fonts like Font Awesome, which would be interesting for annotations. (although I'm not 100% sure if this package would allow font mixing).
I'm running into an issue when I try to save a plot that has markdown elements in the y axis title. I added a lambda symbol to the y axis using ggtext. There's no issue displaying it within RStudio, but when I save the plot with save_plot(), the lambda in the y axis is converted to two dots.
library(tidyverse)
library(cowplot)
library(ggtext)
ggplot(iris) +
geom_point(aes(x = Sepal.Length, y = Sepal.Width)) +
labs(x = "*n*<sub>eff</sub>", y = "λ<sup>-1</sup>") +
theme(axis.title.x = element_markdown(),
axis.title.y = element_markdown()) -> plot1
plot1
save_plot("plot1.pdf", plot1, ncol = 1, nrow = 1, base_height = 5,
base_asp = 1.618, base_width = NULL)
The iris boxplot example from https://wilkelab.org/ggtext/ fails on Windows in the ggplot statement. Is this a known problem?
38.     fun(structure(list(message = msg, call = sys.call()), class = c(typeName, "GenericCurlError", "error", "condition")))
37.     function (type, msg, asError = TRUE) { if (!is.character(type)) { i = match(type, CURLcodeValues) ...
36.     curlPerform(curl = curl, .opts = opts, .encoding = .encoding)
35.     getURL(url, ..., write = getNativeSymbolInfo("R_curl_write_binary_data")$address, file = .buf@ref, curl = curl, .opts = .opts)
34.     RCurl::getBinaryURL(path)
33.     get_file(path)
32.     jpeg::readJPEG(get_file(path), native = TRUE)
31.     read_image(attr$src)
30.     process_tag_img(node, drawing_context)
29.     dispatch_tag(node[[i]], tags[i], drawing_context)
28.     process_tags(node, drawing_context)
27.     unlist(list(process_tags(node, drawing_context), process_tag_br(NULL, drawing_context)), recursive = FALSE)
26.     process_tag_p(node, drawing_context)
25.     dispatch_tag(node[[i]], tags[i], drawing_context)
24.     process_tags(xml2::as_list(doctree)$html$body, drawing_context)
23.     (function (text, halign, valign, use_markdown, gp) { if (use_markdown) { text <- markdown::markdownToHTML(text = text, options = c("use_xhtml", ...
22.     mapply(make_inner_box, text, halign, valign, use_markdown, gp_list, SIMPLIFY = FALSE)
21.     richtext_grob(label, x = x, y = y, hjust = hj, vjust = vj, halign = halign, valign = valign, rot = angle, padding = padding, margin = mrg$margin, r = r, align_widths = align_widths, align_heights = align_heights, gp = gp, box_gp = box_gp, debug = element$debug)
20.     element_grob.element_markdown(structure(list(family = "", face = "plain", size = 11, colour = "black", fill = NULL, box.colour = NULL, linetype = NULL, linewidth = NULL, hjust = 0.5, vjust = 1, halign = NULL, valign = NULL, angle = 0, lineheight = 0.9, ...
19.     (function (element, ...) { UseMethod("element_grob") })(structure(list(family = "", face = "plain", size = 11, colour = "black", ...
18.     exec(element_grob, label_element, `:=`(!!position_dim, break_positions), `:=`(!!label_margin_name, TRUE), label = break_labels, check.overlap = check.overlap)
17.     draw_axis_labels(break_positions = break_positions[indices], break_labels = break_labels[indices], label_element = label_element, is_vertical = is_vertical, check.overlap = check.overlap)
16.     FUN(X[[i]], ...)
15.     lapply(dodge_indices, function(indices) { draw_axis_labels(break_positions = break_positions[indices], break_labels = break_labels[indices], label_element = label_element, is_vertical = is_vertical, check.overlap = check.overlap) ...
14.     draw_axis(break_positions = guide$key[[aesthetic]], break_labels = guide$key$.label, axis_position = guide$position, theme = theme, check.overlap = guide$check.overlap, angle = guide$angle, n.dodge = guide$n.dodge)
13.     guide_gengrob.axis(guide, theme)
12.     guide_gengrob(guide, theme)
11.     panel_guides_grob(panel_params$guides, position = "bottom", theme = theme)
10.     f(...)
9.      coord$render_axis_h(range, theme)
8.      f(...)
7.      self$facet$draw_panels(panels, self$layout, self$panel_scales_x, self$panel_scales_y, self$panel_params, self$coord, data, theme, self$facet_params)
6.      f(..., self = self)
5.      layout$render(geom_grobs, data, theme, plot$labels)
4.      ggplot_gtable.ggplot_built(data)
3.      ggplot_gtable(data)
2.      print.ggplot(x)
1.      (function (x, ...) UseMethod("print"))(x)
Could you publish your sessionInfo() with your examples? Perhaps this is a Windows - Mac difference, since Windows can be a bit fickle with RCurl?
Here's my sessionInfo:
> sessionInfo()
R version 3.6.0 (2019-04-26)
Platform: x86_64-w64-mingw32/x64 (64-bit)
Running under: Windows 10 x64 (build 18362)

Matrix products: default

locale:
[1] LC_COLLATE=English_United States.1252  LC_CTYPE=English_United States.1252
[3] LC_MONETARY=English_United States.1252 LC_NUMERIC=C
[5] LC_TIME=English_United States.1252

attached base packages:
[1] stats     graphics  grDevices utils     datasets  methods   base

other attached packages:
 [1] glue_1.4.1      ggtext_0.1.0    ggcharts_0.2.1  forcats_0.5.0   stringr_1.4.0
 [6] dplyr_0.8.5     purrr_0.3.4     readr_1.3.1     tidyr_1.0.3     tibble_3.0.1
[11] ggplot2_3.3.0   tidyverse_1.3.0

loaded via a namespace (and not attached):
 [1] Rcpp_1.0.4.6        lubridate_1.7.8     lattice_0.20-41     assertthat_0.2.1
 [5] digest_0.6.25       R6_2.4.1            cellranger_1.1.0    backports_1.1.6
 [9] reprex_0.3.0        httr_1.4.1          pillar_1.4.4        rlang_0.4.6
[13] curl_4.3            readxl_1.3.1        rstudioapi_0.11     labeling_0.3
[17] RCurl_1.98-1.2      munsell_0.5.0       gridtext_0.1.1      broom_0.5.6
[21] compiler_3.6.0      modelr_0.1.7        xfun_0.14           pkgconfig_2.0.3
[25] htmltools_0.4.0     tidyselect_1.0.0    fansi_0.4.1         crayon_1.3.4
[29] dbplyr_1.4.3        withr_2.2.0         bitops_1.0-6        grid_3.6.0
[33] nlme_3.1-147        jsonlite_1.6.1      gtable_0.3.0        lifecycle_0.2.0
[37] DBI_1.1.0           magrittr_1.5        scales_1.1.1        cli_2.0.2
[41] stringi_1.4.6       farver_2.0.3        fs_1.4.1            remotes_2.1.1
[45] xml2_1.3.2          ellipsis_0.3.0      generics_0.0.2      vctrs_0.2.4
[49] tools_3.6.0         markdown_1.1        hms_0.5.3           jpeg_0.1-8.1
[53] colorspace_1.4-1    mdthemes_0.0.0.9000 rvest_0.3.5         knitr_1.28
[57] haven_2.2.0         patchwork_1.0.0
Hi Mr. Wilke,
First of all, thank you so much for the amazing ggtext! Certainly an amazing step in the right direction. I was trying to insert a "code" markdown in the title of the ggplot2 but apparently, ggtext doesn't support it yet?
Please find below the reprex.
Best,
Alexis
library(ggtext)
library(tidyverse)

mpg %>%
  ggplot(mapping = aes(x = displ)) +
  geom_bar(fill = "#13364C") +
  labs(
    title = "This is a `geom_bar()` plot"
  )  +
  theme(
    plot.title = element_markdown()
  )
#> Error: gridtext has encountered a tag that isn't supported yet: <code>
#> Only a very limited number of tags are currently supported.
Created on 2020-10-11 by the reprex package (v0.3.0)
After installation of the new ggplot2 version 3.3.0 (CRAN), the ggtext::element_markdown() function does not work anymore. It produces the following error message:
Error in richtext_grob(label, x = x, y = y, hjust = hj, vjust = vj, halign = halign, : unused arguments (halign = halign, valign = valign)
Brief description of the problem or desired feature.
# insert reprex hereI tried setting the text theme element to element_markdown() but this results in an error:
library(ggplot2)
ggplot(mtcars, aes(hp, mpg)) +
  geom_point() +
  theme(text = ggtext::element_markdown())
Error: Theme element `text` has NULL property without default: fill, box.colour, linetype, linewidth, halign, valign, padding, r, align_widths, align_heights and rotate_margins
I thought I could use element_markdown() as a direct replacement for element_text() but apparently that's not the case. Is there any way to render all text as markdown other then setting each individual theme element, e.g. axis.text, plot.title etc.?
R version 3.6.3 (2020-02-29)
Platform: x86_64-w64-mingw32/x64 (64-bit)
Running under: Windows 10 x64 (build 17763)

Matrix products: default

locale:
[1] LC_COLLATE=German_Germany.1252  LC_CTYPE=German_Germany.1252
[3] LC_MONETARY=German_Germany.1252 LC_NUMERIC=C
[5] LC_TIME=German_Germany.1252

attached base packages:
[1] stats     graphics  grDevices utils     datasets  methods
[7] base

other attached packages:
[1] ggplot2_3.3.0

loaded via a namespace (and not attached):
 [1] Rcpp_1.0.4.6     rstudioapi_0.11  xml2_1.3.1
 [4] magrittr_1.5     tidyselect_1.0.0 ggtext_0.1.0
 [7] munsell_0.5.0    gridtext_0.1.1   colorspace_1.4-1
[10] R6_2.4.1         rlang_0.4.5      dplyr_0.8.5
[13] tools_3.6.3      grid_3.6.3       gtable_0.3.0
[16] withr_2.1.2      ellipsis_0.3.0   digest_0.6.25
[19] assertthat_0.2.1 tibble_3.0.1     lifecycle_0.2.0
[22] crayon_1.3.4     farver_2.0.3     purrr_0.3.4
[25] vctrs_0.2.4      glue_1.4.0       labeling_0.3
[28] compiler_3.6.3   pillar_1.4.3     scales_1.1.0
[31] pkgconfig_2.0.3
In trying out ggtext I found that element_textbox_simple is ignoring the hjust argument. Here's an example in which I tried to center the title, but it is still left-justified. On the other hand, element_textbox centers the title correctly. Also note, that element_textbox_simple fills the entire title strip, while element_textbox fills only the horizontal extent of the title text. I'm not sure if this is the intended behavior. I'm using version 0.1.0 of ggtext (SHA1: 3b25fca).
library(ggplot2)
library(ggtext)

ggplot(mtcars, aes(mpg, hp)) +
  geom_point() +
  labs(title="this is the title") +
theme(plot.title=element_textbox_simple(fill="red", hjust=0.5))ggplot(mtcars, aes(mpg, hp)) +
geom_point() +
labs(title="this is the title") +
theme(plot.title=element_textbox(fill="red", hjust=0.5))Created on 2020-02-06 by the reprex package (v0.3.0)
I create plots in Hebrew (written right to left), these work fine in base ggplot. but if I use grid-text, the direction turns. I tried amending it by stating <p dir=rtl> or <span dir=rtl> etc., but no dice.
The currently supported set of HTML/CSS features is extremely limited, and extending the supported feature set is an obvious priority for future development. This will require a new rendering engine, which is currently under development: https://clauswilke.com/sinab/
This issue serves as a catch-all for any feature requests that will be addressed by switching over to this engine. Features that are already known to work include:
<pre> and code> tags DF <- data.frame(x = rnorm(100),
y = rnorm(100),
z = rnorm(100),
type = c(rep('C', 50), rep('delta', 50)))
ggplot(DF) +
geom_point(aes(x, y, colour = z, shape = type)) +
scale_shape_discrete(labels = function(x) ifelse(x == 'C',
'<sup>14</sup>C',
'δ<sup>18</sup>O')) +
scale_colour_distiller(palette = 'RdBu', direction = 1) +
facet_wrap(vars(type)) +
theme(legend.text = ggtext::element_markdown())Error in grid.Call.graphics(C_setviewport, vp, TRUE) : non-finite location and/or size for viewport
and the figure comes without legend text:

The strange thing is that if I keep rerunning the code time after time, sometimes the plot can be rendered without error.

Versions:
It would be great if we could use <a href> or markdown links and they would be included as links when saving plots using SVG output. There are some existing solutions to this issue by modifying the produced SVG, but it seems more natural to do it with ggtext / gridtext.
library(ggplot2)
library(ggtext)
labels <- c(
  setosa = "<a href='https://en.wikipedia.org/wiki/Iris_setosa'>*I. setosa*</a>",
  virginica = "<a href='https://en.wikipedia.org/wiki/Iris_virginica'>*I. virginica*</a>",
  setosa = "<a href='https://en.wikipedia.org/wiki/Iris_versicolor'>*I. versicolor*</a>"
)

ggplot(iris, aes(Species, Sepal.Width)) +
  geom_boxplot() +
  scale_x_discrete(
    name = NULL,
    labels = labels
  ) +
  theme(
    axis.text.x = element_markdown(color = "black", size = 11)
  )
#> Error: gridtext has encountered a tag that isn't supported yet: <a>
#> Only a very limited number of tags are currently supported.
Created on 2020-02-06 by the reprex package (v0.3.0)
Thanks for the great package!
I would like to format labels and move the label position using the position argument of scale_x etc, but it doesn't seem to work.
library(ggplot2)
library(ggtext)

labels <- c(
  setosa = "This is<br>*I. setosa*",
  virginica = "This is<br>*I. virginica*",
  versicolor = "This is<br>*I. versicolor*"
)

# Works with labels on bottom
ggplot(iris, aes(Species, Sepal.Width)) +
  geom_boxplot() +
  scale_x_discrete(
    name = NULL,
    labels = labels
  ) +
  theme(
    axis.text.x = element_markdown(color = "black", size = 11)
  )
# But not on top
ggplot(iris, aes(Species, Sepal.Width)) +
geom_boxplot() +
scale_x_discrete(
position = "top",
name = NULL,
labels = labels
) +
theme(
axis.text.x = element_markdown(color = "black", size = 11)
)Created on 2019-09-29 by the reprex package (v0.3.0)
sessionInfo()
#> R version 3.6.0 (2019-04-26)
#> Platform: x86_64-apple-darwin15.6.0 (64-bit)
#> Running under: macOS High Sierra 10.13.6
#>
#> Matrix products: default
#> BLAS:   /Library/Frameworks/R.framework/Versions/3.6/Resources/lib/libRblas.0.dylib
#> LAPACK: /Library/Frameworks/R.framework/Versions/3.6/Resources/lib/libRlapack.dylib
#>
#> locale:
#> [1] en_US.UTF-8/en_US.UTF-8/en_US.UTF-8/C/en_US.UTF-8/en_US.UTF-8
#>
#> attached base packages:
#> [1] stats     graphics  grDevices utils     datasets  methods   base
#>
#> other attached packages:
#> [1] ggtext_0.1.0  ggplot2_3.2.1
#>
#> loaded via a namespace (and not attached):
#>  [1] Rcpp_1.0.2       pillar_1.4.2     compiler_3.6.0   highr_0.8
#>  [5] tools_3.6.0      digest_0.6.21    evaluate_0.14    tibble_2.1.3
#>  [9] gtable_0.3.0     pkgconfig_2.0.3  rlang_0.4.0      curl_4.2
#> [13] yaml_2.2.0       xfun_0.9         withr_2.1.2      dplyr_0.8.3
#> [17] stringr_1.4.0    httr_1.4.1       knitr_1.25       xml2_1.2.2
#> [21] grid_3.6.0       tidyselect_0.2.5 gridtext_0.1.0   glue_1.3.1
#> [25] R6_2.4.0         rmarkdown_1.15   purrr_0.3.2      magrittr_1.5
#> [29] scales_1.0.0     htmltools_0.3.6  assertthat_0.2.1 mime_0.7
#> [33] colorspace_1.4-1 labeling_0.3     stringi_1.4.3    lazyeval_0.2.2
#> [37] munsell_0.5.0 markdown_1.1 crayon_1.3.4Adding "\n " in a caption doesn't create a new line.
Thanks again for this package! It's a huge help for me, and I would love to help making it even better.
Description: The label.padding argument of geom_richtext fails with:
Error in `[.unit`(padding, c(1, 3)): index out of bounds ('unit' subsetting)when less than four arguments are passed.
I expected that similarly to geom_label, unit(0.5, "lines") would be a valid value.
library(ggplot2)
library(ggtext)

df <- data.frame(
  label = c("Some text **in bold.**"),
  x = c(.5),
  y = c(.5)
)


ggplot(df) +
  aes(x, y, label = label) +
  geom_richtext(
    label.padding = unit(0.5, "lines")
  )
#> Error in `[.unit`(padding, c(1, 3)): index out of bounds ('unit' subsetting)
Created on 2019-12-18 by the reprex package (v0.3.0)
Passing all the four values works:
library(ggplot2)
library(ggtext)

df <- data.frame(
  label = c("Some text **in bold.**"),
  x = c(.5),
  y = c(.5)
)


ggplot(df) +
  aes(x, y, label = label) +
  geom_richtext(
    label.padding = unit(c(0.5, 0.5, 0.5, 0.5), "lines")
  )
Created on 2019-12-18 by the reprex package (v0.3.0)
It seems to be related to the previously opened issue about the failing annotate() #8, which was worked around in c4538ec by adding all four arguments to the default argument in draw_panel().
The user-level workaround for now would be to use unit(rep(0.5, 4), "lines") which is slightly more verbose, but still allows to quickly adjust the value for all four sides.
Solution proposition:
Would adding following lines to the body of geom_richtext() be a good solution to this issue (it works locally for me)?
if (length(label.padding) == 1) {
    label.padding = rep(label.padding, 4)
}
I would be happy to create a PR if you agree that this is thee way forward.
I have been trying to place the following label on my axis: [La-] (mmol·L-1).
The problem is that it seems the use of [ ] and ( ) is causing a bug.
reprex with bug:
library(ggplot2)
library(ggtext)

ggplot(mtcars, aes(mpg, hp)) +
  geom_point() +
  labs(x = "[La<sup>-</sup>] (mmol·L<sup>-1</sup>)") +
  theme(axis.title.x = element_markdown())
#> Error: gridtext has encountered a tag that isn't supported yet: <a>
#> Only a very limited number of tags are currently supported.
Created on 2020-06-06 by the reprex package (v0.3.0)
When I use ( ) instead of [ ], the bug seems to disappear:
library(ggplot2)
library(ggtext)

ggplot(mtcars, aes(mpg, hp)) +
  geom_point() +
  labs(x = "(La<sup>-</sup>) (mmol·L<sup>-1</sup>)") +
  theme(axis.title.x = element_markdown())
Created on 2020-06-06 by the reprex package (v0.3.0)
Any thoughts on this?
Getting the error
Error in (angle %||% 0)%%360 : non-numeric argument to binary operator
Whenever I try to use the element_markdown() function in any plot. I've tried copying the examples with the iris dataset directly and get the same issue.
I'm on the latest version of R and ggplot.
Thanks.
As a user, I expect all basic Markdown syntax (see bullets 1, 2, and 3 below) to be supported correctly. Making new lines, bold, and italic text as well as escaping symbols (\* \_" \^ \~ \\ $) works as expected.
But there are the following issues:
<code> and <del> are not supported (see examples below). Most probably, it's an issue in gridtext package.The examples of issues in rendering Markdown syntax elements
(sorry for the large images: I'm not sure how to control the size of them with reprex)
library(ggplot2)
library(ggtext)


gg_example <- function(str) {
  ggplot() +
  ggtitle(str) +
  theme(plot.title = element_markdown(lineheight = 1.1))
}
# NOT OK (does not close correctly)
gg_example("normal ^superscript^ normal")# NOT OK (does not close correctly)
gg_example("Length (cm^2^)")# Does not work:
gg_example("normal ~subscript~ normal")# Does not work:
gg_example("(CO~2~) ")# Does not work:
gg_example("endash: --")# Does not work:
gg_example("emdash: ---")# Not OK (not interpreted as Equation):
gg_example("equation: $A = \\pi*r^{2}$")# Error
gg_example("normal `verbatim code` normal")
#> Error: gridtext has encountered a tag that isn't supported yet: <code>
#> Only a very limited number of tags are currently supported.
# Error
gg_example("normal ~~strikethrough~~ normal")
#> Error: gridtext has encountered a tag that isn't supported yet: <del>
#> Only a very limited number of tags are currently supported.Created on 2020-01-30 by the reprex package (v0.3.0)
The examples of code with Markdown syntax elements that are rendered as expected.
# OK
gg_example(
"End a line with two spaces
to start a new paragraph."
)

# OK
gg_example("normal *italics* normal")
gg_example("normal _italics_ normal")

# OK
gg_example("normal **bold** normal")
gg_example("normal __bold__ normal")

# OK
gg_example("normal **_bold italics_** normal")

# OK
gg_example("escaped: \\*")
gg_example("escaped: \\_")
gg_example("escaped: \\^")
gg_example("escaped: \\~")
gg_example("escaped: \\\\")
gg_example("escaped: \\$")library(glue)
library(ggtext)
library(ggplot2)
count(mtcars, cyl, carb) %>%
mutate(cyl_lab = as.character(
glue("Cylinders {cyl} <span style='color:red'>(n={n})</span>")
)) %>%
ggplot(aes(carb, n)) +
geom_col() +
facet_wrap(~cyl_lab) +
theme(
strip.text = element_markdown(),
strip.text.x = element_markdown(),
strip.text.y = element_markdown()
)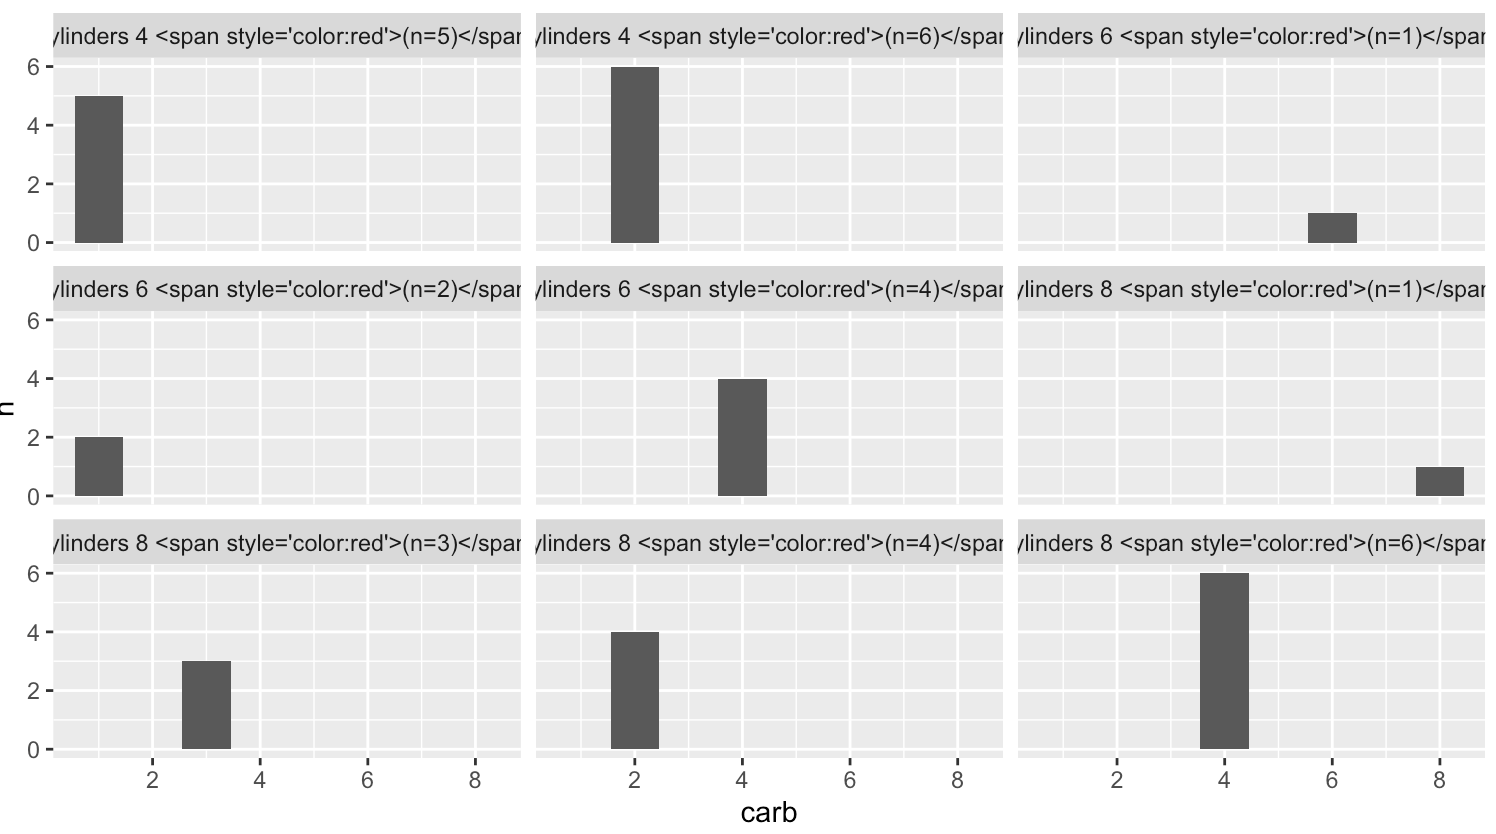
I'll poke at why this isn't working this weekend.
Thanks for this package!
I notice that when using a diaeresis (e.g. ë), the title gets additional whitespace after the word that contains it:
library(ggplot2)
library(ggtext)

ggplot(mtcars, aes(mpg, wt)) +
  geom_point() +
  labs(title = "Test with ë diaeresis") +
  theme(plot.title = element_markdown())
On a fresh install of ggtext I get this error with the example from the readme:
Error in (angle %||% 0)%%360 : non-numeric argument to binary operator
Tried a simplified version of the example from the readme (shown below) and got the same error. Tested on macOS and Linux.
ggplot(iris, aes(Sepal.Length, Sepal.Width, color = Species)) +
  geom_point(size = 3) +
  labs(
    title = "**Fisher's *Iris* dataset**",
    x = "Sepal length (cm)", y = "Sepal width (cm)"
  ) +
  theme_minimal() +
  theme(
    plot.title = element_markdown(lineheight = 1.1),
    legend.text = element_markdown(size = 11)
  )
My colleague is getting the same error on his system.
Thanks very much for the package - looks great.
─ Session info ───────────────────────────────────────────────────────────────────────────────────────────────────────────
setting value
version R version 3.6.1 (2019-07-05)
os macOS Catalina 10.15.1
system x86_64, darwin15.6.0
ui RStudio
language (EN)
collate en_CA.UTF-8
ctype en_CA.UTF-8
tz America/Toronto
date 2020-01-31
─ Packages ───────────────────────────────────────────────────────────────────────────────────────────────────────────────
package * version date lib source
assertthat 0.2.1 2019-03-21 [1] CRAN (R 3.6.0)
backports 1.1.5 2019-10-02 [1] CRAN (R 3.6.0)
callr 3.3.1 2019-07-18 [1] CRAN (R 3.6.0)
cli 2.0.1 2020-01-08 [1] CRAN (R 3.6.1)
colorspace 1.4-1 2019-03-18 [1] CRAN (R 3.6.0)
crayon 1.3.4 2017-09-16 [1] CRAN (R 3.6.0)
desc 1.2.0 2018-05-01 [1] CRAN (R 3.6.0)
devtools * 2.1.0 2019-07-06 [1] CRAN (R 3.6.0)
digest 0.6.23 2019-11-23 [1] CRAN (R 3.6.0)
dplyr 0.8.3 2019-07-04 [1] CRAN (R 3.6.0)
fansi 0.4.1 2020-01-08 [1] CRAN (R 3.6.0)
farver 2.0.3 2020-01-16 [1] CRAN (R 3.6.0)
fs 1.3.1 2019-05-06 [1] CRAN (R 3.6.0)
ggplot2 * 3.2.1 2019-08-10 [1] CRAN (R 3.6.0)
ggtext * 0.1.0 2020-01-31 [1] Github (3b25fca)
glue 1.3.1 2019-03-12 [1] CRAN (R 3.6.0)
gridtext * 0.1.0 2020-01-24 [1] CRAN (R 3.6.0)
gtable 0.3.0 2019-03-25 [1] CRAN (R 3.6.0)
labeling 0.3 2014-08-23 [1] CRAN (R 3.6.0)
lazyeval 0.2.2 2019-03-15 [1] CRAN (R 3.6.0)
lifecycle 0.1.0 2019-08-01 [1] CRAN (R 3.6.0)
magrittr 1.5 2014-11-22 [1] CRAN (R 3.6.0)
markdown 1.1 2019-08-07 [1] CRAN (R 3.6.0)
memoise 1.1.0 2017-04-21 [1] CRAN (R 3.6.0)
munsell 0.5.0 2018-06-12 [1] CRAN (R 3.6.0)
packrat 0.5.0 2018-11-14 [1] CRAN (R 3.6.0)
pillar 1.4.3 2019-12-20 [1] CRAN (R 3.6.0)
pkgbuild 1.0.4 2019-08-05 [1] CRAN (R 3.6.0)
pkgconfig 2.0.3 2019-09-22 [1] CRAN (R 3.6.0)
pkgload 1.0.2 2018-10-29 [1] CRAN (R 3.6.0)
prettyunits 1.1.0 2020-01-09 [1] CRAN (R 3.6.0)
processx 3.4.1 2019-07-18 [1] CRAN (R 3.6.0)
ps 1.3.0 2018-12-21 [1] CRAN (R 3.6.0)
purrr 0.3.3 2019-10-18 [1] CRAN (R 3.6.0)
R6 2.4.1 2019-11-12 [1] CRAN (R 3.6.0)
Rcpp 1.0.3 2019-11-08 [1] CRAN (R 3.6.0)
remotes 2.1.0 2019-06-24 [1] CRAN (R 3.6.0)
rlang 0.4.2 2019-11-23 [1] CRAN (R 3.6.0)
rprojroot 1.3-2 2018-01-03 [1] CRAN (R 3.6.0)
rstudioapi 0.10 2019-03-19 [1] CRAN (R 3.6.0)
scales 1.1.0 2019-11-18 [1] CRAN (R 3.6.0)
sessioninfo 1.1.1 2018-11-05 [1] CRAN (R 3.6.0)
stringi 1.4.5 2020-01-11 [1] CRAN (R 3.6.0)
stringr 1.4.0 2019-02-10 [1] CRAN (R 3.6.0)
testthat 2.2.1 2019-07-25 [1] CRAN (R 3.6.0)
tibble 2.1.3 2019-06-06 [1] CRAN (R 3.6.0)
tidyselect 0.2.5 2018-10-11 [1] CRAN (R 3.6.0)
usethis * 1.5.1.9000 2019-08-19 [1] Github (r-lib/usethis@bcef417)
withr 2.1.2 2018-03-15 [1] CRAN (R 3.6.0)
xml2 1.2.2 2019-08-09 [1] CRAN (R 3.6.1)
Hi Claus,
thanks again for your wonderful contribution to the ggplot2-verse! I love this package and use it for almost all plots since then and it works like a charm - most of the time. I know it's a dev version so I just want to report a bug I've found (without expecting you to fix it soon):
options(warn = -1)

library(tidyverse)
library(ggtext)

theme_update(axis.text.x = element_markdown(size = 15))

labs <- c("**ten**", "<i>twenty</i>", "<span style='color:#0072B2'>thirty<span>")

## axis text modifications are working perfectly...
ggplot(mtcars, aes(mpg, cyl)) +
  geom_point() +
  scale_x_continuous(breaks = c(10, 20, 30),
labels = labs)### ... until one changes their position:
ggplot(mtcars, aes(mpg, cyl)) +
geom_point() +
scale_x_continuous(position = "top",
breaks = c(10, 20, 30),
labels = labs)Created on 2019-12-13 by the reprex package (v0.3.0)
All the best, Cédric
Do I need to say more? ;)

library(ggplot2)
library(ggtext)
library(gganimate)
library(magick)
plot <- ggplot(data.frame(step = 1:3), aes(x = step, y = step)) +
    ggtitle("({frame}/9) Hi there. I should not be jumping like this!") +
    theme(plot.title = element_markdown()) +
    transition_manual(step)
anim <- animate(plot, renderer = function(frames, fps) {
    pngs <- image_read(frames)
    gifs <- image_animate(pngs, dispose = "previous")
    image_write(gifs, "animation_test.gif")
})
library(ggplot2)
library(ggtext)
library(gganimate)
library(magick)
plot <- ggplot(data.frame(step = 1:3), aes(x = step, y = step)) +
    ggtitle("({frame}/9) Hi there. Without element_markdown, I stand still!") +
    # theme(plot.title = element_markdown()) +
    transition_manual(step)
anim <- animate(plot, renderer = function(frames, fps) {
    pngs <- image_read(frames)
    gifs <- image_animate(pngs, dispose = "previous")
    image_write(gifs, "animation_test.gif")
})As per issue 13, I installed ggplot2 via remotes::install_github("tidyverse/ggplot2"). Solved the "Error in (angle %||#...) issue, but leads to a new one involving "repair"
Error: repair must be a character vector of length 1. I'll attach the rlang::last_error and rlang::last_trace, and the sessionInfo below
Backtrace:
repair must be a character vector of length 1.
Backtrace:
█
└─ggplot2:::by_layer(function(l, d) l$compute_aesthetics(d, plot))
└─ggplot2:::f(l = layers[[i]], d = data[[i]])
└─l$compute_aesthetics(d, plot)
└─ggplot2:::f(..., self = self)
└─ggplot2:::as_gg_data_frame(evaled)
├─ggplot2:::new_data_frame(tibble::as_tibble(x))
├─tibble::as_tibble(x)
└─tibble:::as_tibble.list(x)
└─tibble:::lst_to_tibble(x, .rows, .name_repair, col_lengths(x))
└─tibble:::set_repaired_names(x, .name_repair)
├─rlang::set_names(...)
│ └─rlang:::set_names_impl(x, x, nm, ...)
│ └─rlang::is_function(nm)
│ └─rlang::is_closure(x)
└─tibble:::repaired_names(...)
├─tibble:::subclass_name_repair_errors(...)
│ ├─base::tryCatch(...)
│ │ └─base:::tryCatchList(expr, classes, parentenv, handlers)
│ │ ├─base:::tryCatchOne(...)
│ │ │ └─base:::doTryCatch(return(expr), name, parentenv, handler)
│ │ └─base:::tryCatchList(expr, names[-nh], parentenv, handlers[-nh])
│ │ ├─base:::tryCatchOne(...)
│ │ │ └─base:::doTryCatch(return(expr), name, parentenv, handler)
│ │ └─base:::tryCatchList(expr, names[-nh], parentenv, handlers[-nh])
│ │ └─base:::tryCatchOne(expr, names, parentenv, handlers[[1L]])
│ │ └─base:::doTryCatch(return(expr), name, parentenv, handler)
│ └─base::force(expr)
└─vctrs::vec_as_names(name, repair = .name_repair, quiet = quiet)
└─vctrs:::validate_repair(repair)
└─rlang::arg_match(repair)
I have tried using the geom_richtext with annotate in two ways, both of which failed:
annotate(geom='richtext', x=8, y=4, label='<i>potential outlier?</i>')or
annotate(geom='geom_richtext', x=8, y=4, label='<i>potential outlier?</i>')with:
Error: Can't find `geom` called "(geom_)richtext"
and
annotate(geom=GeomRichText, x=8, y=4, label='<i>potential outlier?</i>')with:
Error in `[.unit`(padding, c(1, 3)) :
  index out of bounds ('unit' subsetting)
Calls: <Anonymous> ... convertHeight -> convertUnit -> is.unit -> [ -> [.unit
If this is just an unexplored corner case (and not something which would require a lot of work), this could be very useful to have. A full example:
library(ggplot2)
library(ggtext)

ggplot(iris, aes(Sepal.Length, Sepal.Width, color = Species)) +
  geom_point(size = 3) +
  scale_color_manual(
    name = NULL,
    values = c(setosa = "#0072B2", virginica = "#009E73", versicolor = "#D55E00"),
    labels = c(
      setosa = "<i style='color:#0072B2'>I. setosa</i>",
      virginica = "<i style='color:#009E73'>I. virginica</i>",
      versicolor = "<i style='color:#D55E00'>I. versicolor</i>")
  ) +
  labs(
    title = "**Fisher's *Iris* dataset**
    <span style='font-size:9pt'>Sepal width vs. sepal length for three *Iris*
    species</span>",
    x = "Sepal length (cm)", y = "Sepal width (cm)"
  ) +
  annotate(geom='richtext', x=8, y=4, label='<i>potential outlier?</i>') +
  theme_minimal() +
  theme(
    plot.title = element_markdown(lineheight = 1.1),
    legend.text = element_markdown(size = 11)
)Hi,
This package is great and will undoubtedly save lots of people lots of headaches. I am wondering if you would be able to add additional support to be able to inject LaTeX math into the text for plots. I did notice you have shown an example of using HTML tags to do things like superscripts and subscripts, however, I think many users will be more familiar with writing more complex equations using LaTeX.
I really have no idea of the difficulty in adding this feature, but it would be great to use some sort of system like R Markdown uses, where it seems to parse the $$ and renders all text inside as LaTeX math. This would certainly be an amazing feature, in my eyes.
Something like:
iris %>%
  ggplot(aes(Sepal.Length, Sepal.Width)) +
  geom_point() +
  geom_smooth(method = 'lm') +
  labs(title = "The line in this plot represents $\hat{y}=\beta_0+\beta_1x_1$")
Thank you for your work.
Could you provide the text buffer feature, for example in geom_richtext()? It will be super useful for maps! Something like this:
 #
#
Hi everyone
I'm plotting a weekly temperature data series (values every 10 minutes) and would like to overlay a table with daily max/min temperature in my plot. Max/min temp are in a dedicated data.frame object. Is it possible to use geom_richtext in this case?
Thanks in advance
At times with geom_textbox,
it would be helpful to have more control of the width of each line in each box, and to be able to make some boxes quite wide, and others more narrow.
Currently geom_textbox seems to arbitrarily decide when to put in line breaks to produce even line lengths, which makes textboxes that are wide and not very tall impossible.
Alternatively, to have an option to be able to assign to all boxes an option to never wrap lines unless there is a
could also work.
# insert reprex hereA declarative, efficient, and flexible JavaScript library for building user interfaces.
🖖 Vue.js is a progressive, incrementally-adoptable JavaScript framework for building UI on the web.
TypeScript is a superset of JavaScript that compiles to clean JavaScript output.
An Open Source Machine Learning Framework for Everyone
The Web framework for perfectionists with deadlines.
A PHP framework for web artisans
Bring data to life with SVG, Canvas and HTML. 📊📈🎉
JavaScript (JS) is a lightweight interpreted programming language with first-class functions.
Some thing interesting about web. New door for the world.
A server is a program made to process requests and deliver data to clients.
Machine learning is a way of modeling and interpreting data that allows a piece of software to respond intelligently.
Some thing interesting about visualization, use data art
Some thing interesting about game, make everyone happy.
We are working to build community through open source technology. NB: members must have two-factor auth.
Open source projects and samples from Microsoft.
Google ❤️ Open Source for everyone.
Alibaba Open Source for everyone
Data-Driven Documents codes.
China tencent open source team.


