teunbrand / ggh4x Goto Github PK
View Code? Open in Web Editor NEWggplot extension: options for tailored facets, multiple colourscales and miscellaneous
Home Page: https://teunbrand.github.io/ggh4x/
License: Other
ggplot extension: options for tailored facets, multiple colourscales and miscellaneous
Home Page: https://teunbrand.github.io/ggh4x/
License: Other


Hi teunbrand! I can't seem to install the ggh4x package. I get this error everytime devtools::install_github("teunbrand/ggh4x"). I have ggplot2 v3.3.2 installed
Downloading GitHub repo teunbrand/ggh4x@HEAD
✓  checking for file ‘/private/var/folders/mz/k82y38y17c12gkyszy_ck9k4lp_bgs/T/RtmpwY7KQW/remotesaee5797902d5/teunbrand-ggh4x-a1fc0b4/DESCRIPTION’ ...
─  preparing ‘ggh4x’: (406ms)
✓  checking DESCRIPTION meta-information ...
─  checking for LF line-endings in source and make files and shell scripts
─  checking for empty or unneeded directories
─  building ‘ggh4x_0.1.0.9000.tar.gz’
   Warning: invalid uid value replaced by that for user 'nobody'
   Warning: invalid gid value replaced by that for user 'nobody'

Installing package into ‘/Users/Library/R/3.6/library’
(as ‘lib’ is unspecified)
* installing *source* package ‘ggh4x’ ...
** using staged installation
** R
** byte-compile and prepare package for lazy loading
Error: (converted from warning) package ‘ggplot2’ was built under R version 3.6.2
Execution halted
ERROR: lazy loading failed for package ‘ggh4x’
* removing ‘/Users/Library/R/3.6/library/ggh4x’
Error: Failed to install 'ggh4x' from GitHub:
  (converted from warning) installation of package ‘/var/folders/mz/k82y38y17c12gkyszy_ck9k4lp_bgs/T//RtmpwY7KQW/fileaee577a92c40/ggh4x_0.1.0.9000.tar.gz’ had non-zero exit status
Error: a problem at render time when trying to display 10 or more cases.
When I use facet_nested with a lot of cases with geom_col I get an error. I made an example where I can display correctly 9 cases but it fails with 10.
library(tidyverse)
library(ggh4x)

df <- mtcars %>%
  rownames_to_column('model') %>%
  mutate(brand = str_extract(model, '(.*?) '),
         brand = coalesce(brand, model))

df %>%
  slice(1:9) %>%
  ggplot(aes(x = model, y = mpg)) +
  geom_col() +
  ggh4x::facet_nested(cols = vars(brand, model),
                      scales = 'free_x', space = 'free_x')
df %>%
slice(1:10) %>% # One aditional case.
ggplot(aes(x = model, y = mpg)) +
geom_col() +
ggh4x::facet_nested(cols = vars(brand, model),
scales = 'free_x', space = 'free_x')
#> Error: grobs must either be a single grob or a list of grobsCreated on 2020-03-20 by the reprex package (v0.3.0)
While calculating ticks, we assign the theme element axis.tick.length twice for the same grob. This flaw exist in ggplot2 too, but I'm not keen on bothering these good folks since I've flooded their issues page enough with silly issues.
Specifically here:
Lines 59 to 60 in 6079af2
param$pos is an npc unit. param$tick_dir is a unitless scalar (-1 or 1) and length is the tick length in whatever units the user defined in the theme. This means that pos before updating becomes a compound unit of unit([-1/1], "npc") + user_unit.
Later, we again assign the tick length to the grob size:
Lines 72 to 73 in 6079af2
One of these should be enough. Since they are the same, this is fine in theory but becomes problematic for teunbrand/elementalist#3. Since we've refactored the guide drawing already here, it would be best to provide a vannila guide_axis2() that omits this redundancy and fixes the issue over at elementalist.
Also, we make the same mistake in guide_axis_minor.R. This doesn't make any sense, as we're already defining the minor ticks relative to the major ticks, so we could just keep everything in the grob in npc coordinate space and assign the absolute length later for the grob as a whole.
Nothing apparently changes if we substitute the first unit assignment with just simple npc units. When guides in ggplot2 are being refactored, likely because of switching to the ggproto system, I'll try to sneak the idea in that they should omit 1 of the 2 unit assignments (preferably the one in the grob).
Convenient if you want to use a secondary discrete axis for labeling. Control at the scale level would also propagate to the secondary axis.
And not to the facets themselves. I think this distinction might have caused some confusion here.
Often enough you want your x-scales to depend on the y-scale. For example, you want to order the x-axis based on the values of the y-axis. You can get around this now by pre-ordering factor levels, but this might as well happen at the scale level. I want to explore the following:
ggplot2:::RangeDiscrete that aside from tracking unique levels on the x-axis that will track a semblance of the y-values too?ScaleDiscretePosition that maps the x-values to the tracked levelsaes(x = include(xvar), ...) or something; I still have to figure out the name. A convenient side-effect is that you can then wrap the output of include() in a class that will automatically trigger the scale_x_tracked() or however I'm going to name it.Using the following time series data
VARIANCE<-structure(list(MODEL = c("RECOV", "RECOV", "RECOV", "RECOV", "RECOV", "RECOV", "RECOV", "RECOV", "RECOV", "RECOV", "RECOV", "RECOV", "RECOV", "RECOV", "RECOV", "RECOV", "RECOV", "RECOV", "RECOV", "RECOV", "RECOV", "RECOV", "RECOV", "RECOV", "RECOV", "RECOV", "RECOV", "RECOV", "RECOV", "RECOV", "RECOV", "RECOV", "RECOV", "RECOV", "RECOV", "RECOV", "RECOV", "RECOV", "RECOV", "RECOV", "RECOV", "RECOV", "RECOV", "RECOV", "RECOV", "SHAR", "SHAR", "SHAR", "SHAR", "SHAR", "SHAR", "SHAR", "SHAR", "SHAR", "SHAR", "SHAR", "SHAR", "SHAR", "SHAR", "SHAR", "SHAR", "SHAR", "SHAR", "SHAR", "SHAR", "SHAR", "SHAR", "SHAR", "SHAR", "SHAR", "SHAR", "SHAR", "SHAR", "SHAR", "SHAR", "SHAR", "SHAR", "SHAR", "SHAR", "SHAR", "SHAR", "SHAR", "SHAR", "SHAR", "SHAR", "SHAR", "SHAR", "SHAR", "SHAR", "SHAR"), name = structure(c(1L, 2L, 3L, 4L, 5L, 11L, 12L, 13L, 14L, 15L, 6L, 7L, 8L, 9L, 10L, 1L, 2L, 3L, 4L, 5L, 11L, 12L, 13L, 14L, 15L, 6L, 7L, 8L, 9L, 10L, 1L, 2L, 3L, 4L, 5L, 11L, 12L, 13L, 14L, 15L, 6L, 7L, 8L, 9L, 10L, 1L, 2L, 3L, 4L, 5L, 11L, 12L, 13L, 14L, 15L, 6L, 7L, 8L, 9L, 10L, 1L, 2L, 3L, 4L, 5L, 11L, 12L, 13L, 14L, 15L, 6L, 7L, 8L, 9L, 10L, 1L, 2L, 3L, 4L, 5L, 11L, 12L, 13L, 14L, 15L, 6L, 7L, 8L, 9L, 10L), .Label = c("From others to NSW", "From others to QLD", "From others to SA", "From others to TAS", "From others to VIC", "Net NSW", "Net QLD", "Net SA", "Net TAS", "Net VIC", "To others from NSW", "To others from QLD", "To others from SA", "To others from TAS", "To others from VIC"), class = "factor"), value = c(4.39666597202896, 3.58762190497229, 4.30146313827031, 3.54812042879641, 4.43158464041545, 5.18520098870974, 3.27054464036042, 5.26640903744102, 3.10418977364104, 5.36337411384991, 0.788535016680784, -0.317077264611877, 0.964945899170713, -0.44393065515537, 0.931789473434457, 4.39509970212315, 3.59063595048007, 4.29749359454961, 3.5440048555318, 4.42683221820271, 5.18051503751689, 3.27437015775553, 5.25235072116727, 3.09408850709962, 5.35441540065628, 0.785415335393744, -0.316265792724537, 0.954857126617668, -0.449916348432182, 0.927583182453565, 4.3943104511415, 3.58990247949796, 4.29516509109662, 3.54864931461666, 4.42682253305903, 5.17365373149387, 3.26812914873157, 5.23933592999296, 3.08592441369308, 5.34801447553526, 0.779343280352365, -0.321773330766394, 0.944170838896331, -0.462724900923573, 0.921191942476225, 4.4395, 4.03075, 4.319, 4.0895, 4.40075, 5.50775, 2.56, 4.93, 3.08325, 5.244, 1.06825, -1.47075, 0.611, -1.00625, 0.84325, 4.442, 4.015, 4.324, 4.1045, 4.40475, 5.4955, 2.49525, 4.9655, 3.1115, 5.268, 1.0535, -1.51975, 0.6415, -0.993, 0.86325, 4.44475, 3.99575, 4.332, 4.1205, 4.411, 5.5015, 2.4375, 5.00625, 3.144, 5.2925, 1.05675, -1.55825, 0.67425, -0.9765, 0.8815), DATE = structure(c(14821, 14821, 14821, 14821, 14821, 14821, 14821, 14821, 14821, 14821, 14821, 14821, 14821, 14821, 14821, 14822, 14822, 14822, 14822, 14822, 14822, 14822, 14822, 14822, 14822, 14822, 14822, 14822, 14822, 14822, 14823, 14823, 14823, 14823, 14823, 14823, 14823, 14823, 14823, 14823, 14823, 14823, 14823, 14823, 14823, 14821, 14821, 14821, 14821, 14821, 14821, 14821, 14821, 14821, 14821, 14821, 14821, 14821, 14821, 14821, 14822, 14822, 14822, 14822, 14822, 14822, 14822, 14822, 14822, 14822, 14822, 14822, 14822, 14822, 14822, 14823, 14823, 14823, 14823, 14823, 14823, 14823, 14823, 14823, 14823, 14823, 14823, 14823, 14823, 14823), .Dim = c(90L, 1L), .Dimnames = list(NULL, NULL))), row.names = c(NA, -90L), class = c("tbl_df", "tbl", "data.frame"))
This work
ggplot(VARIANCE, aes(y=value, x=DATE, color= MODEL))+ geom_line() + facet_wrap(vars(name), ncol = 5, scales = "free_y")+ facetted_pos_scales( y = rep(list( scale_y_continuous(limits = c(1.5, 5)), scale_y_continuous(limits = c(-2.2, 2)), scale_y_continuous(limits = c(1, 7)) ), each = 5) )+ theme_test() + theme(axis.text.x = element_text(angle = 45, hjust = 1))

but when i use that
as.Date(VARIANCE$DATE ,origin="1970-01-01")
I get the following error Error: Invalid input: date_trans works with objects of class Date only
Hello,
When trying to use facet_nested:
p <- ggplot(table, aes(fill = difference, x = ind, y = difference)) +
    geom_bar(position="stack", stat="identity", colour="black", width=1) +
    facet_nested(.~class+dataset) +
    theme_minimal() +
    theme(axis.text.x = element_text(angle = 90, vjust = 0.5, hjust=1),
          legend.position = "bottom",
          plot.title = element_text(hjust = 0.5)) +
    labs(title=symbol, x ="Sample", y = "Isoform % expression difference") +
    scale_fill_gradient2(low='darkorange', mid='snow3', high='darkblue', space='Lab')
I'm getting this error message:
Error in facet_nested(. ~ class + dataset) : object '.int' not found
Have you considered submitting to https://github.com/ggplot2-exts/gallery#adding-a-ggplot2-extension ?
The panelsizes are not propagated to the strips, whereas they should.
Found out about this trying to fix #4, but feel it is a different issue.
When using facet_nested(), is there a way to merge the panels of low hierarchy variables? With the purpose of, for instance, setting panel.spacing parameter in a way that only affects higher order variables in the hierarchy defined in facet_nested() or removing borders between low hierarchy variables.
I attach an example.
data <- data.frame(a <- sample(c("A", "B"), 30, replace = T),
                   b <- sample(c("X", "Y"), 30, replace = T),
                   c <- sample(c("good", "bad"), 30, replace=T))
colnames(data) <- c("a", "b", "c")

p <- ggplot(data=data, aes(x=a, y=c)) +
  geom_point() +
  theme_bw() +
  theme(axis.text.y=element_blank(), axis.ticks=element_blank(), panel.grid.major=element_blank())

p + facet_nested(c ~ a + b)

I edited the picture. Now panels of "A" and "B" as a function of "bad" and "good" are merged and it could be possible to delete borders and spacing between "X" and "Y" inside those panels.

Hello, I see this problem in revdep checks:
  Expected match: "The `nonsense` package is required"
  Actual message: "The package `nonsense` is required for `test`."
In general you shouldn’t be testing the contents of error messages that come from another package, since those can change at any point. Can you look into expect_snapshot() please? It allows you to monitor changes to messages without causing failures in CRAN checks. See https://testthat.r-lib.org/articles/snapshotting.html
We plan to release rlang 1.0.0 in 2 to 4 weeks.
I found your code via StackOverflow, but I don't have enough reputation to comment on your answer there. Someone else seems to have had a similar issue, and I tried loading the packages that you suggested (grid and gtable), but I'm still getting the error.
In full, it's:
Error in facet_nested(time ~ place + Hs_group) : object '.int' not found
My full code is:
nested<-ggplot(longpreds, aes(x = current, y = upper, group = Tp, col = Tp)) +
  geom_line() +
  geom_line(aes(y=lower))+
  facet_nested(time ~place+ Hs_group)+
  geom_ribbon(data=longpreds, aes(x=current, ymin=lower, ymax=upper, fill=Tp), alpha=0.3)+
  scale_color_brewer(palette="Paired")+
  scale_fill_brewer(palette="Paired")+
  labs(x="Current (m/s)",y="Depth (m)",fill="Wave period (Tp)", color="Wave period (Tp)")+
  ylim(-15,-2)+
  scale_x_continuous(breaks = seq(0, 0.3, by = 0.1), limits=c(0,0.26))+
  theme_bw()+
  theme(
    #strip.text=element_blank(),
    #axis.title.y = element_blank(),
        legend.title = element_text(size=14),
        legend.text = element_text(size=12),
        axis.text = element_text(size = 12),
        axis.title=element_text(size=14))
It's basically panels with two lines with shading in between using geom_ribbon
Any clue what might be going wrong?
As per discussion here, it might be a good idea to provide an alternative for matching up facet order with the extra scales. This might improve programmatic construction of the scales.
Potential options:
hi,
I had a weird bug with your package (that I love).
with data having 6 column (x,y,cluster,batch,group,value) and the y value being different fro each "cluster".
When I run a code like below; the y ids from the first cluster are repeating themselves for each cluster's facet
I fixed different values to see point size I see differences thus only the y-axis is repeating and not all values.
ggplot(data,aes(x,y,size=value))+
facet_nest(cluster~batch+group,scales='free_y',space='free_y')+
geom_point()
lastly I did
devtools::install_github('teunbrand/ggh4x',ref='v0.1.1')
And it fixed the issue.
I will try to come up with a more reproducible example later.
When I try to load the library, I get the error:
15:06:58> library(ggh4x)
Error: package or namespace load failed for ‘ggh4x’:
 object 'guide_transform' not found whilst loading namespace 'ggh4x'
It seems to be conflicting with the tidyverse package. When I restart R, and just load this package, it works.
If you want a to have a line at some place, but not a full rectangle; it would make sense to me that it would be possible to implement something like element_part_rect(side = "tlbr", fill = NA, colour = "black"). The side argument (abbrevated: top, left, bottom, right) would control where the lines would go.
Inspiration here: https://github.com/wilkelab/ggtext/blob/master/R/element-textbox.R
Notes:
c("element_part_rect", "element_rect", "element")element_grob.element_part_rect() S3 method.I am using the package for stat_theodensity but I would like to suppress the results of the different computations (e.g., sd). Is this possible? Thanks.
Hi, THANK YOU for this great package, I came across it and it has helped me a lot. I am using facet_nested in a series of graphs with up to 5 nestings in the horizontal facets. I would like the child layers to not be "bled" together. It looks like the bottom-most layer is correctly not bleeding, as it should with the argument bleed=FALSE. But everything above that is still bleeding. It's probably something simple but I can't figure out how to change it. Not sure if this is the correct platform to post this question, but giving it a shot. I'm including an image, if you need more info I can try to come up with a reproducible example.
Thanks, ADK

Sometimes they are coloured incorrectly:
library(ggplot2)
library(ggh4x)

df <- data.frame(
    x = rep(1:5, 2),
    y = c(1:5, (1:5)^2),
    z = rep(LETTERS[1:2], each = 5)
)

ggplot(df, aes(x, y, colour = z)) +
geom_pointpath()Hi there, thanks for coding this very useful extension to ggplot!
I think I found a bug that occurs when panel text is set to element_blank(). Context: I'm trying to apply the ggh4x package to have nested facets for a multi-outcome figure, which I'm arranging using the gridExtra package, trying to only keep facet labels on the leftmost layer but using facet_nested() in each strip to maintain formatting. The error can be reproduced with the following code:
`df = data.frame(x = rnorm(100), y = rnorm(100),
fac1 = factor(sample(4,100, replace = T)),
fac2 = factor(sample(4,100,replace = T)))
#this works
ggplot(df, aes(x=x,y=y)) + geom_point() +
facet_nested(.~fac1) +
theme(strip.text = element_blank())
#this works
ggplot(df, aes(x=x,y=y)) + geom_point() +
facet_nested(.~fac1+fac2)
#this doesn't work
ggplot(df, aes(x=x,y=y)) + geom_point() +
facet_nested(.~fac1+fac2) +
theme(strip.text = element_blank())
`
The current method for using different color scales (as you show in your scale_colour_multi example) is a good way of manually controlling gradients or such on different levels of a variable. As an alternative, what about adding an aesthetic for "lightness" and/or "saturation"? (This is not equivalent to your example, moreso a generalization to vary lightness/saturation dynamically while allowing ggplot2 to handle the base color itself.)
I'm not a color guru, I use those terms from HSL or HSV, not certain which is more prevalent or easy in R. From https://en.wikipedia.org/wiki/HSL_and_HSV, two helpful images are:
HSL: 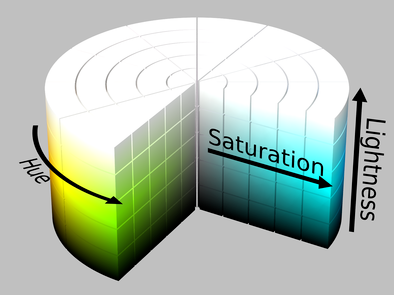
HSV: 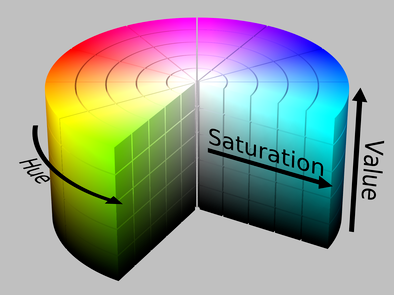
Between the two, I think I prefer HSL since we might introduce aesthetics lightness= and saturation= without likelihood of name-collision. (HSV's use of value= is a bit vague in that regard.) The colorspace package provides HLS (not sure why it's not HSL, but hey) and HSV, so those might be used as imported or their logic references/duplicated here.
Modifying your readme example a little, notably to use only Petal.Length,
# using up through:
# g <- g + force_panelsizes(rows = 1, cols = c(1, phi, phi^2), respect = TRUE)
g +
  geom_point(aes(seto = Petal.Length),
             ggsubset(Species == "setosa")) +
  geom_point(aes(vers  = Petal.Length),
             ggsubset(Species == "versicolor")) +
  geom_point(aes(virg = Petal.Length),
             ggsubset(Species == "virginica")) +
  scale_colour_multi(
    aesthetics = c("seto", "vers", "virg"),
    colours = list(c("white", "green"),
                   c("white", "red"),
                   c("white", "blue")),
    guide = guide_colourbar(barheight = unit(50, "pt"))
  )
(Legend names need to be updated.) This might be reduced to something like
g +
  geom_point(aes(color = Species, lightness = Petal.Length)) +
  scale_colour_hsl()
This is different than ggplot2::scale_colour_hue, which does not allow separate (or even dynamic) lightness/saturation levels. If I am missing that this is already directly supported somewhere, please forgive me :-)
For generality, there is no reason to not support an aesthetic of hue= as well, not sure if that's just "completeness" or actually different-enough-from and as-useful-as colour=.
Cool package, love it!
I found that scale_x_log10 does not work together with stat_theodensity, but this would be a nice feature for log-normal data.
Here's a minimal example:
library(tidyverse)
library(ggh4x)

x <- data.frame(x=rlnorm(1000, 1,1))
p<- x %>% ggplot(aes(x))+geom_histogram(bins=100)+
  stat_theodensity(aes(y = stat(count)),
                   distri = "lnorm")
p  # works
p + scale_x_log10() # error
p + coord_trans(x="log10") # error
The error produced is:
Error in computing default starting values.
Warning message:
Computation failed instat_theo_density():
Error in start.arg.default(obs, distname) :
values must be positive to fit a lognormal distribution
This is with R version 3.6.3.
Not sure if this is a bug or if what I'm asking is unreasonable (scales and coords are a tricky concept).
Cheers,
Felix
To do basically this, but then in a stat function:
library(ggplot2)

df <- data.frame(
  x = seq(0, 10, length.out = 100),
  y = sin(seq(0, 10, length.out = 100))
)

rle <- rle(df$y > 0.5)
start <- {end <- cumsum(rle$lengths)} - rle$lengths + 1

df2 <- data.frame(
  xmin = df$x[start],
  xmax = df$x[end],
  value = rle$values
)

ggplot(df) +
  geom_rect(data = df2, aes(xmin = xmin, xmax = xmax, ymin = -Inf, ymax = Inf, fill = value)) +
  geom_point(aes(x, y))
Created on 2020-05-22 by the reprex package (v0.3.0)
library(ggplot2)
library(ggh4x)

df <- data.frame(outer = c("A","B", "B", "C", "C", "C"),
                 inner = paste("Lorem ipsum dolor sit amet, consectetur adipiscing elit, sed do eiusmod tempor incididunt ut labore et dolore magna aliqua", 1:6),
                 x=1, y =1)

theme_set(theme_gray() + theme(strip.text.y.right =  element_text(angle = 0)))

ggplot(df, aes(x,y)) +
  geom_point() +
  facet_nested(outer + inner ~ .,
               scales = "free_y",
               space = "free_y",
               labeller = label_wrap_gen(40),
               strip = strip_nested(size = "variable")
  ) +
  scale_y_discrete(label = NULL)
Created on 2021-06-29 by the reprex package (v1.0.0)
library(ggplot2)
library(ggh4x)

df <- data.frame(x = 1, y = 1)

ggplot(df, aes(x, y)) +
  geom_pointpath()
#> Error in unit(data$x, "npc"): 'x' and 'units' must have length > 0
Created on 2021-06-10 by the reprex package (v1.0.0)
A guide that can deconvolute a call to interaction(a,b) and places axis labels hierarchically according to the levels. Similar to what facet_nested() does, but for discrete position scales
I would like to run the Shiny App that I created using, ggh4x, but I get the following error: package ‘ggh4x’ is not available (for R version 4.0.0).
The package suits my needs well, and I'd love to continue using it.
Could you please provide advice for resolving this error?
Thank you!
Instead of taking them verbatim from the hclust object.
Instead of doing the following:
ggplot(...) +
  geom_xyz(...) +
  facet_nested(
    x ~ y, nest_line = TRUE
  )
It would be nice if we can do this:
ggplot(...) +
  geom_xyz(...) +
  facet_nested(
    x ~ y, nest_line = element_line()
  )
Wherein the line element inherits from theme(ggh4x.facet.nestline).
A checklist of what probably needs to happen when ggplot release their current release candidate (v3.3.0-rc branch).
There should probably be a stat_roll() that can calculate rolling statistics given some kernel function.
The kernel function should then accept a measure of centrality and a measure of spread. A simple moving average would then be a uniform kernel like dunif() but parameterised slightly the mean and distance to extremes.
Rough sketch for rolling Gaussian kernel here:
https://github.com/teunbrand/tidytuesdayscripts/blob/452451997d819564dc201c7c7f93bbf806a2564c/scripts/2020_04_28_Broadway_Grosses.R#L39-L69
As in title. The correct behaviour should be to place the nest line in between the "A" and "a", "b" labels instead of underneath the "A" strip. Incorrect behaviour example below:
library(ggplot2)
library(ggh4x)

df <- data.frame(
  x = 1,
  outer = c("A", "A", "B"),
  inner = c("a", "b", "c")
)

ggplot(df, aes(x, x)) +
  geom_point() +
  facet_nested(
    outer + inner ~ ., nest_line = element_line(size = 10)
  )
Created on 2021-08-31 by the reprex package (v1.0.0)
Hey,
I've tried using the function facet_nested but I get this error: "Error: widths must be a unit object"
I thought it might be my code, but it also happens with the example code in the README.
Session info:

Thanks
I cant seem to be able to download the package for some reason. I'm not sure how to get past this issue, I have reinstalled backports and I cant find a version 1.1.9
 There is a binary version available but the source version is later:
          binary source needs_compilation
backports  1.1.7  1.1.9              TRUE

  Binaries will be installed
trying URL 'https://cran.rstudio.com/bin/windows/contrib/3.6/backports_1.1.7.zip'
Content type 'application/zip' length 81581 bytes (79 KB)
downloaded 79 KB

package ‘backports’ successfully unpacked and MD5 sums checked
Error: Failed to install 'ggh4x' from GitHub:
  (converted from warning) cannot remove prior installation of package ‘backports’
In addition: Warning messages:
1: In untar2(tarfile, files, list, exdir) :
  skipping pax global extended headers
2: In untar2(tarfile, files, list, exdir) :
  skipping pax global extended headers
>
library(ggplot2)
library(ggh4x)

ggplot(mpg, aes(class, hwy)) +
  geom_boxplot() +
  guides(x = guide_axis_truncated(
    trunc_lower = "compact",
    trunc_upper = "subcompact"
  )) +
  theme(axis.line = element_line(colour = "black"))
#> Error in scale$scale$trans$transform(trunc): attempt to apply non-function
Created on 2021-04-19 by the reprex package (v1.0.0)
facet_nested is really great. I use for having nested "boxes" on my y-axis.
It would be very useful if different theme elements could be used for different levels of the nested facet so that inner facets could have a different background, say. It's not too hard to do this afterward with grid, but it would be much nicer to use theme.
Would something like that be feasible? I am also happy to try to write a patch.
Example:
library(ggplot2)
library(grid)
library(ggh4x)
library(patchwork)

change_inner_fill <- function(ggobj,
                               inner_re = "strip.[0-9]+-[0-9]+-[0-9]+-2",
                               fill = "green") {
    ## https://stackoverflow.com/a/53457599
    gg <- grid.force(ggplotGrob(ggobj))
    grobs_df <- do.call(cbind.data.frame, grid.ls(gg, print = FALSE))
    grobs_df <- within(grobs_df, {
        gPath_full <- paste(gPath, name, sep = "::")
        gPath_full <- gsub(pattern = "layout::",
                           replacement = "",
                           x = gPath_full,
                           fixed = TRUE)})
    strips <- grep(paste0(inner_re, ".*rect.*"),
                   grobs_df$gPath_full, value = TRUE)
    for (i in seq_along(strips)){
        gg <- editGrob(gg, strips[i], gp = gpar(fill = fill))
    }
invisible(gg)
}


df <- data.frame(outer = c("A","B", "B", "C", "C", "C"),
                   inner = paste("Lorem ipsum dolor sit amet", 1:6),
                   x=1, y =1)

theme_set(theme_get() + theme(strip.text.y.left =  element_text(angle = 0),))

g1 <- ggplot(df, aes(x,y)) +
    geom_point() +
    facet_nested(outer + inner ~ .,
                 scales = "free_y",
                 switch = "y",
                 space = "free_y") +
    scale_y_discrete(label = NULL)
grid.draw(change_inner_fill(g1))
## It would be nice to instead write g1 + them(strip.background.y.level-2 = element_rect(fill = "green"))
Currently, nested facets seem to get exactly the same width (for the y-axis) for the outer and the inner facet. But either the inner or the outer facet might have more text.
It would be useful to be able to specify the relative width that the inner and outer facet label each get. For instance in the example below, it would have maybe been nice to specify that the outer facet takes 1/3 of the horizontal space and the inner takes 2/3 of the horizontal space.
I have not been able to figure out how to do this with grid (but I am also not proficient with it).
It seems both facets are in the same grid column, but I can't figure out how to set relative levels.
In any case, it would be nicer to be able to specify this at the ggplot2-level
Many thanks,
Example:
library(ggplot2)
library(grid)
library(ggh4x)
library(patchwork)

df <- data.frame(outer = c("A","B", "B", "C", "C", "C"),
                   inner = paste("Lorem ipsum dolor sit amet, consectetur adipiscing elit, sed do eiusmod tempor incididunt ut labore et dolore magna aliqua", 1:6),
                   x=1, y =1)

theme_set(theme_gray() + theme(strip.text.y.left  =  element_text(angle = 0),
                              strip.background.y = element_rect(color = "white", size = 4)
                              ))

g1 <- ggplot(df, aes(x,y)) +
    geom_point() +
    facet_nested(outer + inner ~ .,
                 scales = "free_y",
                 switch = "y",
                 space = "free_y",
                 labeller = label_wrap_gen(40)
                 ) +
    scale_y_discrete(label = NULL)
g1
## It would be nice to somehow tell ggplot2 to give most of the space to the inner facet,
## rather than making each facet level the same width.
Hi Teunbrand,
{ggh4x} is great, thank you for developing it.
I found what looks like a bug in guide_axis_minor. When I tried to create a plot with minor tick marks on each side of the plot using sec.axis = dup_axis() in the scale_(x|y)_continuous functions I found that setting custom minor tick marks did not work for the duplicate axes. The code below should demonstrate the issue.
ggplot(mtcars, aes(wt, mpg)) + geom_point() + scale_x_continuous( minor_breaks = seq(2, 4, by = 0.2), guide = "axis_minor", sec.axis = dup_axis() )
I have been trying to track down the reason for this behavior but have yet to find it (I am not the ggproto/guide system ninja that you are. Do you have any idea how to fix this problem, or point me in the direction of a solution?
Thanks again for making this package, it is both useful and instructive.
Best,
Niko
I'm trying to combine two plots which use facet_nested() and it's not working. I don't know if is an issue in ggh4x or patchwork but there's at least another package using facets that is having problems. I reported the issue in this comment: thomasp85/patchwork#151 (comment)
Basically the strip merging of facet_nested() but then in a facet wrap layout.
Should be doable to adapt/clone + adapt the strip merging logic from facet_nested() to do the same to wrapped facets.
Probably have to constrain the merging to panel rows/columns somehow.
A limitation would be that when grouped panels are placed in seperate rows/column, there is no elegant merging of strips to be done.
There seems to be some demand for it:
Once ggplot2 v3.30 comes out, guides become extendable.
This can be used to make an axis display logarithmic ticks, as annotation_logticks does, but inherent to the guide.
Dear reader,
It seems you have stumbled across this issue, wherein I ask for your help.
I find myself in the position that I want to submit the latest version of ggh4x to CRAN and have tried to do so.
If you are familiar with the warning issued by CRAN shown below and have (seen) a strategy that resolves this warning, do you mind pointing me in the right direction towards resolving this warning?
Thanks for any advice you can give!
Check: re-building of vignette outputs, Result: WARNING
  Error(s) in re-building vignettes:
  --- re-building ‘Facets.Rmd’ using rmarkdown
  Warning in engine$weave(file, quiet = quiet, encoding = enc) :
    Pandoc (>= 1.12.3) not available. Falling back to R Markdown v1.
  Quitting from lines 31-39 (Facets.Rmd)
  Error: processing vignette 'Facets.Rmd' failed with diagnostics:
  polygon edge not found
  --- failed re-building ‘Facets.Rmd’
How is this not a thing that already exists?
fun.x and fun.y argument,fun.x to the x-positions, apply fun.y to the y-positions.fun.x = mean and fun.y = mean.The following works fine:
library(ggh4x)
#> Loading required package: ggplot2

df <- data.frame(
  x = c("A","B"),
  min = 1:2,
  max = 2:1
)

ggplot(df, aes(seq_along(x))) +
  stat_difference(aes(ymin = min, ymax = max))
This doesn't.
ggplot(df, aes(x)) +
  stat_difference(aes(ymin = min, ymax = max))
Created on 2021-03-26 by the reprex package (v1.0.0)
Implement new legend guide that describes colour or fill with coloured text.
Should take the scale's labels and apply the mapped colour to the labels.
Goal is to have it look like the following, but easier to specify and strings left-aligned by default.
library(ggplot2)

ggplot(iris, aes(Sepal.Width, Sepal.Length)) +
  geom_point(aes(colour = Species),
             key_glyph = draw_key_text) +
  scale_colour_discrete(
    labels = NULL,
    guide = guide_legend(
      override.aes = list(label = levels(iris$Species),
                          size = 4, vjust = 0)
    )
  ) +
  theme(legend.key.width = unit(3, "cm"),
        legend.key = element_blank())
Created on 2021-01-06 by the reprex package (v0.3.0)
sorry to leave this as an issue, but it seems the only way to reasonably contact you :)
I thought you'd like this feature I have added to "my" (yours, really) geom_trail
Can do text now as well :)
Currently the size is a bit a pain, because I don't know (yet) how to conditionally change the default for size param depending
on the "type" argument.
Thanks for this amazing package!
My plot involves creating many facets and I'm trying to pass in a different scale for each facet using facetted_pos_scales. I'd like the scales to vary programmatically between facets, so I tried constructing a list of formulas using purrr::map and then passing it to facetted_pos_scales. Surprisingly this failed the check in ggh4x:::check_facetted_scale, even though other ways of indirectly providing the list of formulas work (so it doesn't seem like an issue with facetted_pos_scales quoting arguments?).
Perhaps this is just my lack of knowledge in metaprogramming but thanks in advance!
library(ggh4x)

# Adapted from https://teunbrand.github.io/ggh4x/reference/facetted_pos_scales.html

plot <- ggplot(iris, aes(Sepal.Width, Sepal.Length)) +
  geom_point(aes(colour = Species)) +
  facet_wrap(Species ~ ., scales = "free_y")

# the typed-out way demoed in the docs
plot +
  facetted_pos_scales(
    y = list(
      Species == "virginica" ~ scale_y_continuous(
        guide = guide_axis_manual(labels = "virginica")
      ),
      Species == "versicolor" ~ scale_y_continuous(
        guide = guide_axis_manual(labels = "versicolor")
      )
    )
  )
# saving list of formula to a variable first and then passing that variable works
scale_specs <- list(
Species == "virginica" ~ scale_y_continuous(
guide = guide_axis_manual(labels = "virginica")
),
Species == "versicolor" ~ scale_y_continuous(
guide = guide_axis_manual(labels = "versicolor")
)
)
plot +
facetted_pos_scales(
y = scale_specs
)library(rlang)
# programmatically constructed list of formulas does not work
scale_specs_programmatic <- purrr::map(c("virginica", "versicolor"), ~ {
expr(Species == !!.x ~ scale_y_continuous(
guide = guide_axis_manual(labels = !!.x)
))
})
plot +
facetted_pos_scales(
y = scale_specs_programmatic
)
#> Error in facetted_pos_scales(y = scale_specs_programmatic): Invalid facetted scale specifications.
# test for equality all return true
scale_specs
#> [[1]]
#> Species == "virginica" ~ scale_y_continuous(guide = guide_axis_manual(labels = "virginica"))
#>
#> [[2]]
#> Species == "versicolor" ~ scale_y_continuous(guide = guide_axis_manual(labels = "versicolor"))
scale_specs_programmatic
#> [[1]]
#> Species == "virginica" ~ scale_y_continuous(guide = guide_axis_manual(labels = "virginica"))
#>
#> [[2]]
#> Species == "versicolor" ~ scale_y_continuous(guide = guide_axis_manual(labels = "versicolor"))
scale_specs[[1]] == scale_specs_programmatic[[1]]
#> [1] TRUE
all.equal(scale_specs, scale_specs_programmatic)
#> [1] TRUECreated on 2021-09-26 by the reprex package (v2.0.1)
In the plot below, the second row of panels should have limits c(1, 2) but shows limits 1-10.
library(ggplot2)
library(ggh4x)

df <- data.frame(
  x = 1,
  y = c(1,10,1,2,1,10),
  grp = c("A", "A", "B", "B", "C", "C"),
  var = rep(c("a", "b"), 3)
)

ggplot(df, aes(x, y)) +
  geom_point() +
  facet_grid2(grp ~ var, scales = "free_y")
Created on 2021-04-16 by the reprex package (v1.0.0)
The axis is correct when there is just a single column.
ggplot(df, aes(x, y)) +
  geom_point() +
  facet_grid2(grp ~ "a", scales = "free_y")
Created on 2021-04-16 by the reprex package (v1.0.0)
Hi Teunbrand,
I've downloaded the latest package of ggh4x (remotes::install_github("teunbrand/ggh4x"))
library(ggh4x)
And I'm trying to use facet_nested_wrap, but I keep getting the following error
Error: 'facet_nested_wrap' is not an exported object from 'namespace:ggh4x'
A declarative, efficient, and flexible JavaScript library for building user interfaces.
🖖 Vue.js is a progressive, incrementally-adoptable JavaScript framework for building UI on the web.
TypeScript is a superset of JavaScript that compiles to clean JavaScript output.
An Open Source Machine Learning Framework for Everyone
The Web framework for perfectionists with deadlines.
A PHP framework for web artisans
Bring data to life with SVG, Canvas and HTML. 📊📈🎉
JavaScript (JS) is a lightweight interpreted programming language with first-class functions.
Some thing interesting about web. New door for the world.
A server is a program made to process requests and deliver data to clients.
Machine learning is a way of modeling and interpreting data that allows a piece of software to respond intelligently.
Some thing interesting about visualization, use data art
Some thing interesting about game, make everyone happy.
We are working to build community through open source technology. NB: members must have two-factor auth.
Open source projects and samples from Microsoft.
Google ❤️ Open Source for everyone.
Alibaba Open Source for everyone
Data-Driven Documents codes.
China tencent open source team.


