Git Product home page Git Product logo

spatialdata-plot's Introduction

SpatialData banner

spatialdata-plot: rich static plotting from SpatialData objects

Tests Documentation Codecov Documentation DOI

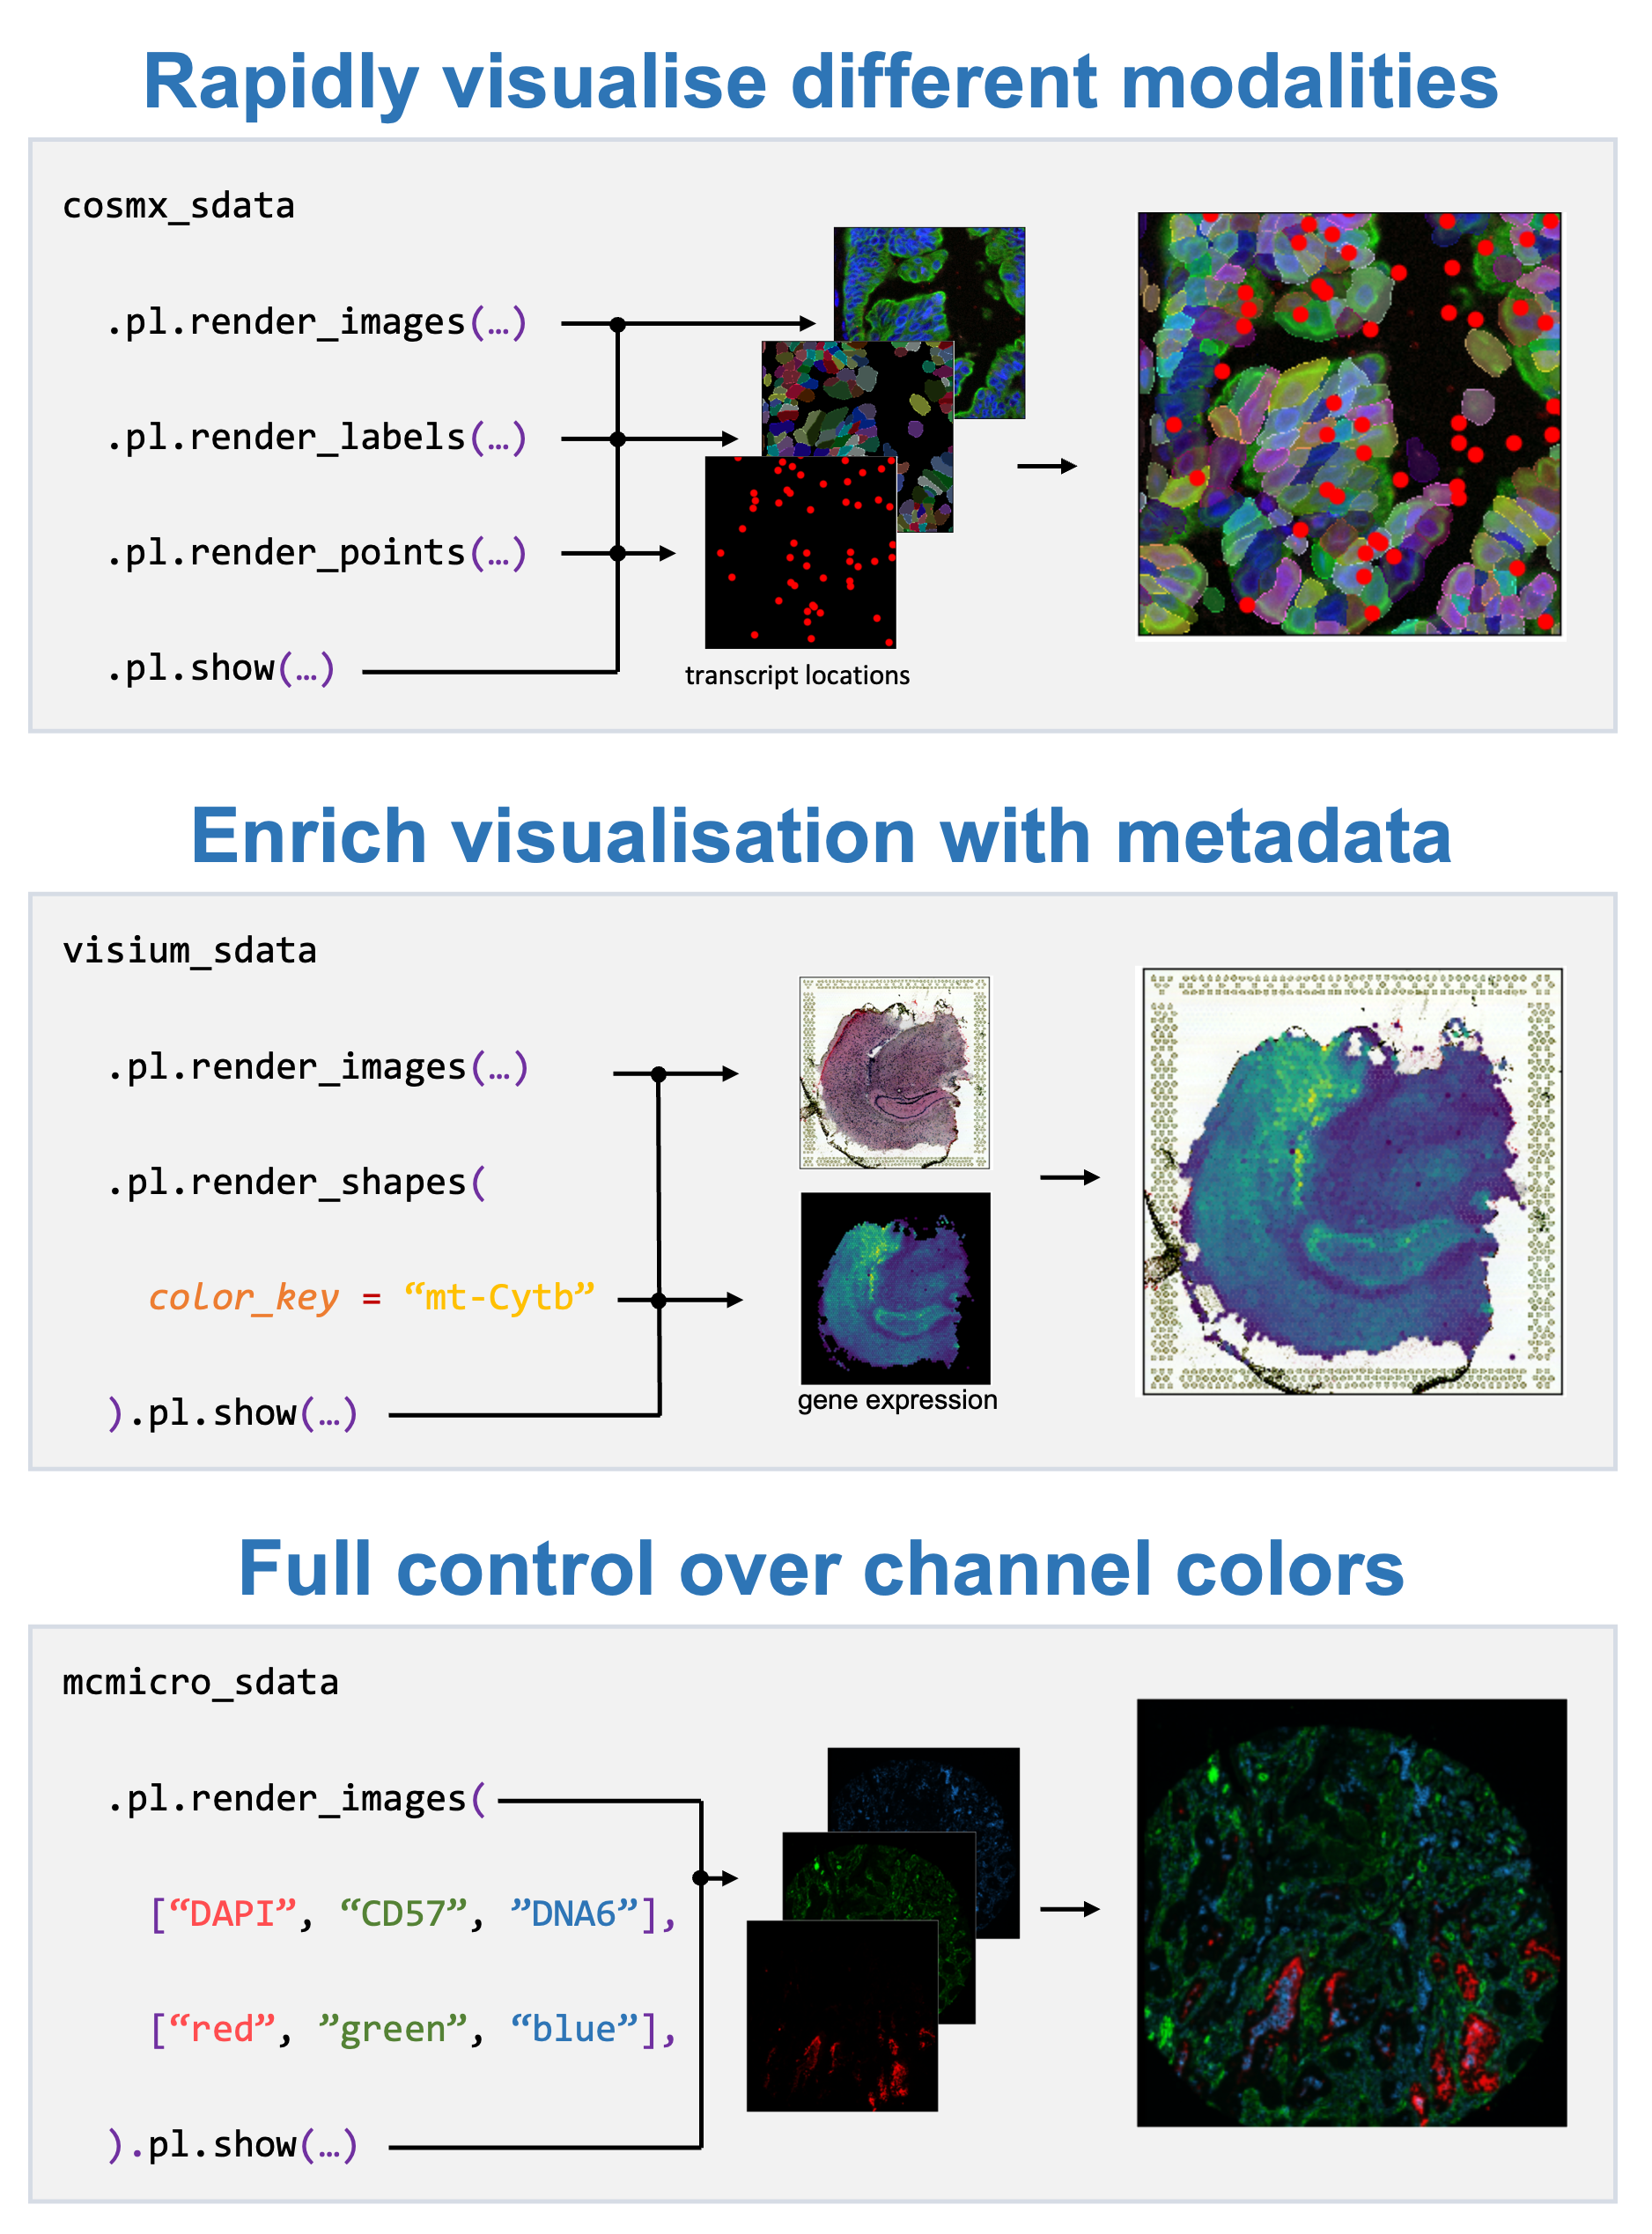
The spatialdata-plot package extends spatialdata with a declarative plotting API that enables to quickly visualize spatialdata objects and their respective elements (i.e. images, labels, points and shapes).

SpatialData’s plotting capabilities allow to quickly visualise all contained modalities. The user can specify which elements should be rendered (images, labels, points, shapes) and specify certain parameters for each layer, such as for example the intent to color shapes by a gene’s expression profile or which color to use for which image channel. When the plot is then eventually displayed, all transformations, alignments and coordinate systems are internally processed to form the final visualisation. In concordance with the general SpatialData philosophy, all modalities of the major spatial technologies are supported out of the box.

Getting started

For more information on the spatialdata-plot library, please refer to the documentation. In particular, the

Installation

You need to have Python 3.9 or newer installed on your system. If you don't have Python installed, we recommend installing Mambaforge.

There are several alternative options to install spatialdata-plot:

  1. Install the latest development version:
pip install git+https://github.com/scverse/spatialdata-plot.git@main

Contact

For questions and help requests, you can reach out in the scverse discourse. If you found a bug, please use the issue tracker.

Citation

Marconato, L., Palla, G., Yamauchi, K.A. et al. SpatialData: an open and universal data framework for spatial omics. Nat Methods (2024). https://doi.org/10.1038/s41592-024-02212-x

spatialdata-plot's People

Contributors

aeisenbarth avatar giovp avatar github-actions[bot] avatar grst avatar kevinyamauchi avatar lucamarconato avatar melonora avatar pre-commit-ci[bot] avatar sagar87 avatar scverse-bot avatar sonja-stockhaus avatar timtreis avatar

Stargazers

 avatar  avatar  avatar  avatar  avatar  avatar  avatar  avatar  avatar  avatar  avatar  avatar  avatar  avatar  avatar  avatar  avatar  avatar  avatar  avatar  avatar  avatar

Watchers

 avatar  avatar  avatar  avatar  avatar  avatar  avatar

spatialdata-plot's Issues

Legend coloring doesn't match with plot in `render_shapes`

MRE

f, ax = plt.subplots(figsize=(7, 7))
sdata_ST8059048.pl.render_shapes(color="library", palette="Pastel1").pl.show(ax=ax)
cropped_sdata.pl.render_shapes(color="Sox2").pl.show(ax=ax, colorbar=False)

# show the spatial query bounding box
rect = patches.Rectangle((8000, 12000), 4000, 4000, linewidth=5, edgecolor="k", facecolor="none")
ax.add_patch(rect)

image

Feature request: remove need for intermediate pl calls when chaining renderers

Description of feature

Thanks for the super nice work, @timtreis and @sagar87 ! I think it would be nice if we didn't have to add intermediate calls to pl when chaining renderers. That is, I think it would be nice if instead of this:

sdata.pl.render_images().pl.render_shapes().pl.show()

We could do this:

sdata.pl.render_images().render_shapes().show()

This perhaps could be possible if the render_*() methods returned the plot accessor instead of the SpatialData object. I suppose this means that one couldn't do a pp operation after a pl operation, but maybe that suggests the pl and pp operations should be on the same level of the hierarchy or one should do their preprocessing first, then their plotting. I'm not sure what's best here, but it might be good to experiment with this once all of the p0 functionality is finished.

Reading highly resolved image

Hello,

Many thanks for this nice tool!

I am wondering if it is possible to work with the full resolution image, for example to use squidpy to extract image features from the full resolution. I tried the the tutorial you provide with the breast cancer data, but when I try to visiualise the 'global' image (adata.pl.render_images().pl.render_shapes().pl.show("global") I get an index error.

spatialdata.md

Thanks,

Sokratia

`get_extent` is inaccurate

get_extent() apparently doesn't properly capture the extent, cutting off the lower triangle

MRE

import matplotlib.pyplot as plt
import spatialdata as sd
import spatialdata_plot

blob = sd.datasets.blobs()

# otherwise pre-commits will remove the "unused" import
_ = spatialdata_plot

ax = plt.gca()
blob.pl.render_shapes(element="blobs_shapes", na_color=(1.0, 0.7, 0.7, 0.5)).pl.show(ax=ax)
plt.show()
image

cmap argument without effect

When plotting array data the cmap argument has no effect.
Expected behavriour would be application of the viridis or Reds colormap instead of default Blues.

import spatialdata_plot
from spatialdata.datasets import blobs
import matplotlib.pyplot as plt

sdata = blobs()

fig, axs = plt.subplots(ncols=3, figsize=(12, 3))
sdata.pl.render_images("blobs_image", channel=0).pl.show(ax=axs[0])
sdata.pl.render_images("blobs_image", channel=0, cmap='viridis').pl.show(ax=axs[1])
sdata.pl.render_images("blobs_image", channel=0, cmap='Reds').pl.show(ax=axs[2])
Screenshot 2023-06-29 at 13 01 37

Priorities 21-03

Description of feature

  • P0 dealing with transformations (racoon example) @timtreis
  • P0 dealing with coordinate systems (xenium and visium) @timtreis
  • P0 API docs tbd
  • P0 Xenium (plotting transcripts) @timtreis
  • P0 Color shapes/labels by a column in the table, exp gene expression @timtreis
  • P0 Codex (mcmicro) @sagar87
  • P0 Visium @sagar87
  • P1 examples running in CI and being rendered and link in sphinx
  • P1 neighbourhood graph plotting

feedback from meeting 07-03

Description of feature

  • replace get_images with get or get_elems or get_elements and additional argument that can filter by coordinate_systems

Plotting multiple elements in the same `ax` seems to work only when `show()` is not called.

I refer to the code mentioned in this other issue: #68

This code here:

    ax = plt.gca()
    sdata.pl.render_shapes(element='s', na_color=(0.5, 0.5, 0.5, 0.5)).pl.render_points().pl.show(ax=ax)
    sdata.pl.render_shapes(element='c', na_color=(0.7, 0.7, 0.7, 0.5)).pl.show(ax=ax)
    plt.show()

doesn't work if I run the code as a script, but it works in interactive mode (where because of a bug the plots are not shown until I call plt.show()). I suggest to do like scanpy and having a parameter show: bool. I suggest also that if the parameter ax is not None, then show is set to False. I don't remember if this one is also a behavior of scanpy, but I think it's reasonable.

Points size not working in `render_points()`

I am trying to plot points of different sizes, but it seems that the parameter size is not working in render_points().


edit by ttreis:

MRE

import matplotlib.pyplot as plt
import spatialdata as sd

blob = sd.datasets.blobs()

fig, axs = plt.subplots(nrows = 1, ncols = 2, figsize = (3,6))

blob.pl.render_points(size=1).pl.show(ax=axs[0])
blob.pl.render_points(size=10).pl.show(ax=axs[1])
image

`na_color` stopped working in `render_shapes()`

Sorry not making a MWE because I don't want to break the flow in fixing another bug.

In this example: #82 the gray squares and gray circles should have actually color na_color=(1.0, 0.7, 0.7, 0.5) which should be a semi-transparent reddish color:

image

edit by ttreis:

MRE

import matplotlib.pyplot as plt
import spatialdata as sd
import spatialdata_plot

blob = sd.datasets.blobs()

# otherwise pre-commits will remove the "unused" import
_ = spatialdata_plot

ax = plt.gca()
blob.pl.render_shapes(element="blobs_shapes", na_color=(1.0, 0.7, 0.7, 0.5)).pl.show(ax=ax)
plt.show()
image

`groups` still available for `render_points()`?

In the new aggregation notebook, this block of code:

ax = plt.gca()
sdata.pl.render_points(color="genes").pl.show(ax=ax)
sdata_shapes.pl.render_shapes(color="b", alpha=0.7).pl.show(ax=ax)

shows this
image

IIRC @timtreis you told me that groups is it part of the code from squidpy that needs to be refactored and currently doesn't work (it would be cool to use it to plot just the points of type b). Opening this issue to keep track of this.

RGB bug with data range (raccoon changed color)

The raccoon in the transformation notebook changed colors:
image
showing this warning:

Clipping input data to the valid range for imshow with RGB data ([0..1] for floats or [0..255] for integers).

Alpha is ignored for shapes

In the new aggregation notebook, this block of code:

ax = plt.gca()

sdata_squares.pl.render_shapes("squares", na_color="red", alpha=0.5).pl.show(ax=ax)
sdata_circles.pl.render_shapes("blobs_circles", alpha=0.5).pl.show(ax=ax)

gives this
image

As it can be seen the alpha is not correctly displayed. I think it was fixed at some point, maybe the bug fell through again.

Named channel rendering not working

@timtreis

import spatialdata as sd
import spatialdata_plot
import numpy as np

sdata = sd.read_zarr('mibitof/data.zarr')
sdata

# hack to create named channels
sdata['point8_image_str'] = sdata['point8_image'].assign_coords(
    c=np.array(['Prot 1', 'Prot 2', 'Prot 3'])
)

# works as expected, also for point8_image_str
(
    sdata
    .pl.render_images('point8_image', channel=[0, 1], palette=['red', 'green'])
    .pl.show(coordinate_systems=['point8'])
)

# does not work as expected, error
(
    sdata
    .pl.render_images('point8_image_str', channel=['Prot 1', 'Prot 2'], palette=['red', 'green'])
    .pl.show(coordinate_systems='point8')
)
---------------------------------------------------------------------------
KeyError                                  Traceback (most recent call last)
Cell In[15], line 4
      1 (
      2     sdata
      3     .pl.render_images(channel=['RNA1 DAPI', 'RNA MITF'], palette=['blue', 'green'])
----> 4     .pl.show()
      5 )

File /opt/homebrew/Caskroom/mambaforge/base/envs/harpy/lib/python3.10/site-packages/spatialdata_plot/pl/basic.py:601, in PlotAccessor.show(self, coordinate_systems, legend_fontsize, legend_fontweight, legend_loc, legend_fontoutline, na_in_legend, colorbar, wspace, hspace, ncols, frameon, figsize, dpi, fig, title, share_extent, ax, return_ax, save)
    599 for cmd, params in render_cmds.items():
    600     if cmd == "render_images" and cs_contents.query(f"cs == '{cs}'")["has_images"][0]:
--> 601         _render_images(
    602             sdata=sdata,
    603             render_params=params,
    604             coordinate_system=cs,
    605             ax=ax,
    606             fig_params=fig_params,
    607             scalebar_params=scalebar_params,
    608             legend_params=legend_params,
    609             # extent=extent[cs],
    610         )
    611     elif cmd == "render_shapes" and cs_contents.query(f"cs == '{cs}'")["has_shapes"][0]:
    612         if sdata.table is not None and isinstance(params.color, str):

File /opt/homebrew/Caskroom/mambaforge/base/envs/harpy/lib/python3.10/site-packages/spatialdata_plot/pl/render.py:330, in _render_images(sdata, render_params, coordinate_system, ax, fig_params, scalebar_params, legend_params)
    328 if render_params.channel is not None:
    329     channels = [render_params.channel] if isinstance(render_params.channel, (str, int)) else render_params.channel
--> 330     img = img.sel(c=channels)
    331     num_channels = img.sizes["c"]
    333     if render_params.palette is not None:

File /opt/homebrew/Caskroom/mambaforge/base/envs/harpy/lib/python3.10/site-packages/xarray/core/dataarray.py:1527, in DataArray.sel(self, indexers, method, tolerance, drop, **indexers_kwargs)
   1417 def sel(
   1418     self: T_DataArray,
   1419     indexers: Mapping[Any, Any] | None = None,
   (...)
   1423     **indexers_kwargs: Any,
   1424 ) -> T_DataArray:
   1425     """Return a new DataArray whose data is given by selecting index
   1426     labels along the specified dimension(s).
   1427
   (...)
   1525     Dimensions without coordinates: points
   1526     """
-> 1527     ds = self._to_temp_dataset().sel(
   1528         indexers=indexers,
   1529         drop=drop,
   1530         method=method,
   1531         tolerance=tolerance,
   1532         **indexers_kwargs,
   1533     )
   1534     return self._from_temp_dataset(ds)

File /opt/homebrew/Caskroom/mambaforge/base/envs/harpy/lib/python3.10/site-packages/xarray/core/dataset.py:2565, in Dataset.sel(self, indexers, method, tolerance, drop, **indexers_kwargs)
   2504 """Returns a new dataset with each array indexed by tick labels
   2505 along the specified dimension(s).
   2506
   (...)
   2562 DataArray.sel
   2563 """
   2564 indexers = either_dict_or_kwargs(indexers, indexers_kwargs, "sel")
-> 2565 query_results = map_index_queries(
   2566     self, indexers=indexers, method=method, tolerance=tolerance
   2567 )
   2569 if drop:
   2570     no_scalar_variables = {}

File /opt/homebrew/Caskroom/mambaforge/base/envs/harpy/lib/python3.10/site-packages/xarray/core/indexing.py:183, in map_index_queries(obj, indexers, method, tolerance, **indexers_kwargs)
    181         results.append(IndexSelResult(labels))
    182     else:
--> 183         results.append(index.sel(labels, **options))
    185 merged = merge_sel_results(results)
    187 # drop dimension coordinates found in dimension indexers
    188 # (also drop multi-index if any)
    189 # (.sel() already ensures alignment)

File /opt/homebrew/Caskroom/mambaforge/base/envs/harpy/lib/python3.10/site-packages/xarray/core/indexes.py:485, in PandasIndex.sel(self, labels, method, tolerance)
    483     indexer = get_indexer_nd(self.index, label_array, method, tolerance)
    484     if np.any(indexer < 0):
--> 485         raise KeyError(f"not all values found in index {coord_name!r}")
    487 # attach dimension names and/or coordinates to positional indexer
    488 if isinstance(label, Variable):

KeyError: "not all values found in index 'c'"

color argument breaks `pl.render_shapes`

Removing the color argument makes plot work.
This bug is very unfortuante, because it affects the onboarding of new users.
See spatial_query tutorial.

MWE

import spatialdata as sd
import spatialdata_plot
from matplotlib import pyplot as plt
sdata = sd.read_zarr("visium.zarr") # visium.zarr from sdata tutorial
sdata.pl.render_shapes(color="library").pl.show()

Trace

---------------------------------------------------------------------------
TypeError                                 Traceback (most recent call last)
Cell In[5], line 1
----> 1 sdata.pl.render_shapes(color="library").pl.show()

File ~/miniconda3/envs/sd_dev_m1/lib/python3.10/site-packages/spatialdata_plot/pl/basic.py:691, in PlotAccessor.show(self, coordinate_systems, legend_fontsize, legend_fontweight, legend_loc, legend_fontoutline, na_in_legend, colorbar, wspace, hspace, ncols, frameon, figsize, dpi, fig, title, share_extent, pad_extent, ax, return_ax, save)
    684         if is_categorical_dtype(colors):
    685             _maybe_set_colors(
    686                 source=sdata.table,
    687                 target=sdata.table,
    688                 key=params.color,
    689                 palette=params.palette,
    690             )
--> 691     _render_shapes(
    692         sdata=sdata,
    693         render_params=params,
    694         coordinate_system=cs,
    695         ax=ax,
    696         fig_params=fig_params,
    697         scalebar_params=scalebar_params,
    698         legend_params=legend_params,
    699     )
    701 elif cmd == "render_points" and cs_contents.query(f"cs == '{cs}'")["has_points"][0]:
    702     _render_points(
    703         sdata=sdata,
    704         render_params=params,
   (...)
    709         legend_params=legend_params,
    710     )

File ~/miniconda3/envs/sd_dev_m1/lib/python3.10/site-packages/spatialdata_plot/pl/render.py:97, in _render_shapes(sdata, render_params, coordinate_system, ax, fig_params, scalebar_params, legend_params)
     94 render_params.outline_params.bg_color = (0.83, 0.83, 0.83, render_params.fill_alpha)
     96 # get color vector (categorical or continuous)
---> 97 color_source_vector, color_vector, _ = _set_color_source_vec(
     98     adata=table,
     99     value_to_plot=render_params.color,
    100     alt_var=render_params.alt_var,
    101     layer=render_params.layer,
    102     groups=render_params.groups,
    103     palette=render_params.palette,
    104     na_color=render_params.cmap_params.na_color,
    105     alpha=render_params.fill_alpha,
    106 )
    108 # color_source_vector is None when the values aren't categorical
    109 if color_source_vector is None and render_params.transfunc is not None:

File ~/miniconda3/envs/sd_dev_m1/lib/python3.10/site-packages/spatialdata_plot/pl/utils.py:729, in _set_color_source_vec(adata, value_to_plot, use_raw, alt_var, layer, groups, palette, na_color, alpha)
    726 if groups is not None:
    727     color_source_vector = color_source_vector.remove_categories(categories.difference(groups))
--> 729 color_map = dict(zip(categories, _get_colors_for_categorical_obs(categories)))
    730 # color_map = _get_palette(
    731 #     adata=adata, cluster_key=value_to_plot, categories=categories, palette=palette, alpha=alpha
    732 # )
    733 if color_map is None:

File ~/miniconda3/envs/sd_dev_m1/lib/python3.10/site-packages/spatialdata_plot/pl/utils.py:693, in _get_colors_for_categorical_obs(categories, palette, alpha)
    691     palette = [to_hex(palette(x, alpha=alpha)) for x in color_idx]  # type: ignore[attr-defined]
    692 else:
--> 693     raise TypeError(f"Palette is {type(palette)} but should be string or `ListedColormap`.")
    695 return palette[:len_cat]

TypeError: Palette is <class 'list'> but should be string or `ListedColormap`.

Warning from AnnData (`ImplicitModificationWarning`)

On line 85 from render.py the line

table = AnnData(None, obs=pd.DataFrame(index=np.arange(len(shapes))))

leads to the following warning

@_gen_dataframe.register(pd.DataFrame)
def _(anno, length, index_names):
    anno = anno.copy(deep=False)
    if not is_string_dtype(anno.index):
        warnings.warn("Transforming to str index.", ImplicitModificationWarning)
        anno.index = anno.index.astype(str)
    return anno

edit by ttreis:

  • context: render_shapes when sdata.table is None

MRE

blobs = sd.datasets.blobs()
del blobs.table
blobs.pl.render_shapes().pl.show()

dev install has wrong version

I installed from pip and got 0.0.2 and when I install from cloned repo I get

Successfully built spatialdata-plot
Installing collected packages: spatialdata-plot
  Attempting uninstall: spatialdata-plot
    Found existing installation: spatialdata-plot 0.0.2
    Uninstalling spatialdata-plot-0.0.2:
      Successfully uninstalled spatialdata-plot-0.0.2
Successfully installed spatialdata-plot-0.0.0

`channel` argument of `render_images`has side effect on signal normalisation

Plotting a single channel of the blobs dataset instead of all three channels results in a plot with saturated peaks.
This is most likely an artefact from different colormaps and not normalisation itself.

The difference is most visible at the peak around 400, 250.
It is mostly saturated for the single channel plot whereas it exhibits a value gradient when plotting all three channels.

import spatialdata_plot
from spatialdata.datasets import blobs
import matplotlib.pyplot as plt

sdata = blobs()

fig, axs = plt.subplots(1,3, figsize=(12, 3))
sdata.pl.render_images("blobs_image").pl.show(ax=axs[0], title="default all channels")
sdata.pl.render_images("blobs_image", channel=1).pl.show(ax=axs[1], title="default cmap, channel 1")
sdata.pl.render_images("blobs_image", channel=1, cmap='Greens').pl.show(ax=axs[2], title="Greens cmap, channel1")

image
Screenshot 2023-06-29 at 14 23 54
Screenshot 2023-06-29 at 14 23 56

Consider using `NamedTuple` instead of dictionaries

Report

for example, here

"render_points",
"render_channels",
]
if len(plotting_tree.keys()) > 0:
render_cmds = OrderedDict()
for cmd, params in plotting_tree.items():
# strip prefix from cmd and verify it's valid

and here

named tuple are more suitable for this approach.

Version information

No response

Cannot plot values from the columns of a `GeoDataFrame`

If we have a GeoDataFrame with say, one categorical column on it, and we set color='column_name', we get this error KeyError: 'Could not find key type in .var_names or .obs.columns.' because the code only looks in the table.

This can be easily fixed using this function (not in main yet but will be there very soon) https://github.com/scverse/spatialdata/blob/2bd82d73243fc1337dc15d95a110b51be84576eb/src/spatialdata/_core/query/relational_query.py#L207

The function looks for the requested value from any place (dataframe columns, var, obs) and throws exceptions when the column is not found or is found in multiple places. You can request single columns or multiple numerical columns (as a list of column names).

Limtiations:

  • it throws an error if you try to request multiple categorical variables
  • it throws an error if you ask multiple columns that are not from the same location (e.g. one column from obs and one from var_names)

If these limitations are too strict I can relax them.

Minor bugs in `render_shapes`

Report

Currently plotting the visium data. Bugs:

  • When having two coordinate systems, the list of colors passed to the individual axs plots is too long (probably the sum for both axs?)

image

  • When color_key is improperly defined, it throws an instance_key error?

image

Version information

No response

Plotting with random colours is slow

Description of feature

When plotting f.e. labels with a random colours for each label, the code is very slow. That's because for every single label, first the infill and then the border is added to the plot. So that's n_labels * 2 iterations.

image

Instead we could go "pseudo-random" with the colors and just generate 20-30 random ones. That way, we'd go down to n_distinct_colours * 2 iterations.

Extent of axes dependent of order of points being shown

Changing the order of what is being rendered may alter the extent being shown in the plot.

Here below is not a way to reproduce the bug because it would be laborious, but it shows an example of what is going on. This code

        import matplotlib.pyplot as plt
        import spatialdata_plot

        # otherwise pre-commits will remove the "unused" import
        _ = spatialdata_plot

        ax = plt.gca()
        sdata.pl.render_shapes(element="by_polygons", na_color=(1.0, 0.7, 0.7, 0.5)).pl.show(ax=ax)
        sdata.pl.render_shapes(element="by_circles", na_color=(1.0, 0.7, 0.7, 0.5)).pl.show(ax=ax)
        sdata.pl.render_shapes(element="values_polygons", color="categorical_in_obs").pl.show(ax=ax)
        sdata.pl.render_shapes(element="values_circles", color="categorical_in_obs").pl.show(ax=ax)
        sdata.pl.render_points(color="categorical_in_ddf", size=10.0, palette="tab10").pl.show(ax=ax)
        # sdata.pl.render_shapes(element="values_circles", color="categorical_in_obs").pl.show(ax=ax) # <- this line is identical to the one 2 lines above!
        plt.show()

gives this plot:
image

If we uncomment the last line, we get this plot instead:
image

If we plot only the line that is commented in the code above, this is shown:
image

Expected behaviors:

  1. the final extent should not dependent of the order of elements being plot
  2. the expected extent is the screenshots above doesn't fit the actual extent of the data

issues with plotting multipolygons

Although spatialData supports multipolygons, plt.shapes doesn't support it.

When running following code (where sdate.shapes contains multipolygons):

'''
import spatialdata_plot
sdata.pl.render_images('raw_image').pl.render_shapes().pl.show()
'''
Following error is produced:

AttributeError Traceback (most recent call last)
Input In [58], in <cell line: 2>()
1 import spatialdata_plot
----> 2 sdata.pl.render_images('raw_image').pl.render_shapes().pl.show()

File /srv/scratch/lottep/anaconda3/envs/napari-spongepy/lib/python3.10/site-packages/spatialdata_plot/pl/basic.py:625, in PlotAccessor.show(self, coordinate_systems, legend_fontsize, legend_fontweight, legend_loc, legend_fontoutline, na_in_legend, colorbar, wspace, hspace, ncols, frameon, figsize, dpi, fig, ax, return_ax, save)
618 if is_categorical_dtype(colors):
619 _maybe_set_colors(
620 source=sdata.table,
621 target=sdata.table,
622 key=params.color,
623 palette=params.palette,
624 )
--> 625 _render_shapes(
626 sdata=sdata,
627 render_params=params,
628 coordinate_system=cs,
629 ax=ax,
630 fig_params=fig_params,
631 scalebar_params=scalebar_params,
632 legend_params=legend_params,
633 )
635 elif cmd == "render_points" and cs_contents.query(f"cs == '{cs}'")["has_points"][0]:
636 _render_points(
637 sdata=sdata,
638 render_params=params,
(...)
643 legend_params=legend_params,
644 )

File /srv/scratch/lottep/anaconda3/envs/napari-spongepy/lib/python3.10/site-packages/spatialdata_plot/pl/render.py:154, in _render_shapes(sdata, render_params, coordinate_system, ax, fig_params, scalebar_params, legend_params)
151 if len(color_vector) == 0:
152 color_vector = [(0.83, 0.83, 0.83, 1.0)]
--> 154 _cax = _get_collection_shape(
155 shapes=shapes,
156 s=render_params.size,
157 c=color_vector,
158 rasterized=sc_settings._vector_friendly,
159 cmap=render_params.cmap_params.cmap,
160 norm=norm,
161 alpha=render_params.alpha,
162 # **kwargs,
163 )
164 cax = ax.add_collection(_cax)
166 _ = _decorate_axs(
167 ax=ax,
168 cax=cax,
(...)
184 # scalebar_kwargs=scalebar_params.scalebar_kwargs,
185 )

File /srv/scratch/lottep/anaconda3/envs/napari-spongepy/lib/python3.10/site-packages/spatialdata_plot/pl/render.py:109, in _render_shapes.._get_collection_shape(shapes, c, s, norm, **kwargs)
107 """Get collection of shapes."""
108 if shapes["geometry"].iloc[0].geom_type == "Polygon":
--> 109 patches = [Polygon(p.exterior.coords, closed=False) for p in shapes["geometry"]]
110 elif shapes["geometry"].iloc[0].geom_type == "Point":
111 patches = [Circle((circ.x, circ.y), radius=r * s) for circ, r in zip(shapes["geometry"], shapes["radius"])]

File /srv/scratch/lottep/anaconda3/envs/napari-spongepy/lib/python3.10/site-packages/spatialdata_plot/pl/render.py:109, in (.0)
107 """Get collection of shapes."""
108 if shapes["geometry"].iloc[0].geom_type == "Polygon":
--> 109 patches = [Polygon(p.exterior.coords, closed=False) for p in shapes["geometry"]]
110 elif shapes["geometry"].iloc[0].geom_type == "Point":
111 patches = [Circle((circ.x, circ.y), radius=r * s) for circ, r in zip(shapes["geometry"], shapes["radius"])]

AttributeError: 'MultiPolygon' object has no attribute 'exterior'

Will multipolygons will be supported for plotting in the future or should I try to make them into polygons? (and thus losing information)?

render_images() doesn't account for image translations

Report

When working on scverse/spatialdata-notebooks#13, I noticed that render_images() doesn't seem to account for translations being applied to images.

To reproduce:

# https://s3.embl.de/spatialdata/spatialdata-sandbox/visium.zip
sdata = sd.read_zarr("visium.zarr")
sdata_ST8059048 = sdata.filter_by_coordinate_system("ST8059048")


cropped_sdata = sdata_ST8059048.query.bounding_box(
    axes=["x", "y"], min_coordinate=[8000, 12000], max_coordinate=[12000, 16000], target_coordinate_system="ST8059048"
)

# plot the cropped data
# the image will be at the origin and the shapes will be in the correct location
f, ax = plt.subplots(figsize=(7, 7))
cropped_sdata.pl.render_images().pl.render_shapes(color="Sox2").pl.show(ax=ax, colorbar=False)

Screenshot 2023-04-13 at 23 31 50

Version information

I installed with pip install git+https://github.com/scverse/spatialdata-plot.git

Wrong spatialplot of Affine Transformation

With this issue (#101 ) addressed, I run the tutorial Transformations and coordinate systems, https://spatialdata.scverse.org/en/latest/tutorials/notebooks/notebooks/examples/transformations.html

totally following the tutorial, when it comes to the affine transformation, it got wrong spatialplot.

theta = math.pi / 6
rotation = Affine(
    [
        [math.cos(theta), -math.sin(theta), 0],
        [math.sin(theta), math.cos(theta), 0],
        [0, 0, 1],
    ],
    input_axes=("x", "y"),
    output_axes=("x", "y"),
)

set_transformation(sdata.images["raccoon"], rotation, to_coordinate_system="global")

sdata.pl.render_images().pl.render_labels().pl.render_shapes().pl.show()
image

FYI:

(spatialdata) $ pip list | grep spatialdata

napari-spatialdata            0.2.4
spatialdata                   0.0.10
spatialdata-io                0.0.4
spatialdata-plot              0.0.0  ## pip install the version from spatialdata-plot@bugfix/issue100-get_extent-produces-wrong-output-after-spatial-query

extent fails on shapes circles

on a custom sdata (that however is correctly validated) I can't visualize shapes, by plotting with

sdata.pl.render_shapes(elements="regionA").pl.show()

I get

---------------------------------------------------------------------------
IndexError                                Traceback (most recent call last)
/home/t-gpalla/Projects/cl-spatial-datasets/scripts/dataloader.py in line 2
      [79](file:///home/t-gpalla/Projects/cl-spatial-datasets/scripts/dataloader.py?line=78) # %%
----> [80](file:///home/t-gpalla/Projects/cl-spatial-datasets/scripts/dataloader.py?line=79) sdata.pl.render_shapes(elements = "ht242p1h4", color="total_counts").pl.show()

File [~/Projects/spatialdata-plot/src/spatialdata_plot/pl/basic.py:535](https://vscode-remote+ssh-002dremote-002btunnel.vscode-resource.vscode-cdn.net/home/t-gpalla/Projects/cl-spatial-datasets/~/Projects/spatialdata-plot/src/spatialdata_plot/pl/basic.py:535), in PlotAccessor.show(self, coordinate_systems, legend_fontsize, legend_fontweight, legend_loc, legend_fontoutline, na_in_legend, colorbar, wspace, hspace, ncols, frameon, figsize, dpi, fig, title, share_extent, ax, return_ax, save)
    [532](file:///home/t-gpalla/Projects/spatialdata-plot/src/spatialdata_plot/pl/basic.py?line=531)     if cs not in sdata.coordinate_systems:
    [533](file:///home/t-gpalla/Projects/spatialdata-plot/src/spatialdata_plot/pl/basic.py?line=532)         raise ValueError(f"Unknown coordinate system '{cs}', valid choices are: {sdata.coordinate_systems}")
--> [535](file:///home/t-gpalla/Projects/spatialdata-plot/src/spatialdata_plot/pl/basic.py?line=534) extent = _get_extent(
    [536](file:///home/t-gpalla/Projects/spatialdata-plot/src/spatialdata_plot/pl/basic.py?line=535)     sdata=sdata,
    [537](file:///home/t-gpalla/Projects/spatialdata-plot/src/spatialdata_plot/pl/basic.py?line=536)     has_images="render_images" in render_cmds,
    [538](file:///home/t-gpalla/Projects/spatialdata-plot/src/spatialdata_plot/pl/basic.py?line=537)     has_labels="render_labels" in render_cmds,
    [539](file:///home/t-gpalla/Projects/spatialdata-plot/src/spatialdata_plot/pl/basic.py?line=538)     has_points="render_points" in render_cmds,
    [540](file:///home/t-gpalla/Projects/spatialdata-plot/src/spatialdata_plot/pl/basic.py?line=539)     has_shapes="render_shapes" in render_cmds,
    [541](file:///home/t-gpalla/Projects/spatialdata-plot/src/spatialdata_plot/pl/basic.py?line=540)     coordinate_systems=coordinate_systems,
    [542](file:///home/t-gpalla/Projects/spatialdata-plot/src/spatialdata_plot/pl/basic.py?line=541) )
    [544](file:///home/t-gpalla/Projects/spatialdata-plot/src/spatialdata_plot/pl/basic.py?line=543) # Use extent to filter out coordinate system without the relevant elements
    [545](file:///home/t-gpalla/Projects/spatialdata-plot/src/spatialdata_plot/pl/basic.py?line=544) valid_cs = []

File [~/Projects/spatialdata-plot/src/spatialdata_plot/pl/utils.py:318](https://vscode-remote+ssh-002dremote-002btunnel.vscode-resource.vscode-cdn.net/home/t-gpalla/Projects/cl-spatial-datasets/~/Projects/spatialdata-plot/src/spatialdata_plot/pl/utils.py:318), in _get_extent(sdata, coordinate_systems, has_images, has_labels, has_points, has_shapes, share_extent)
    [311](file:///home/t-gpalla/Projects/spatialdata-plot/src/spatialdata_plot/pl/utils.py?line=310) tmp_polygons = sdata.shapes[e_id][
    [312](file:///home/t-gpalla/Projects/spatialdata-plot/src/spatialdata_plot/pl/utils.py?line=311)     sdata.shapes[e_id]["geometry"].apply(
    [313](file:///home/t-gpalla/Projects/spatialdata-plot/src/spatialdata_plot/pl/utils.py?line=312)         lambda geom: geom.geom_type in ["Polygon", "MultiPolygon"]
    [314](file:///home/t-gpalla/Projects/spatialdata-plot/src/spatialdata_plot/pl/utils.py?line=313)     )
    [315](file:///home/t-gpalla/Projects/spatialdata-plot/src/spatialdata_plot/pl/utils.py?line=314) ]
    [317](file:///home/t-gpalla/Projects/spatialdata-plot/src/spatialdata_plot/pl/utils.py?line=316) if not tmp_points.empty:
--> [318](file:///home/t-gpalla/Projects/spatialdata-plot/src/spatialdata_plot/pl/utils.py?line=317)     tmp_points["point_topleft"] = tmp_points.apply(
    [319](file:///home/t-gpalla/Projects/spatialdata-plot/src/spatialdata_plot/pl/utils.py?line=318)         lambda row: get_point_bb(row["geometry"], row["radius"], "topleft"),
    [320](file:///home/t-gpalla/Projects/spatialdata-plot/src/spatialdata_plot/pl/utils.py?line=319)         axis=1,
    [321](file:///home/t-gpalla/Projects/spatialdata-plot/src/spatialdata_plot/pl/utils.py?line=320)     )
    [322](file:///home/t-gpalla/Projects/spatialdata-plot/src/spatialdata_plot/pl/utils.py?line=321)     tmp_points["point_bottomright"] = tmp_points.apply(
    [323](file:///home/t-gpalla/Projects/spatialdata-plot/src/spatialdata_plot/pl/utils.py?line=322)         lambda row: get_point_bb(row["geometry"], row["radius"], "bottomright"),
    [324](file:///home/t-gpalla/Projects/spatialdata-plot/src/spatialdata_plot/pl/utils.py?line=323)         axis=1,
    [325](file:///home/t-gpalla/Projects/spatialdata-plot/src/spatialdata_plot/pl/utils.py?line=324)     )
    [326](file:///home/t-gpalla/Projects/spatialdata-plot/src/spatialdata_plot/pl/utils.py?line=325)     xmin_tl, ymin_tl, xmax_tl, ymax_tl = tmp_points["point_topleft"].total_bounds

File /anaconda/envs/cldata310/lib/python3.10/site-packages/geopandas/geodataframe.py:1581, in GeoDataFrame.apply(self, func, axis, raw, result_type, args, **kwargs)
   [1579](file:///anaconda/envs/cldata310/lib/python3.10/site-packages/geopandas/geodataframe.py?line=1578) @doc(pd.DataFrame)
   [1580](file:///anaconda/envs/cldata310/lib/python3.10/site-packages/geopandas/geodataframe.py?line=1579) def apply(self, func, axis=0, raw=False, result_type=None, args=(), **kwargs):
-> [1581](file:///anaconda/envs/cldata310/lib/python3.10/site-packages/geopandas/geodataframe.py?line=1580)     result = super().apply(
   [1582](file:///anaconda/envs/cldata310/lib/python3.10/site-packages/geopandas/geodataframe.py?line=1581)         func, axis=axis, raw=raw, result_type=result_type, args=args, **kwargs
   [1583](file:///anaconda/envs/cldata310/lib/python3.10/site-packages/geopandas/geodataframe.py?line=1582)     )
   [1584](file:///anaconda/envs/cldata310/lib/python3.10/site-packages/geopandas/geodataframe.py?line=1583)     # pandas <1.4 re-attach last geometry col if lost
   [1585](file:///anaconda/envs/cldata310/lib/python3.10/site-packages/geopandas/geodataframe.py?line=1584)     if (

any intuition on what might be going wrong?

`outline_color` doesn't work(?)

In the new aggregation notebook, I tried using the outline_color parameter in this block of code

sdata.pl.render_shapes("blobs_circles").pl.show()

to see some black border
image

But it didn't seem to work. Now that I am writing this it came to my mind that maybe it's because the circle has diameter of 100 and maybe the outline is drawn so small that it can't be seen. In that case maybe the default should be "something" visible for the current circles. Not sure if it makes sense, wdyt?

`pl.show()` still not working (?) in interactive mode

I am using the latest code from main. If I run this code as a script, the plot is shown. If I set a breakpoint (I am using PyCharm) in the line with pl.render_points()..., and then run that line in the Python interactive console, then no plot is shown and I need to call plt.show() explicitly. I think the bug was once fixed, maybe it slipped in again.

from spatialdata import SpatialData
from spatialdata.models import PointsModel, ShapesModel
from shapely import polygons, linearrings
from geopandas import GeoDataFrame
import pandas as pd
import geopandas as gpd
import numpy as np

def _make_points():
    """Helper function to make a Points element."""
    coordinates = np.array([[10, 10], [20, 20], [20, 30]], dtype=float)
    return PointsModel.parse(
        coordinates, annotation=pd.DataFrame({"genes": np.repeat("a", len(coordinates))}), feature_key="genes"
    )


def _make_squares() -> polygons:
    centroid_coordinates = np.array([[10, 10], [10, 80], [80, 20], [70, 60]])
    half_width = 6
    linear_rings = []
    for centroid in centroid_coordinates:
        min_coords = centroid - half_width
        max_coords = centroid + half_width

        linear_rings.append(
            linearrings(
                [
                    [min_coords[0], min_coords[1]],
                    [min_coords[0], max_coords[1]],
                    [max_coords[0], max_coords[1]],
                    [max_coords[0], min_coords[1]],
                ]
            )
        )
    s = polygons(linear_rings)
    polygon_series = gpd.GeoSeries(s)
    cell_polygon_table = gpd.GeoDataFrame(geometry=polygon_series)
    sd_polygons = ShapesModel.parse(cell_polygon_table)
    return sd_polygons


def _make_circles() -> GeoDataFrame:
    centroid_coordinates = np.array([[10, 10], [10, 80], [80, 20], [70, 60]])
    radius = 10
    circles = ShapesModel.parse(centroid_coordinates, geometry=0, radius=radius)
    return circles

points = _make_points()
squares = _make_squares()
circles = _make_circles()
import spatialdata_plot
sdata = SpatialData(points={'p': points}, shapes={'s': squares, 'c': circles})
sdata.pl.render_points().pl.render_shapes().pl.show()
# import matplotlib.pyplot as plt
# plt.show()

Plotting of groups and continuos variables together

Description of feature

It wouldbe cool to filter cells based on groups od the categorical, and still plot continuous on the side:

sq.pl.spatial_segment(
    adata,
    library_id=["point16", "point23", "point8"],
    seg_cell_id="cell_id",
    color=["cell_size", "Cluster"],
    groups=["Epithelial"],
    library_key="library_id",
    na_color="gray",
    # library_first=False,
    # title=["point16", "point23", "point8"],
)

image

reuse colourmap when plotting a single channel

spatialdata-plot creates tasty perceptuelly linear colormaps for plotting raster images.
When a user plots only one channel, the LinearSegmentedColormap-based colormaps are discarderd and the same defautl is used for every channel.
A better default behaviour would be to reuse the same LinearSegmentedColormap for single channels that would be used when plotting all channels together.

I made a quick mockup below (please excuse my oversaturated inkscapery).

# import spatialdata_plot
from spatialdata.datasets import blobs
import matplotlib.pyplot as plt

sdata = blobs()

fig, axs = plt.subplots(ncols=3, figsize=(12, 3))
sdata.pl.render_images("blobs_image").pl.show(ax=axs[0])
sdata.pl.render_images("blobs_image", channel=0).pl.show(ax=axs[1])
sdata.pl.render_images("blobs_image", channel=1).pl.show(ax=axs[2])

Current behaviour:
old_behaviour

New behaviour:

mockup

  • create clear connection between elements in overview plots and plots to highlight certain features
  • consistent spatialdata-plot look and feel in all plots

[bug] plotting using pp.get_elements plots all coordinate systems

I have a spatialdata object with a coordinate system global having a scale transform and another coordinate system with a identity transform.

using:

sdata.pp.get_elements('original_015_cyc2').pl.render_images().pl.show()```

This still plots both coordinate systems.
image

Recommend Projects

  • React photo React

    A declarative, efficient, and flexible JavaScript library for building user interfaces.

  • Vue.js photo Vue.js

    🖖 Vue.js is a progressive, incrementally-adoptable JavaScript framework for building UI on the web.

  • Typescript photo Typescript

    TypeScript is a superset of JavaScript that compiles to clean JavaScript output.

  • TensorFlow photo TensorFlow

    An Open Source Machine Learning Framework for Everyone

  • Django photo Django

    The Web framework for perfectionists with deadlines.

  • D3 photo D3

    Bring data to life with SVG, Canvas and HTML. 📊📈🎉

Recommend Topics

  • javascript

    JavaScript (JS) is a lightweight interpreted programming language with first-class functions.

  • web

    Some thing interesting about web. New door for the world.

  • server

    A server is a program made to process requests and deliver data to clients.

  • Machine learning

    Machine learning is a way of modeling and interpreting data that allows a piece of software to respond intelligently.

  • Game

    Some thing interesting about game, make everyone happy.

Recommend Org

  • Facebook photo Facebook

    We are working to build community through open source technology. NB: members must have two-factor auth.

  • Microsoft photo Microsoft

    Open source projects and samples from Microsoft.

  • Google photo Google

    Google ❤️ Open Source for everyone.

  • D3 photo D3

    Data-Driven Documents codes.