Git Product home page Git Product logo

seaborn's Introduction


seaborn: statistical data visualization

PyPI Version License DOI Tests Code Coverage

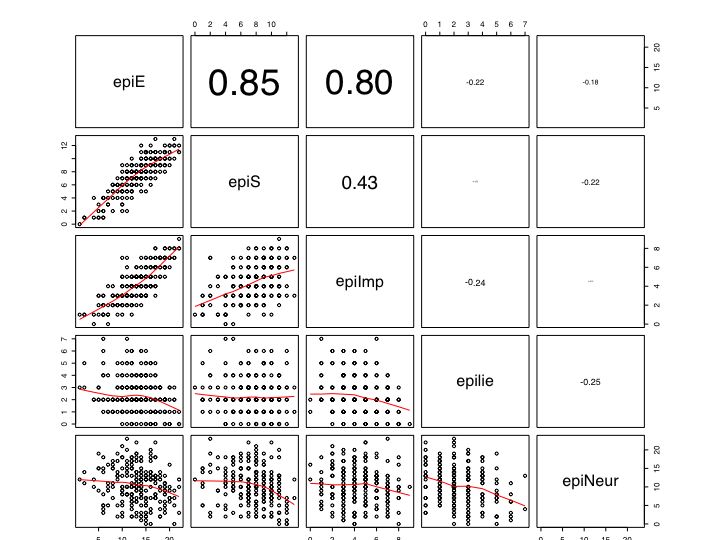
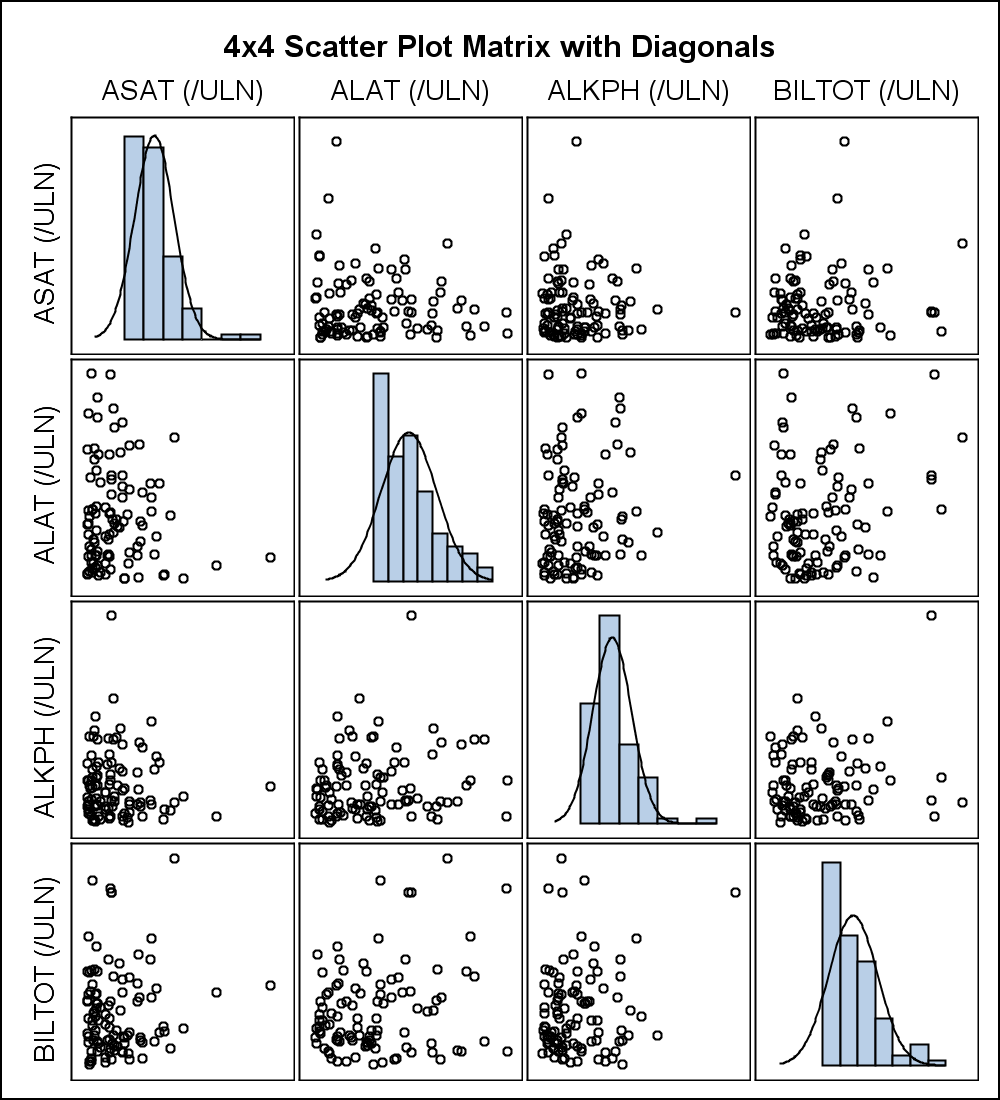
Seaborn is a Python visualization library based on matplotlib. It provides a high-level interface for drawing attractive statistical graphics.

Documentation

Online documentation is available at seaborn.pydata.org.

The docs include a tutorial, example gallery, API reference, FAQ, and other useful information.

To build the documentation locally, please refer to doc/README.md.

Dependencies

Seaborn supports Python 3.8+.

Installation requires numpy, pandas, and matplotlib. Some advanced statistical functionality requires scipy and/or statsmodels.

Installation

The latest stable release (and required dependencies) can be installed from PyPI:

pip install seaborn

It is also possible to include optional statistical dependencies:

pip install seaborn[stats]

Seaborn can also be installed with conda:

conda install seaborn

Note that the main anaconda repository lags PyPI in adding new releases, but conda-forge (-c conda-forge) typically updates quickly.

Citing

A paper describing seaborn has been published in the Journal of Open Source Software. The paper provides an introduction to the key features of the library, and it can be used as a citation if seaborn proves integral to a scientific publication.

Testing

Testing seaborn requires installing additional dependencies; they can be installed with the dev extra (e.g., pip install .[dev]).

To test the code, run make test in the source directory. This will exercise the unit tests (using pytest) and generate a coverage report.

Code style is enforced with flake8 using the settings in the setup.cfg file. Run make lint to check. Alternately, you can use pre-commit to automatically run lint checks on any files you are committing: just run pre-commit install to set it up, and then commit as usual going forward.

Development

Seaborn development takes place on Github: https://github.com/mwaskom/seaborn

Please submit bugs that you encounter to the issue tracker with a reproducible example demonstrating the problem. Questions about usage are more at home on StackOverflow, where there is a seaborn tag.

seaborn's People

Contributors

alimanfoo avatar corbanswain avatar dcgemperline avatar dependabot[bot] avatar drewokane avatar e-q avatar ewouth avatar gkunter avatar jakevdp avatar joelostblom avatar jwarmenhoven avatar kyleam avatar lukauskas avatar maozgelbart avatar marcelm avatar mwaskom avatar olgabot avatar petebachant avatar phobson avatar pnacht avatar pyeguy avatar sdvillal avatar shoyer avatar stefmolin avatar tomaugspurger avatar ttbrunner avatar tyarkoni avatar wintermind avatar yarikoptic avatar yvonnefroehlich avatar

Stargazers

 avatar  avatar  avatar  avatar  avatar  avatar  avatar  avatar  avatar  avatar  avatar  avatar  avatar  avatar  avatar  avatar  avatar  avatar  avatar  avatar  avatar  avatar  avatar  avatar  avatar  avatar  avatar  avatar  avatar  avatar  avatar  avatar  avatar  avatar  avatar  avatar  avatar  avatar  avatar  avatar  avatar  avatar  avatar  avatar  avatar  avatar  avatar  avatar  avatar  avatar  avatar  avatar  avatar  avatar  avatar  avatar  avatar  avatar  avatar  avatar  avatar  avatar  avatar  avatar  avatar  avatar  avatar  avatar  avatar  avatar  avatar  avatar  avatar  avatar  avatar  avatar  avatar  avatar  avatar  avatar  avatar  avatar  avatar  avatar  avatar  avatar  avatar  avatar  avatar  avatar  avatar  avatar  avatar  avatar  avatar  avatar  avatar  avatar  avatar  avatar

Watchers

 avatar  avatar  avatar  avatar  avatar  avatar  avatar  avatar  avatar  avatar  avatar  avatar  avatar  avatar  avatar  avatar  avatar  avatar  avatar  avatar  avatar  avatar  avatar  avatar  avatar  avatar  avatar  avatar  avatar  avatar  avatar  avatar  avatar  avatar  avatar  avatar  avatar  avatar  avatar  avatar  avatar  avatar  avatar  avatar  avatar  avatar  avatar  avatar  avatar  avatar  avatar  avatar  avatar  avatar  avatar  avatar  avatar  avatar  avatar  avatar  avatar  avatar  avatar  avatar  avatar  avatar  avatar  avatar  avatar  avatar  avatar  avatar  avatar  avatar  avatar  avatar  avatar  avatar  avatar  avatar  avatar  avatar  avatar  avatar  avatar  avatar  avatar  avatar  avatar  avatar  avatar  avatar  avatar  avatar  avatar  avatar  avatar  avatar  avatar  avatar

seaborn's Issues

Roadmap for v0.3

Here on some general thoughts on things I have in mind for the next release. I'll link this up to specific issues as we go on.

Axis grid system

The main work in 0.3 is going to be on a new kind of object in seaborn that abstracts the axis setup for complex plots away from the functions that use them (e.g. lmplot(), regplot(), etc.) into class objects that handle the gridding and pandas logic. I currently have in mind two such classes:

FacetGrid

This is basically half of what lmplot() currently is. It will take a dataframe and some information about row and column axes (and color grouping). Then, arbitrary plotting functions can be passed into the facet object and applied to each subset of the data. This will mean changing how lmplot() works and likely breaking API on regplot() horribly to turn it into a low-level function for drawing the scatter, regression line, CI, etc, which would be useful to have in any case. I'm not wild about breaking API, but I see no good other names for such a function.

MarginGrid

This will basically take the structure of the regplot() grid and open it up for things like bivariate kdeplot() with the univariate KDEs plotted on the marginals, hexbins with marginal histograms, etc.

factorplot()

factorplot() is going to be similar in spirit to lmplot() for for situations where the x variable is categorical with more than two levels. I imagine the actual drawing will be somewhat modular, with both barplots and point estimates (connected and not connected) as options. It will exploit the FacetGrid for faceting, although color-grouping will likely have to work a bit differently if barplots are going to make sense.

jointplot()

jointplot() will basically do what regplot() does now, except more generally, so this is how you'd draw your bivariate KDE with marginals, etc.

Better support for user-specific style

This sort of thing is less interesting for me, since seaborn already reflects my own personal preferences (naturally), but I'm aware there are people who like part of but not all of the native styles and would like a way to adapt the package that doesn't require messing with the rc parameters themselves in every script/notebook. With that said, I'm not wild about the rc file approach, because it sucks to be looking at a notebook on nbviewer with great-looking plots and not knowing how to reproduce them because the parameters live in a matplotlibrc that's not part of the notebook rendering. I'm very open to ideas about what to do here.

Feature request: Add scatter matrix

For low-dimensional data I find the scatter-matrix plot extremely helpful. While pandas provides one it's not very functional. I would imagine several additions that could be done:

Detect missing six script

After my first installation of seaborn, I tried "import seaborn as sns" and got an error:

File "build/bdist.linux-x86_64/egg/seaborn/init.py", line 1, in
File "build/bdist.linux-x86_64/egg/seaborn/rcmod.py", line 5, in
File "build/bdist.linux-x86_64/egg/seaborn/utils.py", line 11, in ImportError: cannot import name range

Checking line 11 of utils.py reveals that this is due to the missing six module. After installing it, everything worked fine. It would be good to detect the missing six module at installation.

restore **origin** theme and not **default** theme.

Hi,

I found of about seaborn.reset_defaults() , may I suggest a seaborn.reset_origin() ? Which will partialy take into account user matplotlibrc file and user modification ?

I also found that matplotlib.rcParams.update(matplotlib.rcParamsOrig) is not reliable and that you should make a copy of default param before importing seaborn.

If you are not against and I find some time I could make a PR.

Feature Request: JMP-Style Grouped Boxplots

Left as a discussion for pandas as well, here:

pandas-dev/pandas#5825

For a lot of work in statistics, box plots are still one of the most useful tools for at-a-glance comparison of experimental groups. JMP has a great default handler for plotting box plots when including multiple grouping levels for the data, including sane handling for missing data. Please see this example for what a simple case looks like:

hierarchy_boxplot_jmp-style

In terms of 'sane defaults' and making a lot of use without a lot of work, I think this would be a great model for future box plot work for pandas given its rich GroupBy functionality. When creating a box plot based on a multi-level grouping in pandas/matplotlib, the only obvious method I can see is to use labels which are tuples of each of the values for the various group levels. This makes it hard to get much out of the plot visually for grouped data set.

JMP has a variety of other features for box plots that would be very useful in the future, but I believe this first visual enhancement would be more powerful for the most users.

This implementation would be coupled to DataFrame/GroupBy API but would be very nice with Seaborn boxplots and violin plots.

Add a contributing file

A note to myself that I need to make a file with some basic information about the development workflow

import rcmod fails in __init__.py

I just used pip to install seaborn on my computer (anaconda, Python 3.3.3, OS X 10.7) having installed all dependencies.

import seaborn as sns

fails with: ImportError: No module named 'rcmod'. rcmod.py is sitting there in the anaconda/lib/python3.3/site-packages/seaborn folder yet Python complains when it's imported in __init__.py.

tsplot cannot use variables in a DataFrame index

Here is a notebook that illustrates the issue.

It appears that if one passes a dataframe with a date based index and no condition; one goes down the first branch in tsplot() in timeseries.py

As near as I can tell, constructing an x near line 99 of timeseries.py would make this work. Trying to determine exactly what goes into that line

df.index.values.astype(np.float) 

doesn't work, but something near it should. ( or I just need to convert dates to? )

'module' object has no attribute 'palplot'

When trying to step through your aesthetics notebook using the latest IPython (1.1.0) as distributed with Anaconda and the latest version of Seaborn downloaded from the repo today ("Download ZIP") I get the following error:

sns.palplot(current_palette)


AttributeError Traceback (most recent call last)
in ()
----> 1 sns.palplot(current_palette)

AttributeError: 'module' object has no attribute 'palplot'

I suspect that I somehow have an old version of either Seaborn or a dependency. Has anyone else had this problem?

Missing license

Looking through the repo I couldn't locate the license under which you've released
the library nor do the source files contain a license header. That's a problem
for users who wish to make use of the library.

If you're unsure which license you should use, github offers a friendly overview of the most
popular OSS licenses at choosealicense.com. Customarily a LICENSE file is placed
in the root directory.

Of course, I'm assuming you meant this to be Open-Source Software as
it's a public repo on github, but without an explicit license it isn't.

Thanks for all your work.

BUG: Regplot with lists: "TypeError: only integer arrays with one element can be converted to an index"

Awesome lib, thanks!

The following sequence of commands results in a Traceback (from moss) and
also a figure.

import seaborn as sns
x, y = range(100), range(100)
sns.regplot(x, y)

Traceback::

<matplotlib.figure.Figure object at 0xbdb0b6c>
Traceback (most recent call last):

File "<ipython-input-4-48c88ed4333f>", line 1, in <module>
    sns.regplot(x, y)

File ".../seaborn/plotobjs.py", line 742, in regplot
    boots = moss.bootstrap(x, y, func=_bootstrap_reg)

File ".../lib/python2.7/site-packages/moss/statistical.py", line 61, in bootstrap
    sample = [a[resampler] for a in args]

TypeError: only integer arrays with one element can be converted to an index

A comparable pandas DataFrame approach doesn't raise any errors:

import seaborn as sns
import pandas as pd
df = pd.DataFrame({'one':range(100), 'two':range(100)})
sns.regplot('one', 'two', df)

Versions:

seaborn -- seaborn/master
husl -- pypi latest
moss -- pypi latest

Violin plot on groupby'd series

Hello there,
I'm having trouble getting the violin plots to work on groupby'd series. This could be coming from the fact that I learned groupbys yesterday, but I'll let you be the judge.

Here's the notebook: http://nbviewer.ipython.org/gist/olgabot/8118511

The main issue is, I try:

sns.violinplot(df.ix['gene_8'], groupby=sample_id_to_celltype)

But I get:

AttributeError: Cannot access attribute 'values' of 'SeriesGroupBy' objects, try using the 'apply' method

I'm using pandas v12.0.

What I did get to work, though, was:

s = df.ix['gene_8']

new_index = pd.MultiIndex.from_tuples([(celltype_to_long_name[v[0]], v) for v in s.index], 
                                      names=['celltype', 'sample_id'])
s.index = new_index
grouped = s.groupby(level='celltype')
data = [v.dropna().values if v.dropna().shape[0] > 0 else [-1,-2] for k, v in list(grouped)]

ax = sns.violinplot(data, names=s.index.levels[0], bw=0.05)
ax.set_ylim(0,1)

So this example is interesting for a couple reasons.

  1. I had to dropna before feeding things to violinplot. Is it possible to dropna within violinplot, before giving the data to gaussian_kde?
  2. I had to add some faux data for if the celltype didn't have that gene at all, because I still wanted something plotted, even though it was empty. Thoughts about this?

I'll be happy to implement any changes.

Allow for importing without manipulating the rcParams

As much as I like the default style (that's why I made it the default), there are situations where people might want to use the plotting functions, but not the style. It actually used to be the case that you would have to call

seaborn.set()

after importing, but I decided that was kind of gross. Once #10 is sorted out it will be easy to revert the style changes that get made, but even then I think it might be nice to have something like

import seaborn.apionly as sns

which would give you the whole namespace, but avoid the call to rcmod.set() in __init__.py.

I'm not sure I've ever seen this design pattern in a Python package so I'm not certain of the correct/clean way to do it. Please pipe up if you have an idea.

seaborn and prettyplotlib

I just found seaborn through a blog post by @tyarkoni. It seems to be similarly aligned with prettyplotlib by @olgabot. My first impression is that seaborn seems to have more emphasis on extending plot-type support of matplotlib, while prettyplotlib is more oriented towards improving the overall look and feel of plots produced by matplotlib, in general. I wanted to start a discussion between the two package maintainers, @mwaskom and @olgabot, to see if there was potential for collaboration and de-duplication of effort.

Regards,
Chris L., a.k.a. @gotgenes

Change violin to violinplot

This is a glaring inconsistency. Let's do a release cycle with a deprecation warning and automatic calling of violinplot behind the scenes, and then remove violin.

Heatmaps?

Hello there,

I'm working on a heatmap PR for pandas (pandas-dev/pandas#5646) but it's been suggested that all visualizations be worked on in separate packages. Since seaborn already supports pandas internally and does a lot of the "run some algorithm and then show me the result" kind of stuff (violinplot, kde fitting, linear fitting, etc)

How do you think this fits with seaborn?

Olga

PS I made prettyplotlib which is a small matplotlib wrapper and I'm down to merge efforts but only if the nogrid also automatically despines the top and right axes. :)

PPS I'm also working on a PR for seaborn to accept a bw_method kwarg for violin because I need narrower bandwidths for my research.

PPPS THANK YOU for making paper/poster/notebook/talk contexts. Seriously one of the best things ever.

ImportError: cannot import name range

Hi, I installed seaborn with pip install seaborn and the installation went smooth (it installed all the needed dependencies)

When I import it I get the error in the title:

ImportError: cannot import name range

It tries to:

from six.moves import range

Now if I open a python shell and import six I don't see a six.moves.range (I do see a six.moves.xrange)

I know I must be doing something wrong because nobody else has this problem, and maybe it does not even depend on seaborn, but since it popped up there, I dare to ask.

Thanks in advance.

python 3.3+ compatiblity

Hello,

I see you wrote python 2.7 in your requirements.
Do you know of something avoiding this to work with python 3.3+ ?

statsmodels overlap

Hi, great-looking project. Just wanted to point out that statsmodels has a graphics/ directory. Feel free to plunder for more plots to add (or use directly) since you already have the dependency to seaborn.

https://github.com/statsmodels/statsmodels/tree/master/statsmodels/graphics
http://statsmodels.sourceforge.net/devel/graphics.html

There's a still open pull request here you might be interested in

statsmodels/statsmodels#853

You'll also find that the performance of the statsmodels KDE (using FFT) should be better than that of scipy for univariate density estimation and the bandwidth selection should be more flexible.

cc @josef-pkt

error in "boxplot - groupby", under Python 3.3

The following code runs fine in Python 2.7, but crashed in Python 3.3:

import pandas as pd
import seaborn as sns
data = pd.DataFrame({'x':randn(6), 'y':[0,0,0,1,1,1]})
sns.boxplot(data['x'], groupby=data['y'])

The code runs when I replace "data['x']" with "data[['x']]" or with "data['x'].values", but then the grouping does not work. The errormessage in case of a crash is

AttributeError Traceback (most recent call last)
in ()
3
4 data = pd.DataFrame({'x':randn(6), 'y':[0,0,0,1,1,1]})
----> 5 sns.boxplot(data['x'], groupby=data['y'])
6

C:\WinPython-64bit-3.3.3.2\python-3.3.3.amd64\lib\site-packages\seaborn\distributions.py in boxplot(vals, groupby, names, join_rm, order, color, alpha, fliersize, linewidth, widths, ax, **kwargs)
81 xlabel = groupby.name
82 ylabel = vals.name
---> 83 grouped_vals = pd.groupby(vals, groupby).values
84 if order is not None:
85 grouped_vals = grouped_vals[order]

C:\WinPython-64bit-3.3.3.2\python-3.3.3.amd64\lib\site-packages\pandas\core\groupby.py in getattr(self, attr)
293
294 if hasattr(self.obj, attr) and attr != '_cache':
--> 295 return self._make_wrapper(attr)
296
297 raise AttributeError("%r object has no attribute %r" %

C:\WinPython-64bit-3.3.3.2\python-3.3.3.amd64\lib\site-packages\pandas\core\groupby.py in _make_wrapper(self, name)
308 "using the 'apply' method".format(kind, name,
309 type(self).name))
--> 310 raise AttributeError(msg)
311
312 f = getattr(self.obj, name)

AttributeError: Cannot access attribute 'values' of 'SeriesGroupBy' objects, try using the 'apply' method

distplot bins argument

The documentation states that:

Unlike the default matplotlib hist function, distplot tries to use a good number of bins for the dataset you have, although all of the options for specifying bins in hist can be used.`

Attempting to use the bins argument results in:

TypeError: distplot() got an unexpected keyword argument 'bins'

Attempting to pass it through with kwargs fails as well:

hist_kws = {"bins": 10}

Is this a bug or am I missing something?

Could statsmodels dependency be replaced with scipy?

It seems that some package maintainers that would like to rely on seaborn are hesitant to add more dependencies. I was thus wondering if statsmodels is really required as scipy provides linear regression (via stats.linregress) and KDE.

Did miss anything that's only in statsmodels?

'pip install seaborn' doesn't auto-install dependencies

Seaborn is looking great, but I noticed that the installation is not as smooth as it could be.

Installing with pip install seaborn doesn't automatically install the required dependencies, as is often the case with other libraries. This shows up as an obvious problem when you first import seaborn

The work-around is easy (just pip install the dependencies), but this should probably be automatic as it is for other packages.

Improve style interface

Some quick notes on what's going to be happening here:

  • Add a new function axes_style (or similar) that returns a dictionary that can be used to update matplotlib.rcParams.
  • That dictionary will actually be a context manager (subclassed dict with __enter__ and __exit__ methods) so that you could do
sns.set(style="darkgrid")
sns.interactplot("x", "y", "z", data)

with sns.axes_style("nogrid"):
    sns.regplot("x", "y", data)

sns.kdeplot(data.x)

Such that the regplot will have be themed with nogrid and the interactplot andkdeplotwill be themed withdarkgrid`.

I think axes_style should also take keyword arguments that override any rc values it's messing with/complement the changes.

remove set() from __init__

i think it would make more sense for the user to call set() , as opposed to init doing it. its unexpected behavior.

Boxplot ordering

Feature request: an easy way to specify the order in which boxes on a boxplot or violin plot appear

distplot() choking on all-integer dataset + others

Using the development version from Git, I ran into the following exception while trying to do a simple distplot() command with a list of integer arguments:

>>> sns.distplot([1,2,5,5,2,25,55,56,88,89,80])

---------------------------------------------------------------------------
ValueError                                Traceback (most recent call last)
<ipython-input-6-a4de69eda2f5> in <module>()
----> 1 sns.distplot([1,2,5,5,2,25,55,56,88,89,80])

/home/ubuntu/anaconda/lib/python2.7/site-packages/seaborn/distributions.pyc in distplot(a, bins, hist, kde, rug, fit, hist_kws, kde_kws, rug_kws, fit_kws, color, vertical, axlabel, ax)
    462     if kde:
    463         kde_color = kde_kws.pop("color", color)
--> 464         kdeplot(a, vertical=vertical, color=kde_color, ax=ax, **kde_kws)
    465 
    466     if rug:

/home/ubuntu/anaconda/lib/python2.7/site-packages/seaborn/distributions.pyc in kdeplot(data, data2, shade, vertical, kernel, bw, gridsize, cut, clip, legend, ax, **kwargs)
    646     else:
    647         ax = _univariate_kde(data, shade, vertical, kernel, bw,
--> 648                              gridsize, cut, clip, legend, ax, **kwargs)
    649 
    650     return ax

/home/ubuntu/anaconda/lib/python2.7/site-packages/seaborn/distributions.pyc in _univariate_kde(data, shade, vertical, kernel, bw, gridsize, cut, clip, legend, ax, **kwargs)
    503     fft = kernel == "gau"
    504     kde = sm.nonparametric.KDEUnivariate(data)
--> 505     kde.fit(kernel, bw, fft, gridsize=gridsize, cut=cut, clip=clip)
    506     x, y = kde.support, kde.density
    507     if vertical:

/home/ubuntu/anaconda/lib/python2.7/site-packages/statsmodels/nonparametric/kde.pyc in fit(self, kernel, bw, fft, weights, gridsize, adjust, cut, clip)
    140             density, grid, bw = kdensityfft(endog, kernel=kernel, bw=bw,
    141                     adjust=adjust, weights=weights, gridsize=gridsize,
--> 142                     clip=clip, cut=cut)
    143         else:
    144             density, grid, bw = kdensity(endog, kernel=kernel, bw=bw,

/home/ubuntu/anaconda/lib/python2.7/site-packages/statsmodels/nonparametric/kde.pyc in kdensityfft(X, kernel, bw, weights, gridsize, adjust, clip, cut, retgrid)
    482 
    483 #NOTE: THE ABOVE IS WRONG, JUST TRY WITH LINEAR BINNING
--> 484     binned = fast_linbin(X,a,b,gridsize)/(delta*nobs)
    485 
    486     # step 2 compute FFT of the weights, using Munro (1976) FFT convention

/home/ubuntu/anaconda/lib/python2.7/site-packages/statsmodels/nonparametric/linbin.so in statsmodels.nonparametric.linbin.fast_linbin (statsmodels/nonparametric/linbin.c:1246)()

ValueError: Buffer dtype mismatch, expected 'DOUBLE' but got 'long'

If I convert one of the data points into a float, I get the following plot (with a single bin!):

sns.distplot([1,2,5,5,2,25,55,56,88,89,80.])

image

Using all floats doesn't change the result (still a single bin), however manually setting the bins gave the expected result. I guess the auto-binning algorithm isn't quite working correctly.

I cannot access seaborn.factorplot from seaborn 0.3dev

Cf the seaborn titanic notebook

In [1]: import numpy as np
import pandas as pd
import seaborn as sns
sns.set(style="nogrid")
sns.__version__
Out[1]: '0.3.dev'

In [2]: sns.
sns.axlabel            sns.dark_palette       sns.interactplot       sns.mpl_palette        sns.rcmod              sns.sm
sns.blend_palette      sns.desaturate         sns.interpolate        sns.mplcol             sns.regplot            sns.stats
sns.boxplot            sns.despine            sns.isreal             sns.np                 sns.reset_defaults     sns.string_types
sns.ci_to_errsize      sns.distance           sns.itertools          sns.palette_context    sns.rugplot            sns.symmatplot
sns.coefplot           sns.distplot           sns.kdeplot            sns.palplot            sns.saturate           sns.timeseries
sns.color_palette      sns.distributions      sns.linearmodels       sns.pd                 sns.set                sns.tsplot
sns.colorsys           sns.division           sns.lmplot             sns.plt                sns.set_axes_style     sns.utils
sns.contextlib         sns.hls_palette        sns.miscplot           sns.pmf_hist           sns.set_color_palette  sns.violin
sns.corrplot           sns.husl               sns.moss               sns.puppyplot          sns.set_hls_values     sns.violinplot
sns.cycle              sns.husl_palette       sns.mpl                sns.range              sns.sf                 

Relieve some mandatory dependencies

I've seen some complaints that the dependency load is too high. It's pretty straightforward on Anaconda, but outside of a nice managed ecosystem I'm sure it's annoying.

So here's how I think it can break down:

Mandatory: numpy, scipy, matplotlib, pandas

Highly recommended, but hidden: statsmodels, patsy

Packaged in seaborn: husl, moss, six

I'm not sure what the best way to pull husl and moss into seaborn is. It really only uses a couple of functions from moss, so those could just be copied over as a last resort. I think husl is just a single file, so I guess it could also be copied? Are there cleaner solutions here?

At some point I do want to have more color math stuff in seaborn anyway, so maybe taking the bits I need from husl (not that much, actually) and seeding seaborn.color with it is the right course.

Setting the order of boxes in sns.boxplot()

Love what you are doing with this visualization library.

I am having a hard time, though, figuring out how to set the order for a groupby boxplot. The order of the boxes seems to follow the sorted order of the groupby functionality, alphabetical when I am grouping by genotype. Labels on the boxes, however, seem to follow the order the data take in the dataframe. This leads to mislabeled plots.

Is there a way to specify the order in which the boxes appear?

Requirements not installed

I cloned the repo and tried to install with python setup.py install but some requirements were not installed: husl, patsy, moss, scikit-learn, statsmodels 0.5.0.

Most packages are easily installed with pip, the latter two, at least on windows, is easier to install as a binary (statsmodels, scikit-learn).

Recommend Projects

  • React photo React

    A declarative, efficient, and flexible JavaScript library for building user interfaces.

  • Vue.js photo Vue.js

    ๐Ÿ–– Vue.js is a progressive, incrementally-adoptable JavaScript framework for building UI on the web.

  • Typescript photo Typescript

    TypeScript is a superset of JavaScript that compiles to clean JavaScript output.

  • TensorFlow photo TensorFlow

    An Open Source Machine Learning Framework for Everyone

  • Django photo Django

    The Web framework for perfectionists with deadlines.

  • D3 photo D3

    Bring data to life with SVG, Canvas and HTML. ๐Ÿ“Š๐Ÿ“ˆ๐ŸŽ‰

Recommend Topics

  • javascript

    JavaScript (JS) is a lightweight interpreted programming language with first-class functions.

  • web

    Some thing interesting about web. New door for the world.

  • server

    A server is a program made to process requests and deliver data to clients.

  • Machine learning

    Machine learning is a way of modeling and interpreting data that allows a piece of software to respond intelligently.

  • Game

    Some thing interesting about game, make everyone happy.

Recommend Org

  • Facebook photo Facebook

    We are working to build community through open source technology. NB: members must have two-factor auth.

  • Microsoft photo Microsoft

    Open source projects and samples from Microsoft.

  • Google photo Google

    Google โค๏ธ Open Source for everyone.

  • D3 photo D3

    Data-Driven Documents codes.