lpantano / degreport Goto Github PK
View Code? Open in Web Editor NEWCreate a cromphensive report of DEG list coming from any analysis of RNAseq data
Home Page: http://lpantano.github.io/DEGreport/
License: MIT License
Create a cromphensive report of DEG list coming from any analysis of RNAseq data
Home Page: http://lpantano.github.io/DEGreport/
License: MIT License


Hi Lorena,
Thank you for providing this great package! I am just wondering how does degPatterns() decide what height to use for cutting the tree? And is there a way to set the height manually?
Also, in the normalized data generated from degPatterns(), there are a lot of columns named with cutoff, what are these columns and are these used during the decision making process?
colnames(patterns$normalized)
[1] "genes" "merge" "value" "Animal.ID" "Age"
[6] "Sex" "Region" "Sequencing.run" "Analysis.ID" "Age_days"
[11] "colored" "cluster" "cutoff0.018" "cutoff0.071" "cutoff0.16"
[16] "cutoff0.284" "cutoff0.444" "cutoff0.64" "cutoff0.871" "cutoff1.138"
[21] "cutoff1.44" "cutoff2.151" "cutoff3.484" "cutoff4"
Thanks,
Sang
some graph with not useful labels
see note evernote
Dear Team,
I am using degPatten to cluster and observe the changes across different time points.
The command used is:
res <- degPatterns(ma, design, time = "Age")
design is as follows:
| Age | sizeFactor | |
|---|---|---|
| Sample_41 | 6M | 0.6995291 |
| Sample_42 | 6M | 1.4067538 |
| Sample_44 | 6M | 0.7072592 |
| Sample_45 | 12M | 0.8811723 |
| Sample_46 | 12M | 0.9847001 |
| Sample_47 | 12M | 0.7857639 |
| Sample_48 | 18M | 1.1178253 |
| Sample_49 | 18M | 1.1713206 |
| Sample_50 | 18M | 1.2827632 |
| Sample_51 | 18M | 1.4135661 |
| Sample_52 | 21M | 1.2095196 |
| Sample_53 | 21M | 0.8607367 |
| Sample_54 | 21M | 1.0009709 |
The generated plot is here:
https://www.dropbox.com/s/52h2ryl90e4i5sz/degPatternTest.pdf?dl=0
In the design the time series is incremental i.e. "Age" is ascending. However, in the plot its shown as 12M, 18M, 21M, 6M. I want 6M,12M,18M,21M. How can I control the labelling?
Thanks,
Sudeep
Can you extract as a data.frame a list of the genes included on each of the groups generated
after degPlotCluster(res3$normalized, "condition") ?
Hi, I'm trying to run DEGreport following this tutorial http://bioconductor.org/packages/devel/bioc/vignettes/DEGreport/inst/doc/DEGreport.html. I have installed and loaded DEGreport 1.18.1.
when I try to run " degCheckFactors(counts[, 1:6])", I keep getting the following error:
Error in degCheckFactors(normalized_counts[, 1:6]) :
could not find function "degCheckFactors"
I have tried re-installing and loading the package again and again but I keep getting the same issue. Any ideas what could have gone wrong?
Hello,
First of all bear with me as I'm not very proficient in R...
I used an older version of DEGpatterns (DEGreport_1.30.3 running on R version 4.1.2). However, I wanted the option to choose the number of clusters (nClusters=) not available on this version. I decided then to update both R (to R 4.3-arm64) and DEGreport_1.39_3. I am on a Mac M1 and running this in Rstudio.
Unfortunately, the script now fails as I have the following error message:
dp<-degPatterns(vst_data,time="time",metadata = colData(dds_time), nClusters=5)
Error in set(., "labels", "") : could not find function "set"
The clusters appears fine as plots, but the object (dp) is not saved.
Could you possibly tell me if I'm doing something wrong? Looking at the function, it seems that one of the "set" command is "dendextend::set", but second is just "set" (and that's the problematic one , as far as I understand the script.
Many thanks,
Regards,
Philippe
Hello,
I have the following design matrix (all columns are characters):
group time replicate
ZN_D0_1 control 0 1
ZN_D0_2 control 0 2
ZN_D0_3 control 0 3
ZN_D1_1 control 1 1
ZN_D1_2 control 1 2
ZN_D3_1 control 3 1
ZN_D3_2 control 3 2
ZN_D3_3 control 3 3
ZN_D5_1 control 5 1
ZN_D5_2 control 5 2
ZN_D5_3 control 5 3
I23_D0_1 Trt1 0 1
I23_D0_2 Trt1 0 2
I23_D0_3 Trt1 0 3
I23_D1_1 Trt1 1 1
I23_D1_2 Trt1 1 2
I23_D1_3 Trt1 1 3
I23_D3_1 Trt1 3 1
I23_D3_2 Trt1 3 2
I23_D3_3 Trt1 3 3
I23_D5_1 Trt1 5 1
I23_D5_2 Trt1 5 2
I23_D5_3 Trt1 5 3
E33_D0_1 Trt2 0 1
E33_D0_2 Trt2 0 2
E33_D0_3 Trt2 0 3
E33_D1_1 Trt2 1 1
E33_D1_2 Trt2 1 2
E33_D1_3 Trt2 1 3
E33_D3_1 Trt2 3 1
E33_D3_2 Trt2 3 2
E33_D3_3 Trt2 3 3
E33_D5_1 Trt2 5 1
E33_D5_2 Trt2 5 2
E33_D5_3 Trt2 5 3
I have used DEGPatterns to obtain clusters for genes which show effects due to treatment (group) over time. I would like to show the boxplots for each group from a specific cluster over time. Similar to this individual's figure: #35
I thought there was an issue with my design matrix. I have tried having the time column as a numeric and as a character. I have also tried to merge according to the replicate column but to no avail. I have looked at the vignette for DEGreport, but I could have missed something.
Any help would be appreciated, and I can provide more details if necessary.
Hi Ipantano,
I have more a theoretical question about your package than a software bug.
I have ran the function degPatterns and have been using the resulting plot data for further analysis. I am wondering what the "z-score of gene abundance" means in the plot for degPatterns. I read: "The y-axis in the figure is the results of applying scale() R function, what is similar to creating a Z-score where values are centered to the mean and scaled to the standard deviation by each gene."
However, there is one dot per gene per condition. If I have three replicates there are not three dots per conditions. Hence, the question: how are the replicates combined to get a single z-score?
Thank you in advance,
Ruben
Hi @lpantano , hope you're doing well!
I'm seeing an error in bcbioRNASeq::plotPCACovariates() due to a breaking change in DEGreport::degCovariates(). Here's the traceback:
library(bcbioRNASeq)
data(bcb)
plotPCACovariates(bcb)

> packageVersion("DEGreport")
[1] ‘1.24.1’
> packageVersion("bcbioRNAseq")
[1] ‘0.3.33’
running pca and calculating correlations for:
un-scaled data in pca;
pve >= 5%;
kendall cor
Error: Problem with `filter()` input `..1`.
x object 'term' not found
ℹ Input `..1` is `!grepl("Intercept", term)`.
Backtrace:
█
1. ├─acidgenerics::plotPCACovariates(bcb)
2. └─bcbioRNASeq::plotPCACovariates(bcb)
3. └─bcbioRNASeq:::.local(object, ...)
4. ├─base::withCallingHandlers(...) R/plotPCACovariates-methods.R:85:8
5. └─DEGreport::degCovariates(...)
6. └─DEGreport:::.reduce_covariates(ma, samplepcvals, method)
7. └─`%>%`(...)
8. ├─base::withVisible(eval(quote(`_fseq`(`_lhs`)), env, env))
9. └─base::eval(quote(`_fseq`(`_lhs`)), env, env)
10. └─base::eval(quote(`_fseq`(`_lhs`)), env, env)
11. └─DEGreport:::`_fseq`(`_lhs`)
12. └─magrittr::freduce(value, `_function_list`)
13. ├─base::withVisible(function_list[[k]](value))
14. └─function_list[[k]](value)
15. ├─dplyr::filter(., !grepl("Intercept", !!!sym("term")))
16. └─dplyr:::filter.data.frame(., !grepl("Intercept", !!!sym("term")))
17. └─dplyr:::filter_rows(.data, ...)
18. └─base::tryCatch(...)
19. └─base:::tryCatchList(expr, classes, parentenv, handlers)
20. └─base:::tryCatchOne(expr, names, parentenv, handlers[[1L]])
21. └─value[[3L]](cond)
22. └─dplyr:::stop_dplyr(...)
Currently DEGreport depends on lasso2 which is an R4 only package.
Can we have a version that is compatible with 3.6 (considering that R4 is quite broken... still...)
Currently my cluster graphs are being sorted alphabetically (i.e. Group 1, Group 10, Group 11...).

I would like for my cluster graphs to be sorted numerically (i.e. Group 1, Group 2, Group 3...).
Is there a way to do this?
Dear Lorena,
I am testing degPatterns() to identify gene clusters exhibiting particular patterns across samples of RNA seq data. I would like to validate the clusters identified by computing silhouette. The results from degPatterns identified 9 clusters. I extracted hr, cutree, and looked at the size of the clusters. However, the sizes of the clusters are different from df. Shouldn´t be equal?
I tried to compute silhouette and the results showed a low ave.sil.width. How would you compute silhouette? I appreciate very much any suggestion.
results_degpatterns <- degPatterns(mydatamatrix, metadata= colData,
time= "Time", plot=T, col="Treatment",
reduce=TRUE, minc = 1)
df <- results_degpatterns$df
table(df$cluster)
1 2 3 4 5 6 7 8 9
1516 1616 68 108 11 135 23 5 6
hr <- results_degpatterns$hr
h_hr = hr$dc
grp <- cutree(as.hclust(hr), h=h_hr)
table(grp)
grp
1 2 3 4 5 6 7 8 9
1581 1645 73 116 13 145 26 6 6
m= 1-cor(t(mydatamatrix), method="kendal")
d= as.dist(m^2)
sihr <- silhouette(cutree(as.hclust(hr), h=h_hr),dist=d)
fviz_silhouette(sihr) #library(factoextra)
cluster size ave.sil.width
1 1 1581 0.15
2 2 1645 0.08
3 3 73 0.19
4 4 116 0.33
5 5 13 0.22
6 6 145 0.24
7 7 26 0.18
8 8 6 0.15
9 9 6 0.12
Thank you in advance,
Lorena Gallego
Talk to David to see if we can add this to here. Example in conference was for miRNA, any count data can be used.
For reference, my experimental design is the same as in issue #45
So I run the following code:
clusters1 <- degPatterns(cluster_rlog, metadata = col_data, time = "time", col = "group", plot = TRUE, eachStep = TRUE, scale = TRUE)
clusters1$df
class(clusters1)
And I get all the clusters that have minc>15. I understand the clustering is based on DIANA.
In the cluster output plot, the groups are listed as Group 1, Group 10, Group 11, Group 13, Group 14, Group 16, Group 17, Group 18, Group 19, Group 2, Group 20, Group 21............Group 3, Group 32......
My question is: Does the order of the output for the groups/clusters indicate the degree of variance (least similarity) from the mean for each group (treatment) (E.g. Group 1 is highest variance followed by Group 10, then Group 11, and so on)? OR is this just a matter of output based on reference number? (i.e. 1 comes before 2 and two digits follow a single digit)
Thank you so much in advance for your help!
Let me know if you need more details.
Hi,
When I try to install DEGreport, I get the following error at the end (all other dependencies install without any issue)
package ‘rjson’ successfully unpacked and MD5 sums checked Error in install.packages : ERROR: failed to lock directory ‘C:\Users\venura\Documents\R\win-library\4.0’ for modifying Try removing ‘C:\Users\venura\Documents\R\win-library\4.0/00LOCK’
Can you help me with this issue?
I am using RStudio ver 1.3.1093 and R-4.0.3
Thanks.
I think there is a bug in degPlotWide() in version 1.18.1 in the following code:
    if (is.null(group)) {
        dd$treatment = "one_group"
    }
    else {
        dd$treatment = dd[, "group"]
    }
With the above code, degPlotWide(dse, gene_names, group = "group")
works because is it grouping by "group", but if you change it to any other metadata column, you get the error:
Error in `[.data.frame`(dd, , "group") : undefined columns selected
which is fixed either by changing: "group" to group in this line:
dd$treatment = dd[, "group"] # SHOULD BE group not "group"
I initially spotted this problem with my own DESeqDataSet which didn't have a "group" metadata column, but instead used "condition" or "treatment". And then when I copied the condition column artificially to make a new metadata column called group, the plotting worked.
Hello,
I have cluster outputs from degPatterns where you can tell the expression pattern is the same/similar across sample groups. So this makes sense based on how the clustering is performed.
However, I have some from the output where they may be similar up until my last timepoint, for example. And then I have some groups where I see a different pattern of expression between sample groups. How can this be?
You wrote in issue #28 "It is normal to find clusters that go almost identical, but you can see there is always a little different. I use the plot to then merge the groups to make more sense with your biology. If that little difference is not important, it makes sense to put all together."
I don't understand what you mean by the above sentence. I have a plot showing the normalized value across groups and time. Code:
p <- ggplot(clusters1[["normalized"]], aes(time, value, color=group, fill=group)) +
geom_boxplot() +
theme_classic() +
scale_fill_manual(values=c('darkgray', 'darkorange2', 'darkorchid4')) +
scale_colour_manual(values=c('black', 'black', 'black'))
p
But this is a single plot, and I'm not sure how that would help me understand the biology going on in one of my generated clusters, unless it is showing there are more DEGs at a particular timepoint and so that timepoint may perturb the expression pattern in a given cluster from the degPatterns output. Is this what you mean?
If not, I'm not sure how I would merge the groups for a single cluster?
Thanks in advance for your help!
Let me know if you need more details.
mainly that
Hello again,
Is there a way to only output one cluster plot if the number of the cluster is used as input? Let me know if this question doesn't make sense.
Thanks!
heads up lasso2 is no longer archived
currently have to install from source manually - https://cran.r-project.org/src/contrib/Archive/lasso2/
Hello!
I am doing the RNAseq data analysis.
When I try to run degPatterns with deferentially expressed genes.
The plot with all clusters is visualized, but afterwards I got an error:
C stack usage 7969268 is too close to the limit
and the object was not saved.
There are 3295 DEGs in my dataset. I tried the function with smaller number of genes and it worked till 2000 genes.
But for my project all 3295 genes are necessary and I am already using the p < 0.01.
I did the same analysis with same number of genes 1 month ago, and everything worked.
Below are the example of my code, output and session info:
matrix <- assay(dds)[genes_significant$gene_ID, ]
matrix <- varianceStabilizingTransformation(matrix)
gene_clusters <- degPatterns(matrix, metadata = metadata_rna, time = "stage")
A large number of genes was given-- please, make sure this is not an error. Normally, only DE genes will be useful for this function.
Working with 3295 genes.
Working with 3281 genes after filtering: minc > 15
Joining with `by = join_by(merge)`Joining with `by = join_by(merge)`Error: C stack usage  7969348 is too close to the limit
R version 4.3.1 (2023-06-16)
Platform: x86_64-pc-linux-gnu (64-bit)
Running under: Ubuntu 22.04.3 LTS

Matrix products: default
BLAS:   /usr/lib/x86_64-linux-gnu/openblas-pthread/libblas.so.3
LAPACK: /usr/lib/x86_64-linux-gnu/openblas-pthread/libopenblasp-r0.3.20.so;  LAPACK version 3.10.0

locale:
 [1] LC_CTYPE=en_US.UTF-8       LC_NUMERIC=C               LC_TIME=de_DE.UTF-8        LC_COLLATE=en_US.UTF-8
 [5] LC_MONETARY=de_DE.UTF-8    LC_MESSAGES=en_US.UTF-8    LC_PAPER=de_DE.UTF-8       LC_NAME=C
 [9] LC_ADDRESS=C               LC_TELEPHONE=C             LC_MEASUREMENT=de_DE.UTF-8 LC_IDENTIFICATION=C

time zone: Europe/Berlin
tzcode source: system (glibc)

attached base packages:
[1] stats4    stats     graphics  grDevices utils     datasets  methods   base

other attached packages:
 [1] DEGreport_1.38.5            lubridate_1.9.3             forcats_1.0.0               stringr_1.5.1
 [5] dplyr_1.1.4                 purrr_1.0.2                 readr_2.1.4                 tidyr_1.3.0
 [9] tibble_3.2.1                ggplot2_3.4.4               tidyverse_2.0.0             DESeq2_1.42.0
[13] SummarizedExperiment_1.32.0 Biobase_2.62.0              MatrixGenerics_1.14.0       matrixStats_1.2.0
[17] GenomicRanges_1.54.1        GenomeInfoDb_1.38.1         IRanges_2.36.0              S4Vectors_0.40.2
[21] BiocGenerics_0.48.1

loaded via a namespace (and not attached):
 [1] mnormt_2.1.1                bitops_1.0-7                gridExtra_2.3               rlang_1.1.2
 [5] magrittr_2.0.3              clue_0.3-65                 GetoptLong_1.0.5            compiler_4.3.1
 [9] mgcv_1.9-0                  png_0.1-8                   vctrs_0.6.5                 pkgconfig_2.0.3
[13] shape_1.4.6                 crayon_1.5.2                fastmap_1.1.1               backports_1.4.1
[17] XVector_0.42.0              labeling_0.4.3              utf8_1.2.4                  rmarkdown_2.25
[21] tzdb_0.4.0                  xfun_0.41                   zlibbioc_1.48.0             jsonlite_1.8.8
[25] reshape_0.8.9               DelayedArray_0.28.0         BiocParallel_1.36.0         psych_2.3.9
[29] broom_1.0.5                 parallel_4.3.1              cluster_2.1.4               R6_2.5.1
[33] stringi_1.8.3               RColorBrewer_1.1-3          limma_3.58.1                Rcpp_1.0.11
[37] iterators_1.0.14            knitr_1.45                  splines_4.3.1               Matrix_1.5-4.1
[41] timechange_0.2.0            tidyselect_1.2.0            rstudioapi_0.15.0           abind_1.4-5
[45] yaml_2.3.8                  viridis_0.6.4               doParallel_1.0.17           codetools_0.2-19
[49] plyr_1.8.9                  lattice_0.21-8              withr_2.5.2                 evaluate_0.23
[53] ConsensusClusterPlus_1.66.0 circlize_0.4.15             BiocManager_1.30.22         pillar_1.9.0
[57] foreach_1.5.2               plotly_4.10.3               generics_0.1.3              RCurl_1.98-1.13
[61] hms_1.1.3                   munsell_0.5.0               scales_1.3.0                glue_1.6.2
[65] lazyeval_0.2.2              tools_4.3.1                 dendextend_1.17.1           data.table_1.14.10
[69] locfit_1.5-9.8              cowplot_1.1.1               grid_4.3.1                  edgeR_4.0.3
[73] colorspace_2.1-0            nlme_3.1-162                GenomeInfoDbData_1.2.11     cli_3.6.2
[77] fansi_1.0.6                 S4Arrays_1.2.0              viridisLite_0.4.2           ggdendro_0.1.23
[81] ComplexHeatmap_2.18.0       gtable_0.3.4                logging_0.10-108            digest_0.6.33
[85] SparseArray_1.2.2           ggrepel_0.9.4               farver_2.1.1                rjson_0.2.21
[89] htmlwidgets_1.6.4           htmltools_0.5.7             lifecycle_1.0.4             httr_1.4.7
[93] GlobalOptions_0.1.2         statmod_1.5.0               MASS_7.3-60
Update: the error was caused by dendrogram functionality. When this option was deleted, everything worked.
I kindly ask developers to add parameter disabling dendrogram plot.
Dear @lpantano,
Thanks for so useful package! I'm having some strange miss-identification in my gene patterns:

I'd expect that degPatterns detect two differents groups inside each cluster (red/blue colored in the image below) but it doesn't... I'm using the following code:
> cnt[1:5,1:5]
         p1_monos_I p3_monos_I p4_monos_I p5_monos_I p6_monos_I
A1BG              0          1          1          0          0
A1BG-AS1          0         23         29         38         51
AAAS             99         34         42         60         58
AACS              8         37          9         10         32
AAGAB            74         55         69         30         65
> head(mdf)
             cod age genre hospital pat cond
p1_monos_I 30872  39     M      PMP  p1    I
p3_monos_I 30874  55     M      PMP  p3    I
p4_monos_I 30878  76     M      PMP  p4    I
p5_monos_I 30879  82     M      PMP  p5    I
p6_monos_I 30894  80     M      MAD  p6    I
p4_monos_R 30913  76     M      PMP  p4    R
> ds_s1 <- DESeqDataSetFromMatrix(countData = cnt, colData = mdf, design = ~ 0 + cond)
> ds_s1 <- DESeq(ds_s1, test = "LRT", reduced = ~1)
> res_s1 <- results(ds_s1)
> sig_s1 <- rownames(res_s1[res_s1$padj <= 0.1 & !is.na(res_s1$padj),])
> vsd <- vst(ds_s1, blind = FALSE)
> mdf$condDEG <- factor(mdf$cond)
> clusters <- degPatterns(assay(vsd)[sig_s1,], metadata = mdf, time = "cond", minc = 1, groupDifference = 0.3, eachStep = T)
I tried to avoid this behavior reducing the dispersion among genes with groupDifference and eachStep, analysis it works in other analysis but not in that one. Maybe I'm missing something?
Thanks for your help!
the tools only compare one group vs other. The idea will be to upgrade so it is able to compare any FC from any design like interactions or after blocking factors
Does "times" need to be numeric or there is a minimum number of time groups? In my case I have 3 locations and they are characters.
ma = assay(vsd)[row.names(res)[1:10],]
library(DEGreport)
res <- degPatterns(ma, design, time = "location")
Error in rep("one_group", nrow(metadata)) : invalid 'times' argument
Hi,
Trying to run degPatterns but run into an error I cannot solve. When running:
clusters<- degPatterns(cluster_rlog, metadata = meta, time = "Conc", col=NULL)
it throws the following error:
Working with 2832 genes.
Working with 2826 genes after filtering: minc > 15
Joining, by = "merge"
Error: Problem with summarise() input n_genes.
x could not find function "n"
ℹ Input n_genes is n().
ℹ The error occured in group 1: merge = "one_group0", cluster = 1, Conc = "0", colored = "one_group".
I had the same errors when trying to use the example data provided here: https://rdrr.io/bioc/DEGreport/man/degPatterns.html. So I guess there is an issue with the function itself?
Can someone help?
Thanks
degCovariates produces a graph and outlines significant results, but does not actually shade graph based on r correlation value. This is despite R values being non-zero. I tried replacing the NA values with 0 to see if that was interfering with the plotting ability, but this did not fix the issue. Not sure if this warning message is related.
> correlates <- degCovariates(vst, metrics_df)
running pca and calculating correlations for:
un-scaled  data in pca;
pve >= 5%;
kendall cor
Warning messages:
1: In type.convert.default(X[[i]], ...) :
  'as.is' should be specified by the caller; using TRUE
2: In type.convert.default(X[[i]], ...) :
  'as.is' should be specified by the caller; using TRUE
3: In type.convert.default(X[[i]], ...) :
  'as.is' should be specified by the caller; using TRUE
4: In type.convert.default(X[[i]], ...) :
  'as.is' should be specified by the caller; using TRUE

> correlates$corMatrix[order(correlates$corMatrix$r),]
   compare                      covar       pvalue          r        fdr effect_size type_variable
21     PC1                       Time 0.0011306473 -0.6735878 0.03165812  1.00000000   categorical
7      PC3                      Batch 0.0018552681 -0.6515838 0.03813398  1.00000000   categorical
26     PC2                 percent_gc 0.0054629850 -0.5968807 0.07648179  1.00000000       numeric
42     PC2            intergenic_rate 0.0022698796  0.6421053 0.03813398  0.01410000       numeric
82     PC2                    n_genes 0.0008772647  0.6842105 0.03165812  0.19056003       numeric
14     PC2            RNA_isol_method 0.0002945642  0.7254763 0.02474339  1.00000000   categorical
1      PC1                        ACV 0.2800257308         NA         NA  1.00000000   categorical
2      PC2                        ACV 0.3566465113         NA         NA  1.00000000   categorical
3      PC3                        ACV 0.4916879365         NA         NA  1.00000000   categorical
4      PC4                        ACV 0.5416311268         NA         NA  1.00000000   categorical
R version 4.3.1 (2023-06-16)
Platform: aarch64-apple-darwin20 (64-bit)
Running under: macOS Ventura 13.5.1

Matrix products: default
BLAS:   /System/Library/Frameworks/Accelerate.framework/Versions/A/Frameworks/vecLib.framework/Versions/A/libBLAS.dylib
LAPACK: /Library/Frameworks/R.framework/Versions/4.3-arm64/Resources/lib/libRlapack.dylib;  LAPACK version 3.11.0

locale:
[1] en_US.UTF-8/en_US.UTF-8/en_US.UTF-8/C/en_US.UTF-8/en_US.UTF-8

time zone: America/New_York
tzcode source: internal

attached base packages:
[1] stats4    stats     graphics  grDevices utils     datasets  methods   base

other attached packages:
 [1] RColorBrewer_1.1-3          pheatmap_1.0.12             ggrepel_0.9.3
 [4] DEGreport_1.36.0            DESeq2_1.40.2               knitr_1.43
 [7] lubridate_1.9.2             forcats_1.0.0               stringr_1.5.0
[10] dplyr_1.1.2                 purrr_1.0.1                 readr_2.1.4
[13] tidyr_1.3.0                 tibble_3.2.1                ggplot2_3.4.2
[16] tidyverse_2.0.0             SummarizedExperiment_1.30.2 Biobase_2.60.0
[19] GenomicRanges_1.52.0        GenomeInfoDb_1.36.1         IRanges_2.34.1
[22] S4Vectors_0.38.1            BiocGenerics_0.46.0         MatrixGenerics_1.12.2
[25] matrixStats_1.0.0

loaded via a namespace (and not attached):
 [1] mnormt_2.1.1                bitops_1.0-7                rlang_1.1.1
 [4] magrittr_2.0.3              clue_0.3-64                 GetoptLong_1.0.5
 [7] compiler_4.3.1              png_0.1-8                   vctrs_0.6.3
[10] pkgconfig_2.0.3             shape_1.4.6                 crayon_1.5.2
[13] fastmap_1.1.1               backports_1.4.1             XVector_0.40.0
[16] labeling_0.4.2              utf8_1.2.3                  rmarkdown_2.23
[19] tzdb_0.4.0                  xfun_0.39                   zlibbioc_1.46.0
[22] highr_0.10                  DelayedArray_0.26.6         reshape_0.8.9
[25] BiocParallel_1.34.2         psych_2.3.6                 broom_1.0.5
[28] parallel_4.3.1              cluster_2.1.4               R6_2.5.1
[31] stringi_1.7.12              limma_3.56.2                Rcpp_1.0.11
[34] iterators_1.0.14            Matrix_1.6-0                timechange_0.2.0
[37] tidyselect_1.2.0            rstudioapi_0.15.0           yaml_2.3.7
[40] doParallel_1.0.17           codetools_0.2-19            lattice_0.21-8
[43] plyr_1.8.8                  withr_2.5.0                 evaluate_0.21
[46] ConsensusClusterPlus_1.64.0 circlize_0.4.15             pillar_1.9.0
[49] DT_0.28                     foreach_1.5.2               generics_0.1.3
[52] RCurl_1.98-1.12             hms_1.1.3                   munsell_0.5.0
[55] scales_1.2.1                glue_1.6.2                  tools_4.3.1
[58] locfit_1.5-9.8              cowplot_1.1.1               grid_4.3.1
[61] edgeR_3.42.4                colorspace_2.1-0            nlme_3.1-162
[64] GenomeInfoDbData_1.2.10     cli_3.6.1                   fansi_1.0.4
[67] S4Arrays_1.0.4              ComplexHeatmap_2.16.0       ggdendro_0.1.23
[70] gtable_0.3.3                logging_0.10-108            digest_0.6.33
[73] rjson_0.2.21                htmlwidgets_1.6.2           farver_2.1.1
[76] htmltools_0.5.5             lifecycle_1.0.3             GlobalOptions_0.1.2
[79] MASS_7.3-60
Hello,
I used DegPatterns to cluster my genes which worked, but for upstream analysis I require the gene-gene distance matrix that was used to create these clusters. Is there any way to extract this matrix? Thanks!
Hi, while using the function degCovariates I found that the proportion of variance explained in the output plot is very different from what I get from summary(pca.res), where pca.res is the result from prcomp using default parameters.
Therefore I am wondering how is PCA done internally in the degCovariates function. Is it possible for me to get exact the same results from this function as prcomp?
Thanks
First my versions: OSX latest R version:
[1] dplyr_1.1.1 tibble_3.2.1 plyr_1.8.8
[4] cluster_2.1.4 edgeR_3.40.2 limma_3.54.2
[7] DEGreport_1.34.0 pheatmap_1.0.12 ggplot2_3.4.2
[10] DESeq2_1.38.3 SummarizedExperiment_1.28.0 Biobase_2.58.0
[13] MatrixGenerics_1.10.0 matrixStats_0.63.0 GenomicRanges_1.50.2
[16] GenomeInfoDb_1.34.9 IRanges_2.32.0 S4Vectors_0.36.2
[19] BiocGenerics_0.44.0
I do not see Time being set in the structure returned from degPatterns.
metadata: Exp Time (integer 0,1,2) Treat (levels WT KO with WT being default)
clusters_rlog_padj<- degPatterns(cluster_rlog_padj, metadata = metadata, time="Time", col="Treat", minc=0)
In clusters_rlog_padj I see time set in raw but in normalized. To get degPlotCluster(clusters_rlog_padj$normalized, time="Time", color="Treat",min_genes=0) to work I first have to run clusters_rlog_padj$normalized$Time<-clusters_rlog_padj$raw$Time
I see this with View in Rstudio of the returned clusters_rlog_padj. Without doing this, normalized>Time has Type factor with values Factor with 0 levels. "". Even though Time is not set up as a factor but an integer taking the values 0 1 or 2.
As an aside I also see normalized>merge to be 'WT0' 'WT0' 'WT0' .... Where as in raw, merged is 'KO0' 'KO0' 'KO0' ...
Is this correct, should normalized had raw have the same merge order since time in Raw seems to be correct independent
of merged.
OTHER INFO:
metadata is
Exp Time Treat
s1 0 WT
s2 0 WT
s3 0 WT
s4 1 WT
s5 1 WT
s6 1 WT
s7 2 WT
s8 2 WT
s9 2 WT
s10 0 KO
s11 0 KO
s12 0 KO
s13 1 KO
s14 1 KO
s15 1 KO
s16 2 KO
s17 2 KO
s18 2 KO
Model using is : reduced: Treat + Time
full. Treat + Time + Treat:Time
Let me know what else you need?
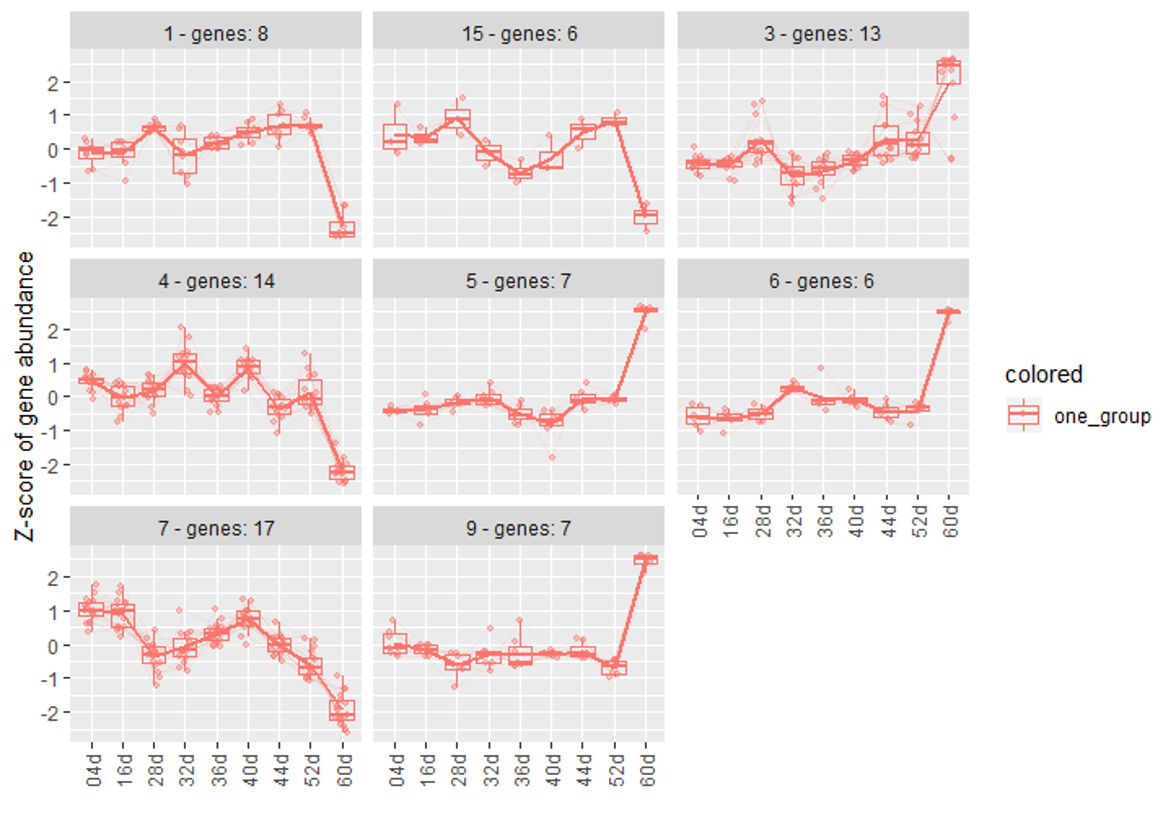
Hi, i'm using degPatterns to cluster some genes across different time points.
here is part of my code :
clusters <- degPatterns(log2(salld.norm), metadata = colData, time = "age", minc = 5, reduce = T, scale = T)
And here is my metaData :
| ID | age |
|---|---|
| 1 | 04d |
| 2 | 16d |
| 3 | 28d |
| 4 | 32d |
| 5 | 36d |
| 6 | 40d |
| 7 | 44d |
| 8 | 52d |
| 9 | 56d |
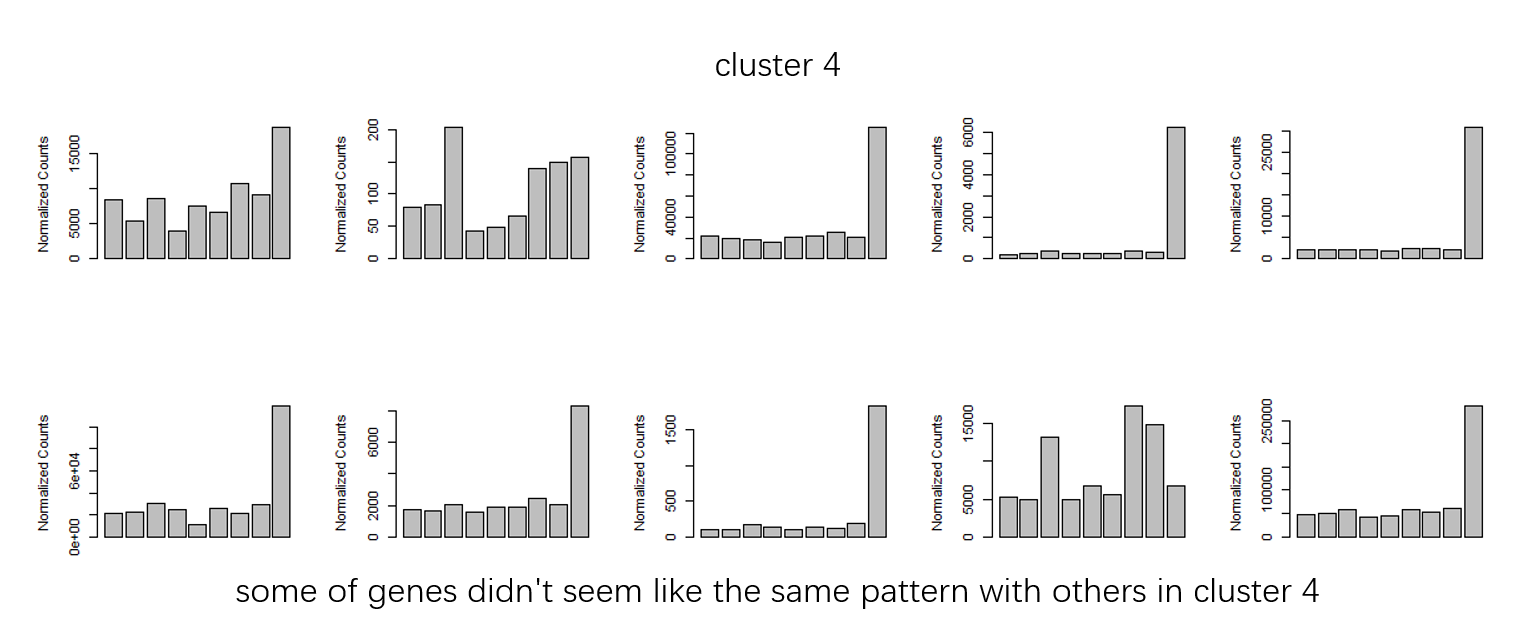
Figure 1
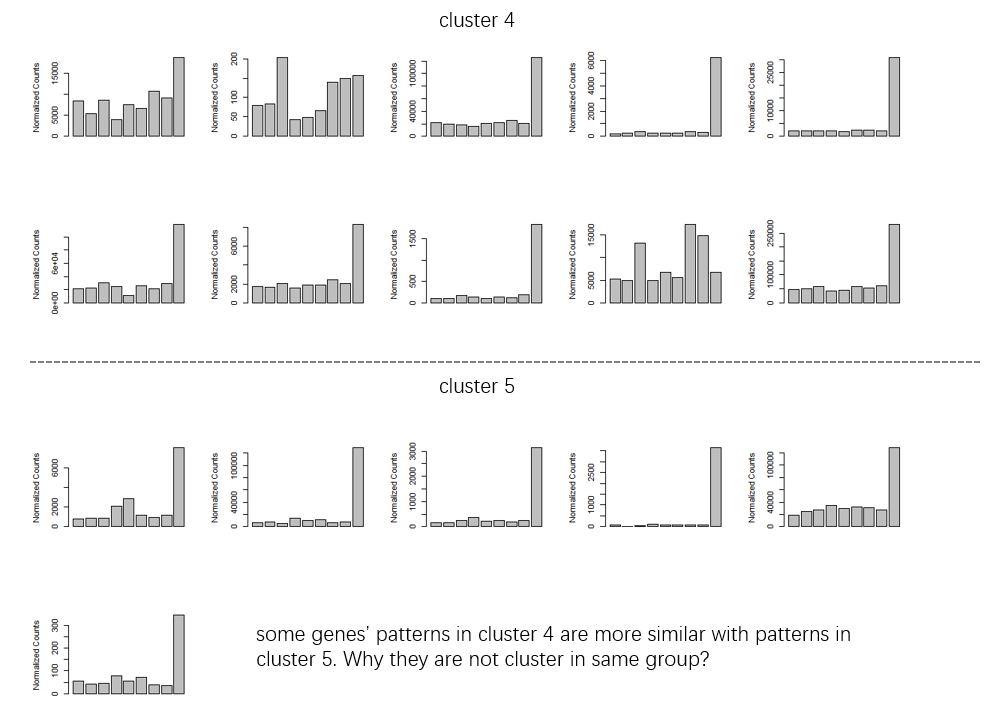
Figure 2
groupDifference to cluster more similar genes to one clutser. ( some of clusters seems very similar in my opinion. I don't know why they are divided into multiple clusters.)Figure 3
minc = 5 to get more return clusters and reduce = T to remove some outliers in clusters. I also use scale = T. Because i just care about the change pattern not the exact count. But i'm also curious that if scale = T is necessary. The kendall test is based on the data rank, right? So what's the influence of scale = T ? Is my understanding of the above parameters correct? I also noticed that there may be some ridiculous outlier if not using the reduce = T. How could these genes cluster with those 'consensus/common' genes?Hi there,
I am using degPatterns() from DEGreport package to do the gene clustering analysis but encounter an error message below:
Large number of genes given. Please,make sure is not an error. NormallyOnly DE genes are useful for this function
.
Error in lower.to.upper.tri.inds(n) : 'n' must be >= 2
Calls: degPatterns -> .make_clusters -> diana -> lower.to.upper.tri.inds
Execution halted
Many thanks,
Tom
Dear DEGreport developers,
Thanks for developing this very helpful tool.
I have a question regarding the DEGpattern function.
In the figure below, it seems like you can sub-divided the group 1 cluster to two groups, one is up-down and the other is down-down from 24hr to 120hr in POS group.
But I am not sure, how should I do it, any suggestions would be appreciated!

Thanks!
and here is my code to generate the figure
degPatterns(ma[genes,],group.table,time = "time",col = "group",scale = T)
Hi there,
Firstly, thanks for developing this wonderful tool to visualize trends.
I'm wondering if the function can re-position the boxplot in the same line(the blue line in the graph) instead of in the two wings of blue line.

Thanks for the help!
Chunhui
Hi Lorena
I noticed that DEGplot() orders the top N genes alphabetically.
I was wondering if there's an argument I can call upon to order the gene plots of N (e.g. top 20) according to the degree of variation it has instead of alphabetical order of the gene names
Hi,
I tried to use degPatterns with consensusCluster = TRUE, cannot get a result but end fraction message. Does anyone know how to fix it?
Thanks!
As per user request:
I am trying to use the DEGreport package to plot timecourse data using degpattern. I get really good patterns, please see attached(file attached: Summary_clusters_Group). However I would like the clusters headers to be called Group instead of numbers, like in your manuscript (file attached: Example) and I cannot figure out how to do it.
Changing this line to add a prefix option should make it:
Line 96 in 8242716
And avoid plot if no covariate significant.
Hi! I am following the workflow to use degCovariates() with a DESeqDataSet object and, when I write:
degCovariates(counts = counts(dds), metadata = as.data.frame(colData(dds)),
                     fdr = 0.1, scale = FALSE, minPC = 5,
                     correlation = "kendall", addCovDen = TRUE, legacy = TRUE,
                     smart = TRUE, method = "lm", plot = TRUE)
I obtained this error:
running pca and calculating correlations for:
un-scaled  data in pca;
pve >= 5%;
kendall cor
Error in is.data.frame(x) :
  (list) object cannot be coerced to type 'double'
Any ideas what could have gone wrong?
Thank you very much in advance!
Avoid asking for extra information. PCA should be able to plot only with count matrix
When I run the following code, my x-axis only shows one group instead of the 7 "times" values(stations in my case).
res <- degPatterns(df, metadata = colData(dds), time = "station", minc = 1)
degPlotCluster(res$normalized, "station", lines=FALSE, min_genes = 1)
It runs fine for another column with a different condition of 3 groups (x-axis), however, when trying coldata station column (numbers 1-7) it plots the following.

Do you spot anything I might be missing in the code?
df = data.matrix with all selected DEG
coldata = includes a column of station numbers 1-7 for each of the samples
A declarative, efficient, and flexible JavaScript library for building user interfaces.
🖖 Vue.js is a progressive, incrementally-adoptable JavaScript framework for building UI on the web.
TypeScript is a superset of JavaScript that compiles to clean JavaScript output.
An Open Source Machine Learning Framework for Everyone
The Web framework for perfectionists with deadlines.
A PHP framework for web artisans
Bring data to life with SVG, Canvas and HTML. 📊📈🎉
JavaScript (JS) is a lightweight interpreted programming language with first-class functions.
Some thing interesting about web. New door for the world.
A server is a program made to process requests and deliver data to clients.
Machine learning is a way of modeling and interpreting data that allows a piece of software to respond intelligently.
Some thing interesting about visualization, use data art
Some thing interesting about game, make everyone happy.
We are working to build community through open source technology. NB: members must have two-factor auth.
Open source projects and samples from Microsoft.
Google ❤️ Open Source for everyone.
Alibaba Open Source for everyone
Data-Driven Documents codes.
China tencent open source team.