Git Product home page Git Product logo

rliable's Introduction

Open In Colab Website Blog

rliable is an open-source Python library for reliable evaluation, even with a handful of runs, on reinforcement learning and machine learnings benchmarks.

Desideratum Current evaluation approach Our Recommendation
Uncertainty in aggregate performance Point estimates:
  • Ignore statistical uncertainty
  • Hinder results reproducibility
Interval estimates using stratified bootstrap confidence intervals (CIs)
Performance variability across tasks and runs Tables with task mean scores:
  • Overwhelming beyond a few tasks
  • Standard deviations frequently omitted
  • Incomplete picture for multimodal and heavy-tailed distributions
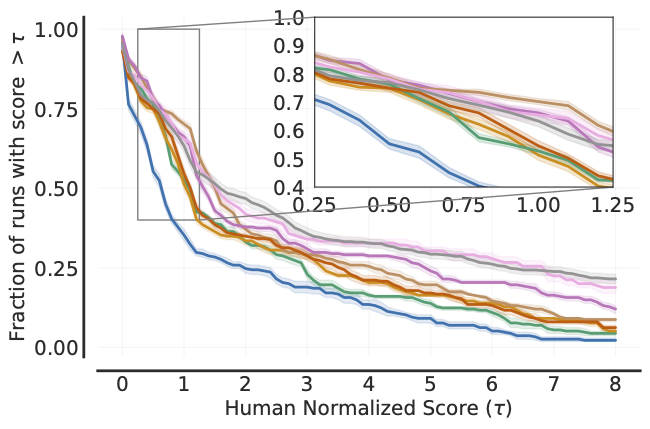
Score distributions (performance profiles):
  • Show tail distribution of scores on combined runs across tasks
  • Allow qualitative comparisons
  • Easily read any score percentile
Aggregate metrics for summarizing benchmark performance Mean:
  • Often dominated by performance on outlier tasks
  Median:
  • Statistically inefficient (requires a large number of runs to claim improvements)
  • Poor indicator of overall performance: 0 scores on nearly half the tasks doesn't change it
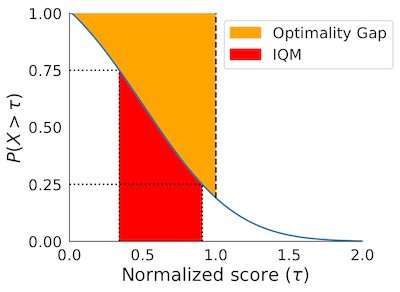
Interquartile Mean (IQM) across all runs:
  • Performance on middle 50% of combined runs
  • Robust to outlier scores but more statistically efficient than median
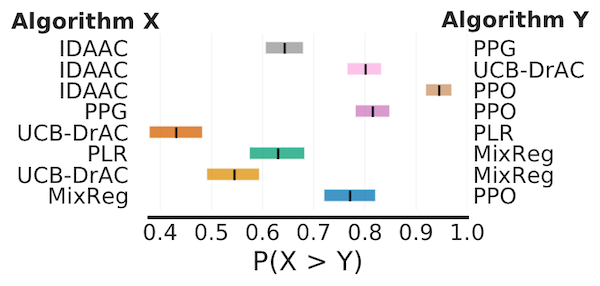
To show other aspects of performance gains, report Probability of improvement and Optimality gap

rliable provides support for:

  • Stratified Bootstrap Confidence Intervals (CIs)
  • Performance Profiles (with plotting functions)
  • Aggregate metrics
    • Interquartile Mean (IQM) across all runs
    • Optimality Gap
    • Probability of Improvement

Interactive colab

We provide a colab at bit.ly/statistical_precipice_colab, which shows how to use the library with examples of published algorithms on widely used benchmarks including Atari 100k, ALE, DM Control and Procgen.

Data for individual runs on Atari 100k, ALE, DM Control and Procgen

You can access the data for individual runs using the public GCP bucket here (you might need to sign in with your gmail account to use Gcloud) : https://console.cloud.google.com/storage/browser/rl-benchmark-data. The interactive colab above also allows you to access the data programatically.

Paper

For more details, refer to the accompanying NeurIPS 2021 paper (Outstanding Paper Award): Deep Reinforcement Learning at the Edge of the Statistical Precipice.

Installation

To install rliable, run:

pip install -U rliable

To install latest version of rliable as a package, run:

pip install git+https://github.com/google-research/rliable

To import rliable, we suggest:

from rliable import library as rly
from rliable import metrics
from rliable import plot_utils

Aggregate metrics with 95% Stratified Bootstrap CIs

IQM, Optimality Gap, Median, Mean
algorithms = ['DQN (Nature)', 'DQN (Adam)', 'C51', 'REM', 'Rainbow',
              'IQN', 'M-IQN', 'DreamerV2']
# Load ALE scores as a dictionary mapping algorithms to their human normalized
# score matrices, each of which is of size `(num_runs x num_games)`.
atari_200m_normalized_score_dict = ...
aggregate_func = lambda x: np.array([
  metrics.aggregate_median(x),
  metrics.aggregate_iqm(x),
  metrics.aggregate_mean(x),
  metrics.aggregate_optimality_gap(x)])
aggregate_scores, aggregate_score_cis = rly.get_interval_estimates(
  atari_200m_normalized_score_dict, aggregate_func, reps=50000)
fig, axes = plot_utils.plot_interval_estimates(
  aggregate_scores, aggregate_score_cis,
  metric_names=['Median', 'IQM', 'Mean', 'Optimality Gap'],
  algorithms=algorithms, xlabel='Human Normalized Score')
Probability of Improvement
# Load ProcGen scores as a dictionary containing pairs of normalized score
# matrices for pairs of algorithms we want to compare
procgen_algorithm_pairs = {.. , 'x,y': (score_x, score_y), ..}
average_probabilities, average_prob_cis = rly.get_interval_estimates(
  procgen_algorithm_pairs, metrics.probability_of_improvement, reps=2000)
plot_utils.plot_probability_of_improvement(average_probabilities, average_prob_cis)

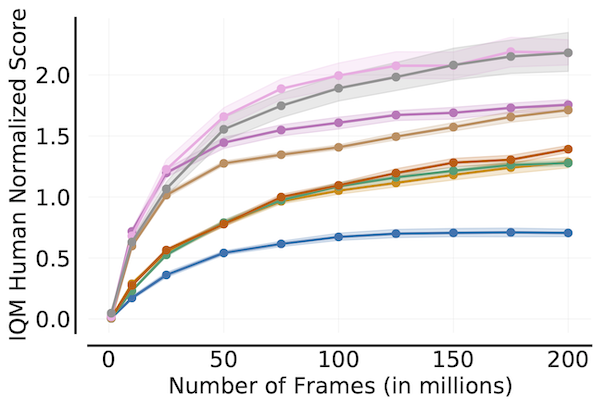
Sample Efficiency Curve

algorithms = ['DQN (Nature)', 'DQN (Adam)', 'C51', 'REM', 'Rainbow',
              'IQN', 'M-IQN', 'DreamerV2']
# Load ALE scores as a dictionary mapping algorithms to their human normalized
# score matrices across all 200 million frames, each of which is of size
# `(num_runs x num_games x 200)` where scores are recorded every million frame.
ale_all_frames_scores_dict = ...
frames = np.array([1, 10, 25, 50, 75, 100, 125, 150, 175, 200]) - 1
ale_frames_scores_dict = {algorithm: score[:, :, frames] for algorithm, score
                          in ale_all_frames_scores_dict.items()}
iqm = lambda scores: np.array([metrics.aggregate_iqm(scores[..., frame])
                               for frame in range(scores.shape[-1])])
iqm_scores, iqm_cis = rly.get_interval_estimates(
  ale_frames_scores_dict, iqm, reps=50000)
plot_utils.plot_sample_efficiency_curve(
    frames+1, iqm_scores, iqm_cis, algorithms=algorithms,
    xlabel=r'Number of Frames (in millions)',
    ylabel='IQM Human Normalized Score')

Performance Profiles

# Load ALE scores as a dictionary mapping algorithms to their human normalized
# score matrices, each of which is of size `(num_runs x num_games)`.
atari_200m_normalized_score_dict = ...
# Human normalized score thresholds
atari_200m_thresholds = np.linspace(0.0, 8.0, 81)
score_distributions, score_distributions_cis = rly.create_performance_profile(
    atari_200m_normalized_score_dict, atari_200m_thresholds)
# Plot score distributions
fig, ax = plt.subplots(ncols=1, figsize=(7, 5))
plot_utils.plot_performance_profiles(
  score_distributions, atari_200m_thresholds,
  performance_profile_cis=score_distributions_cis,
  colors=dict(zip(algorithms, sns.color_palette('colorblind'))),
  xlabel=r'Human Normalized Score $(\tau)$',
  ax=ax)

The above profile can also be plotted with non-linear scaling as follows:

plot_utils.plot_performance_profiles(
  perf_prof_atari_200m, atari_200m_tau,
  performance_profile_cis=perf_prof_atari_200m_cis,
  use_non_linear_scaling=True,
  xticks = [0.0, 0.5, 1.0, 2.0, 4.0, 8.0]
  colors=dict(zip(algorithms, sns.color_palette('colorblind'))),
  xlabel=r'Human Normalized Score $(\tau)$',
  ax=ax)

Dependencies

The code was tested under Python>=3.7 and uses these packages:

  • arch == 5.3.0
  • scipy >= 1.7.0
  • numpy >= 0.9.0
  • absl-py >= 1.16.4
  • seaborn >= 0.11.2

Citing

If you find this open source release useful, please reference in your paper:

@article{agarwal2021deep,
  title={Deep Reinforcement Learning at the Edge of the Statistical Precipice},
  author={Agarwal, Rishabh and Schwarzer, Max and Castro, Pablo Samuel
          and Courville, Aaron and Bellemare, Marc G},
  journal={Advances in Neural Information Processing Systems},
  year={2021}
}

Disclaimer: This is not an official Google product.

rliable's People

Contributors

agarwl avatar araffin avatar dennissoemers avatar jjshoots avatar lkevinzc avatar mischapanch avatar qgallouedec avatar sebimarkgraf avatar

Stargazers

 avatar  avatar  avatar  avatar  avatar  avatar  avatar  avatar  avatar  avatar  avatar  avatar  avatar  avatar  avatar  avatar  avatar  avatar  avatar  avatar  avatar  avatar  avatar  avatar  avatar  avatar  avatar  avatar  avatar  avatar  avatar  avatar  avatar  avatar  avatar  avatar  avatar  avatar  avatar  avatar  avatar  avatar  avatar  avatar  avatar  avatar  avatar  avatar  avatar  avatar  avatar  avatar  avatar  avatar  avatar  avatar  avatar  avatar  avatar  avatar  avatar  avatar  avatar  avatar  avatar  avatar  avatar  avatar  avatar  avatar  avatar  avatar  avatar  avatar  avatar  avatar  avatar  avatar  avatar  avatar  avatar  avatar  avatar  avatar  avatar  avatar  avatar  avatar  avatar  avatar  avatar  avatar  avatar  avatar  avatar  avatar  avatar  avatar  avatar  avatar

Watchers

 avatar  avatar  avatar  avatar  avatar  avatar  avatar  avatar  avatar  avatar  avatar

rliable's Issues

Installation fails on MacBook Pro with M1 chip

The installation fails on my MacBook Pro with M1 chip.

I also tried on a MacBook Pro with an Intel chip (and the same OS version) and on a Linux system: the installation was successful on both configurations.

$ cd rliable
$ pip install -e .
Obtaining file:///Users/quentingallouedec/rliable
  Preparing metadata (setup.py) ... done
Collecting arch==5.0.1
  Using cached arch-5.0.1.tar.gz (937 kB)
  Installing build dependencies ... error
  error: subprocess-exited-with-error

... # Log too long for GitHub issue

error: subprocess-exited-with-error

× pip subprocess to install build dependencies did not run successfully.
│ exit code: 1
╰─> See above for output.

note: This error originates from a subprocess, and is likely not a problem with pip.

System info

  • Python version: 3.9
  • System Version: macOS 12.4 (21F79)
  • Kernel Version: Darwin 21.5.0

What I've tried

Install only arch 5.0.1

It seems to be related with the installation of arch. I've tried to pip install arch==5.0.1 and it also failed with the same logs.

Install the last version of arch

I've tried to pip install arch (current version: 5.2.0), and it worked.

Use rliable with the last version of arch

Since I can install arch==5.2.0, I've tried to make rliable work with arch 5.2.0 (by modifying manually setup.py). Pytest failed. Here is the logs for one of the failing unitest:

_____________________________________________ LibraryTest.test_stratified_bootstrap_runs_and_tasks _____________________________________________

self = <library_test.LibraryTest testMethod=test_stratified_bootstrap_runs_and_tasks>, task_bootstrap = True

    @parameterized.named_parameters(
        dict(testcase_name="runs_only", task_bootstrap=False),
        dict(testcase_name="runs_and_tasks", task_bootstrap=True))
    def test_stratified_bootstrap(self, task_bootstrap):
      """Tests StratifiedBootstrap."""
      bs = rly.StratifiedBootstrap(
          self._x, y=self._y, z=self._z, task_bootstrap=task_bootstrap)
>     for data, kwdata in bs.bootstrap(5):

tests/rliable/library_test.py:40: 
_ _ _ _ _ _ _ _ _ _ _ _ _ _ _ _ _ _ _ _ _ _ _ _ _ _ _ _ _ _ _ _ _ _ _ _ _ _ _ _ _ _ _ _ _ _ _ _ _ _ _ _ _ _ _ _ _ _ _ _ _ _ _ _ _ _ _ _ _ _ _ _ 
env/lib/python3.9/site-packages/arch/bootstrap/base.py:694: in bootstrap
    yield self._resample()
_ _ _ _ _ _ _ _ _ _ _ _ _ _ _ _ _ _ _ _ _ _ _ _ _ _ _ _ _ _ _ _ _ _ _ _ _ _ _ _ _ _ _ _ _ _ _ _ _ _ _ _ _ _ _ _ _ _ _ _ _ _ _ _ _ _ _ _ _ _ _ _ 

self = Stratified Bootstrap(no. pos. inputs: 1, no. keyword inputs: 2, ID: 0x15b353a00)

    def _resample(self) -> Tuple[Tuple[ArrayLike, ...], Dict[str, ArrayLike]]:
        """
        Resample all data using the values in _index
        """
        indices = self._index
>       assert isinstance(indices, np.ndarray)
E       AssertionError

env/lib/python3.9/site-packages/arch/bootstrap/base.py:1294: AssertionError
_______________________________________________ LibraryTest.test_stratified_bootstrap_runs_only ________________________________________________

self = <library_test.LibraryTest testMethod=test_stratified_bootstrap_runs_only>, task_bootstrap = False

    @parameterized.named_parameters(
        dict(testcase_name="runs_only", task_bootstrap=False),
        dict(testcase_name="runs_and_tasks", task_bootstrap=True))
    def test_stratified_bootstrap(self, task_bootstrap):
      """Tests StratifiedBootstrap."""
      bs = rly.StratifiedBootstrap(
          self._x, y=self._y, z=self._z, task_bootstrap=task_bootstrap)
>     for data, kwdata in bs.bootstrap(5):

tests/rliable/library_test.py:40: 
_ _ _ _ _ _ _ _ _ _ _ _ _ _ _ _ _ _ _ _ _ _ _ _ _ _ _ _ _ _ _ _ _ _ _ _ _ _ _ _ _ _ _ _ _ _ _ _ _ _ _ _ _ _ _ _ _ _ _ _ _ _ _ _ _ _ _ _ _ _ _ _ 
env/lib/python3.9/site-packages/arch/bootstrap/base.py:694: in bootstrap
    yield self._resample()
_ _ _ _ _ _ _ _ _ _ _ _ _ _ _ _ _ _ _ _ _ _ _ _ _ _ _ _ _ _ _ _ _ _ _ _ _ _ _ _ _ _ _ _ _ _ _ _ _ _ _ _ _ _ _ _ _ _ _ _ _ _ _ _ _ _ _ _ _ _ _ _ 

self = Stratified Bootstrap(no. pos. inputs: 1, no. keyword inputs: 2, ID: 0x15b2ff1f0)

    def _resample(self) -> Tuple[Tuple[ArrayLike, ...], Dict[str, ArrayLike]]:
        """
        Resample all data using the values in _index
        """
        indices = self._index
>       assert isinstance(indices, np.ndarray)
E       AssertionError

env/lib/python3.9/site-packages/arch/bootstrap/base.py:1294: AssertionError

It seems like there are breaking changes between arch 5.0.1 and arch 5.2.0.
Maybe this issue can be solved by updating this dependency to it's current version.

bootstrapped ci (shows no variance) vs std (shows high variance)

Hey folks!

I frequently follow rliable's guidelines to plot sample efficiency curves. I came across results now where 5 seeds of one experiment had large variance, but the bootstrapped confidence interval suggests little to no variance. Here are two plots to visualize my issue:

comparison(1)

The number of bootstrap replications is set to 50000.
Here is a colab notebook to reproduce these plots:
https://colab.research.google.com/drive/1hFtmCX-TLUcPuDKZZlTPq34R7bDz_NWI?usp=sharing

It would be great to hear your intuitions about this. Do you think this is just a coincidence or a bug?

edit:

  • Lowering the reps to 3000 did not affect the plot
  • Reshaping from 750 episodes, 101 checkpoints to 5 runs, 150 episodes, 101 checkpoints did not affect the plot

Urgent question about data aggregates

Hi, we compiled the Atari 100k results from DrQ, CURL, and DER, and the mean/median human-norm scores are well below those reported in prior works, including from co-authors of the rliable paper.

We have median human-norm scores all around 0.10 - 0.12.

Is this accurate? Of all of these, DER (the oldest of the algs) has the highest mean human-norm score.

typos in README

Amazing work! Already using it for a project. Found a couple of typos. In the below part of the README median should be aggregate_median and plot_aggregate_metrics should be plot_interval_estimates`.

algorithms = ['DQN (Nature)', 'DQN (Adam)', 'C51', 'REM', 'Rainbow',
              'IQN', 'M-IQN', 'DreamerV2']
# Load ALE scores as a dictionary mapping algorithms to their human normalized
# score matrices, each of which is of size `(num_runs x num_games)`.
atari_200m_normalized_score_dict = ...
aggregate_func = lambda x: np.array([
  metrics.median(x),
  metrics.aggregate_iqm(x),
  metrics.aggregate_mean(x),
  metrics.aggregate_optimality_gap(x)])
aggregate_scores, aggregate_score_cis = rly.get_interval_estimates(
  atari_200m_normalized_score_dict, aggregate_func, reps=50000)
fig, axes = plot_utils.plot_aggregate_metrics(
  aggregate_scores, aggregate_score_cis,
  metric_names=['Median', 'IQM', 'Mean', 'Optimality Gap'],
  algorithms=algorithms, xlabel='Human Normalized Score')

Post-processing about the data derived from stable-baselines

Hi!

I have trained the same environment with stable-baselines multiple times with different seeds and got some monitor.csv or .tfevent files. How could I plot the median curve with the standard deviation indicated by the shaded area with rliable? I found the length of the data is not the same in different monitor.csv files. Is it possible?

I browsed through a series of issues in stable-baseline and zoo and eventually tracked them down here.

Thanks in advance!

Package issue:

The package structure is messed up when attempting to install the code from the GitHub repo using "pip install -e ." In particular the problem is that the package name is "rliable" but "rliable" is not a folder in the repo. To fix this you need to create a folder and move all the python files inside it i.e.

[1] Create a folder called rliable

[2] Then move all the *.py files inside this folder. Below is the what the new folder structure would look like.

CITATION.bib
CONTRIBUTING.md
images/
LICENSE
README.md
setup.py
rliable/
- metrics.py
- library.py
- test
- init.py

Making this change allows me to be able to run "from rliable import library" successfully.

Downloading data set always stuck

Thanks for sharing the repo.
There is a problem that every time I download the dataset, it is always stuck somewhere at 9X%
Do you know what might cause this?

...
Copying gs://rl-benchmark-data/atari_100k/SimPLe.json...
Copying gs://rl-benchmark-data/atari_100k/OTRainbow.json...
[55/59 files][  2.9 MiB/  3.0 MiB]  98% Done

Question about documentation in probability_of_improvement

Hi, I wonder if the documentation in probability_of_improvement function in metrics.py is wrong?
Specifically,

scores_x: A matrix of size (num_runs_x x num_tasks) where scores_x[m][n] represent the score on run n of task m for algorithm X.

scores_x: A matrix of size (`num_runs_x` x `num_tasks`) where scores_x[m][n]
)

Should scores_x[n][m] be the score on run n of task m for algorithm X?

Thanks.

Add support for loading data from pandas dataframe

Right now, we only support loading data from numpy arrays. It would be nice if there was a helper function to convert a dataframe of scores to numpy arrays. Some initial code to help what this might look like:

def get_all_return_values(df):
  games = list(df['game'].unique())
  return_vals = {}
  for game in games:
    game_df = df[df['game'] == game]
    arr = game_df.groupby('wid')['normalized_score'].apply(list).values
    return_vals[game] = np.stack(arr, axis=0)
  return return_vals

def convert_to_matrix(x):
  return np.stack([x[k] for k in sorted(x.keys())], axis=1)

## Usage
# Array of shape (num_runs, num_games, num_steps)`
all_normalized_scores = convert_to_matrix(get_all_return_values(score_df))

The above code assumes we have a pandas Dataframe with keys run_number, 'gameandnormalized_score` containing scores for all steps (in a ordered manner).

RAD results may be incorrect.

Hi @agarwl. I found that the 'step' in RAD's 'eval.log' refers to the policy step. But the 'step' in 'xxx--eval_scores.npy' refers to the environment step. We know that 'environment step = policy step * action_repreat'.

Here comes a problem: if you use the results of 100k steps in 'eval.log', then you actually evaluate the scores at 100k*action_repeat steps. This will lead to the overestimation of RAD. And I wonder whether you do such incorrect evaluations, or you take the results in 'xxx--eval_scores.npy', which are correct in terms of 'steps'. You may refer to a similar question in MishaLaskin/rad#15.

I reproduced the results of RAD locally, and I found my results are much worse than the reported ones (in your paper). I list them in the following figure.
QQ20211223-153829

I compare the means of each task. Obviously, there is a huge gap, and my results are close to the ones reported by DrQ authors (see the Table in MishaLaskin/rad#1). I guess you may evaluate scores at incorrect environment steps? So, could you please offer more details when evaluating RAD? Thanks :)

Bump arch version and release to pypi

Hi rliable team, thanks for the repo!

I ran into installation issues that are fixed by bumping arch, see #23 .

Could you merge the PR and make a new release to pypi? The last release has been several years ago.

Recommend Projects

  • React photo React

    A declarative, efficient, and flexible JavaScript library for building user interfaces.

  • Vue.js photo Vue.js

    🖖 Vue.js is a progressive, incrementally-adoptable JavaScript framework for building UI on the web.

  • Typescript photo Typescript

    TypeScript is a superset of JavaScript that compiles to clean JavaScript output.

  • TensorFlow photo TensorFlow

    An Open Source Machine Learning Framework for Everyone

  • Django photo Django

    The Web framework for perfectionists with deadlines.

  • D3 photo D3

    Bring data to life with SVG, Canvas and HTML. 📊📈🎉

Recommend Topics

  • javascript

    JavaScript (JS) is a lightweight interpreted programming language with first-class functions.

  • web

    Some thing interesting about web. New door for the world.

  • server

    A server is a program made to process requests and deliver data to clients.

  • Machine learning

    Machine learning is a way of modeling and interpreting data that allows a piece of software to respond intelligently.

  • Game

    Some thing interesting about game, make everyone happy.

Recommend Org

  • Facebook photo Facebook

    We are working to build community through open source technology. NB: members must have two-factor auth.

  • Microsoft photo Microsoft

    Open source projects and samples from Microsoft.

  • Google photo Google

    Google ❤️ Open Source for everyone.

  • D3 photo D3

    Data-Driven Documents codes.