Git Product home page Git Product logo

nvitop's Introduction

nvitop

Python 3.7+ PyPI conda-forge Documentation Status Downloads GitHub Repo Stars License

An interactive NVIDIA-GPU process viewer and beyond, the one-stop solution for GPU process management. The full API references host at https://nvitop.readthedocs.io.

Monitor
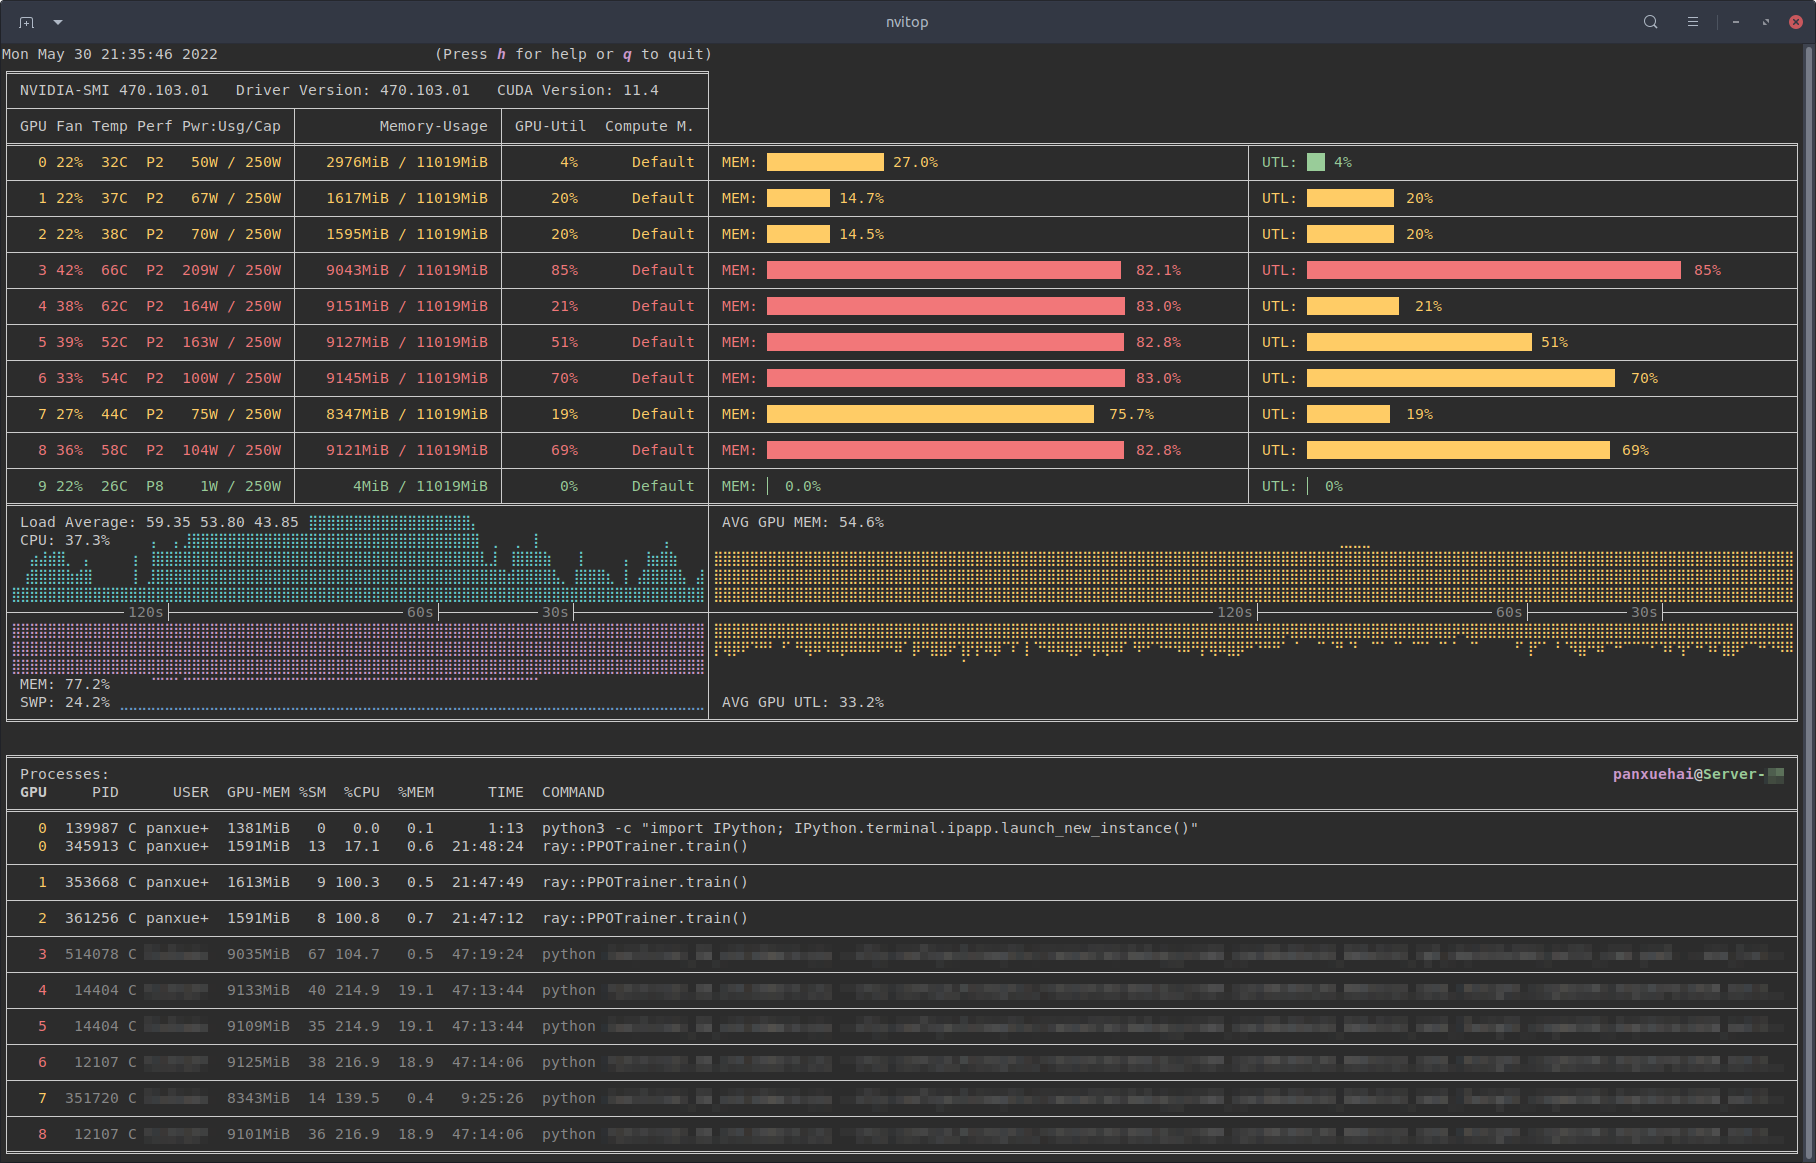
Monitor mode of nvitop.
(TERM: GNOME Terminal / OS: Ubuntu 16.04 LTS (over SSH) / Locale: en_US.UTF-8)

Table of Contents


nvitop is an interactive NVIDIA device and process monitoring tool. It has a colorful and informative interface that continuously updates the status of the devices and processes. As a resource monitor, it includes many features and options, such as tree-view, environment variable viewing, process filtering, process metrics monitoring, etc. Beyond that, the package also ships a CUDA device selection tool nvisel for deep learning researchers. It also provides handy APIs that allow developers to write their own monitoring tools. Please refer to section More than a Monitor and the full API references at https://nvitop.readthedocs.io for more information.

Filter
Process filtering and a more colorful interface.

Comparison
Compare to nvidia-smi.


Features

  • Informative and fancy output: show more information than nvidia-smi with colorized fancy box drawing.
  • Monitor mode: can run as a resource monitor, rather than print the results only once.
    • bar charts and history graphs
    • process sorting
    • process filtering
    • send signals to processes with a keystroke
    • tree-view screen for GPU processes and their parent processes
    • environment variable screen
    • help screen
    • mouse support
  • Interactive: responsive for user input (from keyboard and/or mouse) in monitor mode. (vs. gpustat & py3nvml)
  • Efficient:
    • query device status using NVML Python bindings directly, instead of parsing the output of nvidia-smi. (vs. nvidia-htop)
    • support sparse query and cache results with TTLCache from cachetools. (vs. gpustat)
    • display information using the curses library rather than print with ANSI escape codes. (vs. py3nvml)
    • asynchronously gather information using multi-threading and correspond to user input much faster. (vs. nvtop)
  • Portable: work on both Linux and Windows.
    • get host process information using the cross-platform library psutil instead of calling ps -p <pid> in a subprocess. (vs. nvidia-htop & py3nvml)
    • written in pure Python, easy to install with pip. (vs. nvtop)
  • Integrable: easy to integrate into other applications, more than monitoring. (vs. nvidia-htop & nvtop)

Windows
nvitop supports Windows!
(SHELL: PowerShell / TERM: Windows Terminal / OS: Windows 10 / Locale: en-US)


Requirements

  • Python 3.7+
  • NVIDIA Management Library (NVML)
  • nvidia-ml-py
  • psutil
  • cachetools
  • termcolor
  • curses* (with libncursesw)

NOTE: The NVIDIA Management Library (NVML) is a C-based programmatic interface for monitoring and managing various states. The runtime version of the NVML library ships with the NVIDIA display driver (available at Download Drivers | NVIDIA), or can be downloaded as part of the NVIDIA CUDA Toolkit (available at CUDA Toolkit | NVIDIA Developer). The lists of OS platforms and NVIDIA-GPUs supported by the NVML library can be found in the NVML API Reference.

This repository contains a Bash script to install/upgrade the NVIDIA drivers for Ubuntu Linux. For example:

git clone --depth=1 https://github.com/XuehaiPan/nvitop.git && cd nvitop

# Change to tty3 console (required for desktop users with GUI (tty2))
# Optional for SSH users
sudo chvt 3  # or use keyboard shortcut: Ctrl-LeftAlt-F3

bash install-nvidia-driver.sh --package=nvidia-driver-470  # install the R470 driver from ppa:graphics-drivers
bash install-nvidia-driver.sh --latest                     # install the latest driver from ppa:graphics-drivers

install-nvidia-driver
NVIDIA driver installer for Ubuntu Linux.

Run bash install-nvidia-driver.sh --help for more information.

* The curses library is a built-in module of Python on Unix-like systems, and it is supported by a third-party package called windows-curses on Windows using PDCurses. Inconsistent behavior of nvitop may occur on different terminal emulators on Windows, such as missing mouse support.


Installation

It is highly recommended to install nvitop in an isolated virtual environment. Simple installation and run via pipx:

pipx run nvitop

Install from PyPI (PyPI):

pip3 install --upgrade nvitop

Install from conda-forge (conda-forge):

conda install -c conda-forge nvitop

Install the latest version from GitHub (Commit Count):

pip3 install --upgrade pip setuptools
pip3 install git+https://github.com/XuehaiPan/nvitop.git#egg=nvitop

Or, clone this repo and install manually:

git clone --depth=1 https://github.com/XuehaiPan/nvitop.git
cd nvitop
pip3 install .

NOTE: If you encounter the "nvitop: command not found" error after installation, please check whether you have added the Python console script path (e.g., "${HOME}/.local/bin") to your PATH environment variable. Alternatively, you can use python3 -m nvitop.

MIG Device Support
MIG Device Support.


Usage

Device and Process Status

Query the device and process status. The output is similar to nvidia-smi, but has been enriched and colorized.

# Query the status of all devices
$ nvitop -1  # or use `python3 -m nvitop -1`

# Specify query devices (by integer indices)
$ nvitop -1 -o 0 1  # only show <GPU 0> and <GPU 1>

# Only show devices in `CUDA_VISIBLE_DEVICES` (by integer indices or UUID strings)
$ nvitop -1 -ov

# Only show GPU processes with the compute context (type: 'C' or 'C+G')
$ nvitop -1 -c

When the -1 switch is on, the result will be displayed ONLY ONCE (same as the default behavior of nvidia-smi). This is much faster and has lower resource usage. See Command Line Options for more command options.

There is also a CLI tool called nvisel that ships with the nvitop PyPI package. See CUDA Visible Devices Selection Tool for more information.

Resource Monitor

Run as a resource monitor:

# Monitor mode (when the display mode is omitted, `NVITOP_MONITOR_MODE` will be used)
$ nvitop  # or use `python3 -m nvitop`

# Automatically configure the display mode according to the terminal size
$ nvitop -m auto     # shortcut: `a` key

# Arbitrarily display as `full` mode
$ nvitop -m full     # shortcut: `f` key

# Arbitrarily display as `compact` mode
$ nvitop -m compact  # shortcut: `c` key

# Specify query devices (by integer indices)
$ nvitop -o 0 1  # only show <GPU 0> and <GPU 1>

# Only show devices in `CUDA_VISIBLE_DEVICES` (by integer indices or UUID strings)
$ nvitop -ov

# Only show GPU processes with the compute context (type: 'C' or 'C+G')
$ nvitop -c

# Use ASCII characters only
$ nvitop -U  # useful for terminals without Unicode support

# For light terminals
$ nvitop --light

# For spectrum-like bar charts (requires the terminal supports 256-color)
$ nvitop --colorful

You can configure the default monitor mode with the NVITOP_MONITOR_MODE environment variable (default auto if not set). See Command Line Options and Environment Variables for more command options.

In monitor mode, you can use Ctrl-c / T / K keys to interrupt / terminate / kill a process. And it's recommended to terminate or kill a process in the tree-view screen (shortcut: t). For normal users, nvitop will shallow other users' processes (in low-intensity colors). For system administrators, you can use sudo nvitop to terminate other users' processes.

Also, to enter the process metrics screen, select a process and then press the Enter / Return key . nvitop dynamically displays the process metrics with live graphs.

Process Metrics Screen
Watch metrics for a specific process (shortcut: Enter / Return).

Press h for help or q to return to the terminal. See Keybindings for Monitor Mode for more shortcuts.

Help Screen
nvitop comes with a help screen (shortcut: h).

For Docker Users

Build and run the Docker image using nvidia-docker:

git clone --depth=1 https://github.com/XuehaiPan/nvitop.git && cd nvitop  # clone this repo first
docker build --tag nvitop:latest .  # build the Docker image
docker run -it --rm --runtime=nvidia --gpus=all --pid=host nvitop:latest  # run the Docker container

The Dockerfile has an optional build argument basetag (default: 450-signed-ubuntu22.04) for the tag of image nvcr.io/nvidia/driver.

NOTE: Don't forget to add the --pid=host option when running the container.

For SSH Users

Run nvitop directly on the SSH session instead of a login shell:

ssh user@host -t nvitop                 # installed by `sudo pip3 install ...`
ssh user@host -t '~/.local/bin/nvitop'  # installed by `pip3 install --user ...`

NOTE: Users need to add the -t option to allocate a pseudo-terminal over the SSH session for monitor mode.

Command Line Options and Environment Variables

Type nvitop --help for more command options:

usage: nvitop [--help] [--version] [--once | --monitor [{auto,full,compact}]]
              [--interval SEC] [--ascii] [--colorful] [--force-color] [--light]
              [--gpu-util-thresh th1 th2] [--mem-util-thresh th1 th2]
              [--only idx [idx ...]] [--only-visible]
              [--compute] [--only-compute] [--graphics] [--only-graphics]
              [--user [USERNAME ...]] [--pid PID [PID ...]]

An interactive NVIDIA-GPU process viewer.

options:
  --help, -h            Show this help message and exit.
  --version, -V         Show nvitop's version number and exit.
  --once, -1            Report query data only once.
  --monitor [{auto,full,compact}], -m [{auto,full,compact}]
                        Run as a resource monitor. Continuously report query data and handle user inputs.
                        If the argument is omitted, the value from `NVITOP_MONITOR_MODE` will be used.
                        (default fallback mode: auto)
  --interval SEC        Process status update interval in seconds. (default: 2)
  --ascii, --no-unicode, -U
                        Use ASCII characters only, which is useful for terminals without Unicode support.

coloring:
  --colorful            Use gradient colors to get spectrum-like bar charts. This option is only available
                        when the terminal supports 256 colors. You may need to set environment variable
                        `TERM="xterm-256color"`. Note that the terminal multiplexer, such as `tmux`, may
                        override the `TREM` variable.
  --force-color         Force colorize even when `stdout` is not a TTY terminal.
  --light               Tweak visual results for light theme terminals in monitor mode.
                        Set variable `NVITOP_MONITOR_MODE="light"` on light terminals for convenience.
  --gpu-util-thresh th1 th2
                        Thresholds of GPU utilization to determine the load intensity.
                        Coloring rules: light < th1 % <= moderate < th2 % <= heavy.
                        ( 1 <= th1 < th2 <= 99, defaults: 10 75 )
  --mem-util-thresh th1 th2
                        Thresholds of GPU memory percent to determine the load intensity.
                        Coloring rules: light < th1 % <= moderate < th2 % <= heavy.
                        ( 1 <= th1 < th2 <= 99, defaults: 10 80 )

device filtering:
  --only idx [idx ...], -o idx [idx ...]
                        Only show the specified devices, suppress option `--only-visible`.
  --only-visible, -ov   Only show devices in the `CUDA_VISIBLE_DEVICES` environment variable.

process filtering:
  --compute, -c         Only show GPU processes with the compute context. (type: 'C' or 'C+G')
  --only-compute, -C    Only show GPU processes exactly with the compute context. (type: 'C' only)
  --graphics, -g        Only show GPU processes with the graphics context. (type: 'G' or 'C+G')
  --only-graphics, -G   Only show GPU processes exactly with the graphics context. (type: 'G' only)
  --user [USERNAME ...], -u [USERNAME ...]
                        Only show processes of the given users (or `$USER` for no argument).
  --pid PID [PID ...], -p PID [PID ...]
                        Only show processes of the given PIDs.

nvitop can accept the following environment variables for monitor mode:

Name Description Valid Values Default Value
NVITOP_MONITOR_MODE The default display mode (a comma-separated string) auto / full / compact
plain / colorful
dark / light
auto,plain,dark
NVITOP_GPU_UTILIZATION_THRESHOLDS Thresholds of GPU utilization 10,75 , 1,99, ... 10,75
NVITOP_MEMORY_UTILIZATION_THRESHOLDS Thresholds of GPU memory percent 10,80 , 1,99, ... 10,80
LOGLEVEL Log level for log messages DEBUG , INFO, WARNING, ... WARNING

For example:

# Replace the following export statements if you are not using Bash / Zsh
export NVITOP_MONITOR_MODE="full,light"

# Full monitor mode with light terminal tweaks
nvitop

For convenience, you can add these environment variables to your shell startup file, e.g.:

# For Bash
echo 'export NVITOP_MONITOR_MODE="full"' >> ~/.bashrc

# For Zsh
echo 'export NVITOP_MONITOR_MODE="full"' >> ~/.zshrc

# For Fish
echo 'set -gx NVITOP_MONITOR_MODE "full"' >> ~/.config/fish/config.fish

# For PowerShell
'$Env:NVITOP_MONITOR_MODE = "full"' >> $PROFILE.CurrentUserAllHosts

Keybindings for Monitor Mode

Key Binding
q Quit and return to the terminal.
h / ? Go to the help screen.
a / f / c Change the display mode to auto / full / compact.
r / <C-r> / <F5> Force refresh the window.
<Up> / <Down>
<A-k> / <A-j>
<Tab> / <S-Tab>
<Wheel>
Select and highlight a process.
<Left> / <Right>
<A-h> / <A-l>
<S-Wheel>
Scroll the host information of processes.
<Home> Select the first process.
<End> Select the last process.
<C-a>
^
Scroll left to the beginning of the process entry (i.e. beginning of line).
<C-e>
$
Scroll right to the end of the process entry (i.e. end of line).
<PageUp> / <PageDown>
<A-K> / <A-J>
[ / ]
scroll entire screen (for large amounts of processes).
<Space> Tag/untag current process.
<Esc> Clear process selection.
<C-c>
I
Send signal.SIGINT to the selected process (interrupt).
T Send signal.SIGTERM to the selected process (terminate).
K Send signal.SIGKILL to the selected process (kill).
e Show process environment.
t Toggle tree-view screen.
<Enter> Show process metrics.
, / . Select the sort column.
/ Reverse the sort order.
on (oN) Sort processes in the natural order, i.e., in ascending (descending) order of GPU.
ou (oU) Sort processes by USER in ascending (descending) order.
op (oP) Sort processes by PID in descending (ascending) order.
og (oG) Sort processes by GPU-MEM in descending (ascending) order.
os (oS) Sort processes by %SM in descending (ascending) order.
oc (oC) Sort processes by %CPU in descending (ascending) order.
om (oM) Sort processes by %MEM in descending (ascending) order.
ot (oT) Sort processes by TIME in descending (ascending) order.

HINT: It's recommended to terminate or kill a process in the tree-view screen (shortcut: t).


CUDA Visible Devices Selection Tool

Automatically select CUDA_VISIBLE_DEVICES from the given criteria. Example usage of the CLI tool:

# All devices but sorted
$ nvisel       # or use `python3 -m nvitop.select`
6,5,4,3,2,1,0,7,8

# A simple example to select 4 devices
$ nvisel -n 4  # or use `python3 -m nvitop.select -n 4`
6,5,4,3

# Select available devices that satisfy the given constraints
$ nvisel --min-count 2 --max-count 3 --min-free-memory 5GiB --max-gpu-utilization 60
6,5,4

# Set `CUDA_VISIBLE_DEVICES` environment variable using `nvisel`
$ export CUDA_DEVICE_ORDER="PCI_BUS_ID" CUDA_VISIBLE_DEVICES="$(nvisel -c 1 -f 10GiB)"
CUDA_VISIBLE_DEVICES="6,5,4,3,2,1,0"

# Use UUID strings in `CUDA_VISIBLE_DEVICES` environment variable
$ export CUDA_VISIBLE_DEVICES="$(nvisel -O uuid -c 2 -f 5000M)"
CUDA_VISIBLE_DEVICES="GPU-849d5a8d-610e-eeea-1fd4-81ff44a23794,GPU-18ef14e9-dec6-1d7e-1284-3010c6ce98b1,GPU-96de99c9-d68f-84c8-424c-7c75e59cc0a0,GPU-2428d171-8684-5b64-830c-435cd972ec4a,GPU-6d2a57c9-7783-44bb-9f53-13f36282830a,GPU-f8e5a624-2c7e-417c-e647-b764d26d4733,GPU-f9ca790e-683e-3d56-00ba-8f654e977e02"

# Pipe output to other shell utilities
$ nvisel --newline -O uuid -C 6 -f 8GiB
GPU-849d5a8d-610e-eeea-1fd4-81ff44a23794
GPU-18ef14e9-dec6-1d7e-1284-3010c6ce98b1
GPU-96de99c9-d68f-84c8-424c-7c75e59cc0a0
GPU-2428d171-8684-5b64-830c-435cd972ec4a
GPU-6d2a57c9-7783-44bb-9f53-13f36282830a
GPU-f8e5a624-2c7e-417c-e647-b764d26d4733
$ nvisel -0 -O uuid -c 2 -f 4GiB | xargs -0 -I {} nvidia-smi --id={} --query-gpu=index,memory.free --format=csv
CUDA_VISIBLE_DEVICES="GPU-849d5a8d-610e-eeea-1fd4-81ff44a23794,GPU-18ef14e9-dec6-1d7e-1284-3010c6ce98b1,GPU-96de99c9-d68f-84c8-424c-7c75e59cc0a0,GPU-2428d171-8684-5b64-830c-435cd972ec4a,GPU-6d2a57c9-7783-44bb-9f53-13f36282830a,GPU-f8e5a624-2c7e-417c-e647-b764d26d4733,GPU-f9ca790e-683e-3d56-00ba-8f654e977e02"
index, memory.free [MiB]
6, 11018 MiB
index, memory.free [MiB]
5, 11018 MiB
index, memory.free [MiB]
4, 11018 MiB
index, memory.free [MiB]
3, 11018 MiB
index, memory.free [MiB]
2, 11018 MiB
index, memory.free [MiB]
1, 11018 MiB
index, memory.free [MiB]
0, 11018 MiB

# Normalize the `CUDA_VISIBLE_DEVICES` environment variable (e.g. convert UUIDs to indices or get full UUIDs for an abbreviated form)
$ nvisel -i "GPU-18ef14e9,GPU-849d5a8d" -S
5,6
$ nvisel -i "GPU-18ef14e9,GPU-849d5a8d" -S -O uuid --newline
GPU-18ef14e9-dec6-1d7e-1284-3010c6ce98b1
GPU-849d5a8d-610e-eeea-1fd4-81ff44a23794

You can also integrate nvisel into your training script like this:

# Put this at the top of the Python script
import os
from nvitop import select_devices

os.environ['CUDA_VISIBLE_DEVICES'] = ','.join(
    select_devices(format='uuid', min_count=4, min_free_memory='8GiB')
)

Type nvisel --help for more command options:

usage: nvisel [--help] [--version]
              [--inherit [CUDA_VISIBLE_DEVICES]] [--account-as-free [USERNAME ...]]
              [--min-count N] [--max-count N] [--count N]
              [--min-free-memory SIZE] [--min-total-memory SIZE]
              [--max-gpu-utilization RATE] [--max-memory-utilization RATE]
              [--tolerance TOL]
              [--format FORMAT] [--sep SEP | --newline | --null] [--no-sort]

CUDA visible devices selection tool.

options:
  --help, -h            Show this help message and exit.
  --version, -V         Show nvisel's version number and exit.

constraints:
  --inherit [CUDA_VISIBLE_DEVICES], -i [CUDA_VISIBLE_DEVICES]
                        Inherit the given `CUDA_VISIBLE_DEVICES`. If the argument is omitted, use the
                        value from the environment. This means selecting a subset of the currently
                        CUDA-visible devices.
  --account-as-free [USERNAME ...]
                        Account the used GPU memory of the given users as free memory.
                        If this option is specified but without argument, `$USER` will be used.
  --min-count N, -c N   Minimum number of devices to select. (default: 0)
                        The tool will fail (exit non-zero) if the requested resource is not available.
  --max-count N, -C N   Maximum number of devices to select. (default: all devices)
  --count N, -n N       Overriding both `--min-count N` and `--max-count N`.
  --min-free-memory SIZE, -f SIZE
                        Minimum free memory of devices to select. (example value: 4GiB)
                        If this constraint is given, check against all devices.
  --min-total-memory SIZE, -t SIZE
                        Minimum total memory of devices to select. (example value: 10GiB)
                        If this constraint is given, check against all devices.
  --max-gpu-utilization RATE, -G RATE
                        Maximum GPU utilization rate of devices to select. (example value: 30)
                        If this constraint is given, check against all devices.
  --max-memory-utilization RATE, -M RATE
                        Maximum memory bandwidth utilization rate of devices to select. (example value: 50)
                        If this constraint is given, check against all devices.
  --tolerance TOL, --tol TOL
                        The constraints tolerance (in percentage). (default: 0, i.e., strict)
                        This option can loose the constraints if the requested resource is not available.
                        For example, set `--tolerance=20` will accept a device with only 4GiB of free
                        memory when set `--min-free-memory=5GiB`.

formatting:
  --format FORMAT, -O FORMAT
                        The output format of the selected device identifiers. (default: index)
                        If any MIG device found, the output format will be fallback to `uuid`.
  --sep SEP, --separator SEP, -s SEP
                        Separator for the output. (default: ',')
  --newline             Use newline character as separator for the output, equivalent to `--sep=$'\n'`.
  --null, -0            Use null character ('\x00') as separator for the output. This option corresponds
                        to the `-0` option of `xargs`.
  --no-sort, -S         Do not sort the device by memory usage and GPU utilization.

Callback Functions for Machine Learning Frameworks

nvitop provides two builtin callbacks for TensorFlow (Keras) and PyTorch Lightning.

Callback for TensorFlow (Keras)

from tensorflow.python.keras.utils.multi_gpu_utils import multi_gpu_model
from tensorflow.python.keras.callbacks import TensorBoard
from nvitop.callbacks.keras import GpuStatsLogger
gpus = ['/gpu:0', '/gpu:1']  # or `gpus = [0, 1]` or `gpus = 2`
model = Xception(weights=None, ..)
model = multi_gpu_model(model, gpus)  # optional
model.compile(..)
tb_callback = TensorBoard(log_dir='./logs')  # or `keras.callbacks.CSVLogger`
gpu_stats = GpuStatsLogger(gpus)
model.fit(.., callbacks=[gpu_stats, tb_callback])

NOTE: Users should assign a keras.callbacks.TensorBoard callback or a keras.callbacks.CSVLogger callback to the model. And the GpuStatsLogger callback should be placed before the keras.callbacks.TensorBoard / keras.callbacks.CSVLogger callback.

Callback for PyTorch Lightning

from lightning.pytorch import Trainer
from nvitop.callbacks.lightning import GpuStatsLogger
gpu_stats = GpuStatsLogger()
trainer = Trainer(gpus=[..], logger=True, callbacks=[gpu_stats])

NOTE: Users should assign a logger to the trainer.

TensorBoard Integration

Please refer to Resource Metric Collector for an example.


More than a Monitor

nvitop can be easily integrated into other applications. You can use nvitop to make your own monitoring tools. The full API references host at https://nvitop.readthedocs.io.

Quick Start

A minimal script to monitor the GPU devices based on APIs from nvitop:

from nvitop import Device

devices = Device.all()  # or `Device.cuda.all()` to use CUDA ordinal instead
for device in devices:
    processes = device.processes()  # type: Dict[int, GpuProcess]
    sorted_pids = sorted(processes.keys())

    print(device)
    print(f'  - Fan speed:       {device.fan_speed()}%')
    print(f'  - Temperature:     {device.temperature()}C')
    print(f'  - GPU utilization: {device.gpu_utilization()}%')
    print(f'  - Total memory:    {device.memory_total_human()}')
    print(f'  - Used memory:     {device.memory_used_human()}')
    print(f'  - Free memory:     {device.memory_free_human()}')
    print(f'  - Processes ({len(processes)}): {sorted_pids}')
    for pid in sorted_pids:
        print(f'    - {processes[pid]}')
    print('-' * 120)

Another more advanced approach with coloring:

import time

from nvitop import Device, GpuProcess, NA, colored

print(colored(time.strftime('%a %b %d %H:%M:%S %Y'), color='red', attrs=('bold',)))

devices = Device.cuda.all()  # or `Device.all()` to use NVML ordinal instead
separator = False
for device in devices:
    processes = device.processes()  # type: Dict[int, GpuProcess]

    print(colored(str(device), color='green', attrs=('bold',)))
    print(colored('  - Fan speed:       ', color='blue', attrs=('bold',)) + f'{device.fan_speed()}%')
    print(colored('  - Temperature:     ', color='blue', attrs=('bold',)) + f'{device.temperature()}C')
    print(colored('  - GPU utilization: ', color='blue', attrs=('bold',)) + f'{device.gpu_utilization()}%')
    print(colored('  - Total memory:    ', color='blue', attrs=('bold',)) + f'{device.memory_total_human()}')
    print(colored('  - Used memory:     ', color='blue', attrs=('bold',)) + f'{device.memory_used_human()}')
    print(colored('  - Free memory:     ', color='blue', attrs=('bold',)) + f'{device.memory_free_human()}')
    if len(processes) > 0:
        processes = GpuProcess.take_snapshots(processes.values(), failsafe=True)
        processes.sort(key=lambda process: (process.username, process.pid))

        print(colored(f'  - Processes ({len(processes)}):', color='blue', attrs=('bold',)))
        fmt = '    {pid:<5}  {username:<8} {cpu:>5}  {host_memory:>8} {time:>8}  {gpu_memory:>8}  {sm:>3}  {command:<}'.format
        print(colored(fmt(pid='PID', username='USERNAME',
                          cpu='CPU%', host_memory='HOST-MEM', time='TIME',
                          gpu_memory='GPU-MEM', sm='SM%',
                          command='COMMAND'),
                      attrs=('bold',)))
        for snapshot in processes:
            print(fmt(pid=snapshot.pid,
                      username=snapshot.username[:7] + ('+' if len(snapshot.username) > 8 else snapshot.username[7:8]),
                      cpu=snapshot.cpu_percent, host_memory=snapshot.host_memory_human,
                      time=snapshot.running_time_human,
                      gpu_memory=(snapshot.gpu_memory_human if snapshot.gpu_memory_human is not NA else 'WDDM:N/A'),
                      sm=snapshot.gpu_sm_utilization,
                      command=snapshot.command))
    else:
        print(colored('  - No Running Processes', attrs=('bold',)))

    if separator:
        print('-' * 120)
    separator = True

Demo
An example monitoring script built with APIs from nvitop.


Status Snapshot

nvitop provides a helper function take_snapshots to retrieve the status of both GPU devices and GPU processes at once. You can type help(nvitop.take_snapshots) in Python REPL for detailed documentation.

In [1]: from nvitop import take_snapshots, Device
   ...: import os
   ...: os.environ['CUDA_DEVICE_ORDER'] = 'PCI_BUS_ID'
   ...: os.environ['CUDA_VISIBLE_DEVICES'] = '1,0'  # comma-separated integers or UUID strings

In [2]: take_snapshots()  # equivalent to `take_snapshots(Device.all())`
Out[2]:
SnapshotResult(
    devices=[
        DeviceSnapshot(
            real=Device(index=0, ...),
            ...
        ),
        ...
    ],
    gpu_processes=[
        GpuProcessSnapshot(
            real=GpuProcess(pid=xxxxxx, device=Device(index=0, ...), ...),
            ...
        ),
        ...
    ]
)

In [3]: device_snapshots, gpu_process_snapshots = take_snapshots(Device.all())  # type: Tuple[List[DeviceSnapshot], List[GpuProcessSnapshot]]

In [4]: device_snapshots, _ = take_snapshots(gpu_processes=False)  # ignore process snapshots

In [5]: take_snapshots(Device.cuda.all())  # use CUDA device enumeration
Out[5]:
SnapshotResult(
    devices=[
        CudaDeviceSnapshot(
            real=CudaDevice(cuda_index=0, nvml_index=1, ...),
            ...
        ),
        CudaDeviceSnapshot(
            real=CudaDevice(cuda_index=1, nvml_index=0, ...),
            ...
        ),
    ],
    gpu_processes=[
        GpuProcessSnapshot(
            real=GpuProcess(pid=xxxxxx, device=CudaDevice(cuda_index=0, ...), ...),
            ...
        ),
        ...
    ]
)

In [6]: take_snapshots(Device.cuda(1))  # <CUDA 1> only
Out[6]:
SnapshotResult(
    devices=[
        CudaDeviceSnapshot(
            real=CudaDevice(cuda_index=1, nvml_index=0, ...),
            ...
        )
    ],
    gpu_processes=[
        GpuProcessSnapshot(
            real=GpuProcess(pid=xxxxxx, device=CudaDevice(cuda_index=1, ...), ...),
            ...
        ),
        ...
    ]
)

Please refer to section Low-level APIs for more information.


Resource Metric Collector

ResourceMetricCollector is a class that collects resource metrics for host, GPUs and processes running on the GPUs. All metrics will be collected in an asynchronous manner. You can type help(nvitop.ResourceMetricCollector) in Python REPL for detailed documentation.

In [1]: from nvitop import ResourceMetricCollector, Device
   ...: import os
   ...: os.environ['CUDA_DEVICE_ORDER'] = 'PCI_BUS_ID'
   ...: os.environ['CUDA_VISIBLE_DEVICES'] = '3,2,1,0'  # comma-separated integers or UUID strings

In [2]: collector = ResourceMetricCollector()                                   # log all devices and descendant processes of the current process on the GPUs
In [3]: collector = ResourceMetricCollector(root_pids={1})                      # log all devices and all GPU processes
In [4]: collector = ResourceMetricCollector(devices=Device(0), root_pids={1})   # log <GPU 0> and all GPU processes on <GPU 0>
In [5]: collector = ResourceMetricCollector(devices=Device.cuda.all())          # use the CUDA ordinal

In [6]: with collector(tag='<tag>'):
   ...:     # Do something
   ...:     collector.collect()  # -> Dict[str, float]
# key -> '<tag>/<scope>/<metric (unit)>/<mean/min/max>'
{
    '<tag>/host/cpu_percent (%)/mean': 8.967849777683456,
    '<tag>/host/cpu_percent (%)/min': 6.1,
    '<tag>/host/cpu_percent (%)/max': 28.1,
    ...,
    '<tag>/host/memory_percent (%)/mean': 21.5,
    '<tag>/host/swap_percent (%)/mean': 0.3,
    '<tag>/host/memory_used (GiB)/mean': 91.0136418208109,
    '<tag>/host/load_average (%) (1 min)/mean': 10.251427386878328,
    '<tag>/host/load_average (%) (5 min)/mean': 10.072539414569503,
    '<tag>/host/load_average (%) (15 min)/mean': 11.91126970422139,
    ...,
    '<tag>/cuda:0 (gpu:3)/memory_used (MiB)/mean': 3.875,
    '<tag>/cuda:0 (gpu:3)/memory_free (MiB)/mean': 11015.562499999998,
    '<tag>/cuda:0 (gpu:3)/memory_total (MiB)/mean': 11019.437500000002,
    '<tag>/cuda:0 (gpu:3)/memory_percent (%)/mean': 0.0,
    '<tag>/cuda:0 (gpu:3)/gpu_utilization (%)/mean': 0.0,
    '<tag>/cuda:0 (gpu:3)/memory_utilization (%)/mean': 0.0,
    '<tag>/cuda:0 (gpu:3)/fan_speed (%)/mean': 22.0,
    '<tag>/cuda:0 (gpu:3)/temperature (C)/mean': 25.0,
    '<tag>/cuda:0 (gpu:3)/power_usage (W)/mean': 19.11166264116916,
    ...,
    '<tag>/cuda:1 (gpu:2)/memory_used (MiB)/mean': 8878.875,
    ...,
    '<tag>/cuda:2 (gpu:1)/memory_used (MiB)/mean': 8182.875,
    ...,
    '<tag>/cuda:3 (gpu:0)/memory_used (MiB)/mean': 9286.875,
    ...,
    '<tag>/pid:12345/host/cpu_percent (%)/mean': 151.34342772112265,
    '<tag>/pid:12345/host/host_memory (MiB)/mean': 44749.72373447514,
    '<tag>/pid:12345/host/host_memory_percent (%)/mean': 8.675082352111717,
    '<tag>/pid:12345/host/running_time (min)': 336.23803206741576,
    '<tag>/pid:12345/cuda:1 (gpu:4)/gpu_memory (MiB)/mean': 8861.0,
    '<tag>/pid:12345/cuda:1 (gpu:4)/gpu_memory_percent (%)/mean': 80.4,
    '<tag>/pid:12345/cuda:1 (gpu:4)/gpu_memory_utilization (%)/mean': 6.711118172407917,
    '<tag>/pid:12345/cuda:1 (gpu:4)/gpu_sm_utilization (%)/mean': 48.23283397736476,
    ...,
    '<tag>/duration (s)': 7.247399162035435,
    '<tag>/timestamp': 1655909466.9981883
}

The results can be easily logged into TensorBoard or a CSV file. For example:

import os

import torch
import torch.nn as nn
import torch.nn.functional as F
from torch.utils.tensorboard import SummaryWriter

from nvitop import CudaDevice, ResourceMetricCollector
from nvitop.callbacks.tensorboard import add_scalar_dict

# Build networks and prepare datasets
...

# Logger and status collector
writer = SummaryWriter()
collector = ResourceMetricCollector(devices=CudaDevice.all(),  # log all visible CUDA devices and use the CUDA ordinal
                                    root_pids={os.getpid()},   # only log the descendant processes of the current process
                                    interval=1.0)              # snapshot interval for background daemon thread

# Start training
global_step = 0
for epoch in range(num_epoch):
    with collector(tag='train'):
        for batch in train_dataset:
            with collector(tag='batch'):
                metrics = train(net, batch)
                global_step += 1
                add_scalar_dict(writer, 'train', metrics, global_step=global_step)
                add_scalar_dict(writer, 'resources',      # tag='resources/train/batch/...'
                                collector.collect(),
                                global_step=global_step)

        add_scalar_dict(writer, 'resources',              # tag='resources/train/...'
                        collector.collect(),
                        global_step=epoch)

    with collector(tag='validate'):
        metrics = validate(net, validation_dataset)
        add_scalar_dict(writer, 'validate', metrics, global_step=epoch)
        add_scalar_dict(writer, 'resources',              # tag='resources/validate/...'
                        collector.collect(),
                        global_step=epoch)

Another example for logging into a CSV file:

import datetime
import time

import pandas as pd

from nvitop import ResourceMetricCollector

collector = ResourceMetricCollector(root_pids={1}, interval=2.0)  # log all devices and all GPU processes
df = pd.DataFrame()

with collector(tag='resources'):
    for _ in range(60):
        # Do something
        time.sleep(60)

        metrics = collector.collect()
        df_metrics = pd.DataFrame.from_records(metrics, index=[len(df)])
        df = pd.concat([df, df_metrics], ignore_index=True)
        # Flush to CSV file ...

df.insert(0, 'time', df['resources/timestamp'].map(datetime.datetime.fromtimestamp))
df.to_csv('results.csv', index=False)

You can also daemonize the collector in the background using collect_in_background or ResourceMetricCollector.daemonize with callback functions.

from nvitop import Device, ResourceMetricCollector, collect_in_background

logger = ...

def on_collect(metrics):  # will be called periodically
    if logger.is_closed():  # closed manually by user
        return False
    logger.log(metrics)
    return True

def on_stop(collector):  # will be called only once at stop
    if not logger.is_closed():
        logger.close()  # cleanup

# Record metrics to the logger in the background every 5 seconds.
# It will collect 5-second mean/min/max for each metric.
collect_in_background(
    on_collect,
    ResourceMetricCollector(Device.cuda.all()),
    interval=5.0,
    on_stop=on_stop,
)

or simply:

ResourceMetricCollector(Device.cuda.all()).daemonize(
    on_collect,
    interval=5.0,
    on_stop=on_stop,
)

Low-level APIs

The full API references can be found at https://nvitop.readthedocs.io.

Device

The device module provides:

Device([index, uuid, bus_id])

Live class of the GPU devices, different from the device snapshots.

PhysicalDevice([index, uuid, bus_id])

Class for physical devices.

MigDevice([index, uuid, bus_id])

Class for MIG devices.

CudaDevice([cuda_index, nvml_index, uuid])

Class for devices enumerated over the CUDA ordinal.

CudaMigDevice([cuda_index, nvml_index, uuid])

Class for CUDA devices that are MIG devices.

parse_cuda_visible_devices([...])

Parse the given CUDA_VISIBLE_DEVICES value into a list of NVML device indices.

normalize_cuda_visible_devices([...])

Parse the given CUDA_VISIBLE_DEVICES value and convert it into a comma-separated string of UUIDs.

In [1]: from nvitop import (
   ...:     host,
   ...:     Device, PhysicalDevice, CudaDevice,
   ...:     parse_cuda_visible_devices, normalize_cuda_visible_devices
   ...:     HostProcess, GpuProcess,
   ...:     NA,
   ...: )
   ...: import os
   ...: os.environ['CUDA_DEVICE_ORDER'] = 'PCI_BUS_ID'
   ...: os.environ['CUDA_VISIBLE_DEVICES'] = '9,8,7,6'  # comma-separated integers or UUID strings

In [2]: Device.driver_version()
Out[2]: '525.60.11'

In [3]: Device.cuda_driver_version()  # the maximum CUDA version supported by the driver (can be different from the CUDA Runtime version)
Out[3]: '12.0'

In [4]: Device.cuda_runtime_version()  # the CUDA Runtime version
Out[4]: '11.8'

In [5]: Device.count()
Out[5]: 10

In [6]: CudaDevice.count()  # or `Device.cuda.count()`
Out[6]: 4

In [7]: all_devices      = Device.all()                 # all devices on board (physical device)
   ...: nvidia0, nvidia1 = Device.from_indices([0, 1])  # from physical device indices
   ...: all_devices
Out[7]: [
    PhysicalDevice(index=0, name="GeForce RTX 2080 Ti", total_memory=11019MiB),
    PhysicalDevice(index=1, name="GeForce RTX 2080 Ti", total_memory=11019MiB),
    PhysicalDevice(index=2, name="GeForce RTX 2080 Ti", total_memory=11019MiB),
    PhysicalDevice(index=3, name="GeForce RTX 2080 Ti", total_memory=11019MiB),
    PhysicalDevice(index=4, name="GeForce RTX 2080 Ti", total_memory=11019MiB),
    PhysicalDevice(index=5, name="GeForce RTX 2080 Ti", total_memory=11019MiB),
    PhysicalDevice(index=6, name="GeForce RTX 2080 Ti", total_memory=11019MiB),
    PhysicalDevice(index=7, name="GeForce RTX 2080 Ti", total_memory=11019MiB),
    PhysicalDevice(index=8, name="GeForce RTX 2080 Ti", total_memory=11019MiB),
    PhysicalDevice(index=9, name="GeForce RTX 2080 Ti", total_memory=11019MiB)
]

In [8]: # NOTE: The function results might be different between calls when the `CUDA_VISIBLE_DEVICES` environment variable has been modified
   ...: cuda_visible_devices = Device.from_cuda_visible_devices()  # from the `CUDA_VISIBLE_DEVICES` environment variable
   ...: cuda0, cuda1         = Device.from_cuda_indices([0, 1])    # from CUDA device indices (might be different from physical device indices if `CUDA_VISIBLE_DEVICES` is set)
   ...: cuda_visible_devices = CudaDevice.all()                    # shortcut to `Device.from_cuda_visible_devices()`
   ...: cuda_visible_devices = Device.cuda.all()                   # `Device.cuda` is aliased to `CudaDevice`
   ...: cuda_visible_devices
Out[8]: [
    CudaDevice(cuda_index=0, nvml_index=9, name="NVIDIA GeForce RTX 2080 Ti", total_memory=11019MiB),
    CudaDevice(cuda_index=1, nvml_index=8, name="NVIDIA GeForce RTX 2080 Ti", total_memory=11019MiB),
    CudaDevice(cuda_index=2, nvml_index=7, name="NVIDIA GeForce RTX 2080 Ti", total_memory=11019MiB),
    CudaDevice(cuda_index=3, nvml_index=6, name="NVIDIA GeForce RTX 2080 Ti", total_memory=11019MiB)
]

In [9]: nvidia0 = Device(0)  # from device index (or `Device(index=0)`)
   ...: nvidia0
Out[9]: PhysicalDevice(index=0, name="GeForce RTX 2080 Ti", total_memory=11019MiB)

In [10]: nvidia1 = Device(uuid='GPU-01234567-89ab-cdef-0123-456789abcdef')  # from UUID string (or just `Device('GPU-xxxxxxxx-...')`)
    ...: nvidia2 = Device(bus_id='00000000:06:00.0')                        # from PCI bus ID
    ...: nvidia1
Out[10]: PhysicalDevice(index=1, name="GeForce RTX 2080 Ti", total_memory=11019MiB)

In [11]: cuda0 = CudaDevice(0)                        # from CUDA device index (equivalent to `CudaDevice(cuda_index=0)`)
    ...: cuda1 = CudaDevice(nvml_index=8)             # from physical device index
    ...: cuda3 = CudaDevice(uuid='GPU-xxxxxxxx-...')  # from UUID string
    ...: cuda4 = Device.cuda(4)                       # `Device.cuda` is aliased to `CudaDevice`
    ...: cuda0
Out[11]:
CudaDevice(cuda_index=0, nvml_index=9, name="NVIDIA GeForce RTX 2080 Ti", total_memory=11019MiB)

In [12]: nvidia0.memory_used()  # in bytes
Out[12]: 9293398016

In [13]: nvidia0.memory_used_human()
Out[13]: '8862MiB'

In [14]: nvidia0.gpu_utilization()  # in percentage
Out[14]: 5

In [15]: nvidia0.processes()  # type: Dict[int, GpuProcess]
Out[15]: {
    52059: GpuProcess(pid=52059, gpu_memory=7885MiB, type=C, device=PhysicalDevice(index=0, name="GeForce RTX 2080 Ti", total_memory=11019MiB), host=HostProcess(pid=52059, name='ipython3', status='sleeping', started='14:31:22')),
    53002: GpuProcess(pid=53002, gpu_memory=967MiB, type=C, device=PhysicalDevice(index=0, name="GeForce RTX 2080 Ti", total_memory=11019MiB), host=HostProcess(pid=53002, name='python', status='running', started='14:31:59'))
}

In [16]: nvidia1_snapshot = nvidia1.as_snapshot()
    ...: nvidia1_snapshot
Out[16]: PhysicalDeviceSnapshot(
    real=PhysicalDevice(index=1, name="GeForce RTX 2080 Ti", total_memory=11019MiB),
    bus_id='00000000:05:00.0',
    compute_mode='Default',
    clock_infos=ClockInfos(graphics=1815, sm=1815, memory=6800, video=1680),  # in MHz
    clock_speed_infos=ClockSpeedInfos(current=ClockInfos(graphics=1815, sm=1815, memory=6800, video=1680), max=ClockInfos(graphics=2100, sm=2100, memory=7000, video=1950)),  # in MHz
    cuda_compute_capability=(7, 5),
    current_driver_model='N/A',
    decoder_utilization=0,              # in percentage
    display_active='Disabled',
    display_mode='Disabled',
    encoder_utilization=0,              # in percentage
    fan_speed=22,                       # in percentage
    gpu_utilization=17,                 # in percentage (NOTE: this is the utilization rate of SMs, i.e. GPU percent)
    index=1,
    max_clock_infos=ClockInfos(graphics=2100, sm=2100, memory=7000, video=1950),  # in MHz
    memory_clock=6800,                  # in MHz
    memory_free=10462232576,            # in bytes
    memory_free_human='9977MiB',
    memory_info=MemoryInfo(total=11554717696, free=10462232576, used=1092485120)  # in bytes
    memory_percent=9.5,                 # in percentage (NOTE: this is the percentage of used GPU memory)
    memory_total=11554717696,           # in bytes
    memory_total_human='11019MiB',
    memory_usage='1041MiB / 11019MiB',
    memory_used=1092485120,             # in bytes
    memory_used_human='1041MiB',
    memory_utilization=7,               # in percentage (NOTE: this is the utilization rate of GPU memory bandwidth)
    mig_mode='N/A',
    name='GeForce RTX 2080 Ti',
    pcie_rx_throughput=1000,            # in KiB/s
    pcie_rx_throughput_human='1000KiB/s',
    pcie_throughput=ThroughputInfo(tx=1000, rx=1000),  # in KiB/s
    pcie_tx_throughput=1000,            # in KiB/s
    pcie_tx_throughput_human='1000KiB/s',
    performance_state='P2',
    persistence_mode='Disabled',
    power_limit=250000,                 # in milliwatts (mW)
    power_status='66W / 250W',          # in watts (W)
    power_usage=66051,                  # in milliwatts (mW)
    sm_clock=1815,                      # in MHz
    temperature=39,                     # in Celsius
    total_volatile_uncorrected_ecc_errors='N/A',
    utilization_rates=UtilizationRates(gpu=17, memory=7, encoder=0, decoder=0),  # in percentage
    uuid='GPU-01234567-89ab-cdef-0123-456789abcdef',
)

In [17]: nvidia1_snapshot.memory_percent  # snapshot uses properties instead of function calls
Out[17]: 9.5

In [18]: nvidia1_snapshot['memory_info']  # snapshot also supports `__getitem__` by string
Out[18]: MemoryInfo(total=11554717696, free=10462232576, used=1092485120)

In [19]: nvidia1_snapshot.bar1_memory_info  # snapshot will automatically retrieve not presented attributes from `real`
Out[19]: MemoryInfo(total=268435456, free=257622016, used=10813440)

NOTE: Some entry values may be 'N/A' (type: NaType, a subclass of str) when the corresponding resources are not applicable. The NA value supports arithmetic operations. It acts like math.nan: float.

>>> from nvitop import NA
>>> NA
'N/A'

>>> 'memory usage: {}'.format(NA)  # NA is an instance of `str`
'memory usage: N/A'
>>> NA.lower()                     # NA is an instance of `str`
'n/a'
>>> NA.ljust(5)                    # NA is an instance of `str`
'N/A  '
>>> NA + 'str'                     # string contamination if the operand is a string
'N/Astr'

>>> float(NA)                      # explicit conversion to float (`math.nan`)
nan
>>> NA + 1                         # auto-casting to float if the operand is a number
nan
>>> NA * 1024                      # auto-casting to float if the operand is a number
nan
>>> NA / (1024 * 1024)             # auto-casting to float if the operand is a number
nan

You can use entry != 'N/A' conditions to avoid exceptions. It's safe to use float(entry) for numbers while NaType will be converted to math.nan. For example:

memory_used: Union[int, NaType] = device.memory_used()            # memory usage in bytes or `'N/A'`
memory_used_in_mib: float       = float(memory_used) / (1 << 20)  # memory usage in Mebibytes (MiB) or `math.nan`

It's safe to compare NaType with numbers, but NaType is always larger than any number:

devices_by_used_memory = sorted(Device.all(), key=Device.memory_used, reverse=True)  # it's safe to compare `'N/A'` with numbers
devices_by_free_memory = sorted(Device.all(), key=Device.memory_free, reverse=True)  # please add `memory_free != 'N/A'` checks if sort in descending order here

See nvitop.NaType documentation for more details.

Process

The process module provides:

HostProcess([pid])

Represents an OS process with the given PID.

GpuProcess(pid, device[, gpu_memory, ...])

Represents a process with the given PID running on the given GPU device.

command_join(cmdline)

Returns a shell-escaped string from command line arguments.

In [20]: processes = nvidia1.processes()  # type: Dict[int, GpuProcess]
    ...: processes
Out[20]: {
    23266: GpuProcess(pid=23266, gpu_memory=1031MiB, type=C, device=Device(index=1, name="GeForce RTX 2080 Ti", total_memory=11019MiB), host=HostProcess(pid=23266, name='python3', status='running', started='2021-05-10 21:02:40'))
}

In [21]: process = processes[23266]
    ...: process
Out[21]: GpuProcess(pid=23266, gpu_memory=1031MiB, type=C, device=Device(index=1, name="GeForce RTX 2080 Ti", total_memory=11019MiB), host=HostProcess(pid=23266, name='python3', status='running', started='2021-05-10 21:02:40'))

In [22]: process.status()  # GpuProcess will automatically inherit attributes from GpuProcess.host
Out[22]: 'running'

In [23]: process.cmdline()  # type: List[str]
Out[23]: ['python3', 'rllib_train.py']

In [24]: process.command()  # type: str
Out[24]: 'python3 rllib_train.py'

In [25]: process.cwd()  # GpuProcess will automatically inherit attributes from GpuProcess.host
Out[25]: '/home/xxxxxx/Projects/xxxxxx'

In [26]: process.gpu_memory_human()
Out[26]: '1031MiB'

In [27]: process.as_snapshot()
Out[27]: GpuProcessSnapshot(
    real=GpuProcess(pid=23266, gpu_memory=1031MiB, type=C, device=PhysicalDevice(index=1, name="GeForce RTX 2080 Ti", total_memory=11019MiB), host=HostProcess(pid=23266, name='python3', status='running', started='2021-05-10 21:02:40')),
    cmdline=['python3', 'rllib_train.py'],
    command='python3 rllib_train.py',
    compute_instance_id='N/A',
    cpu_percent=98.5,                       # in percentage
    device=PhysicalDevice(index=1, name="GeForce RTX 2080 Ti", total_memory=11019MiB),
    gpu_encoder_utilization=0,              # in percentage
    gpu_decoder_utilization=0,              # in percentage
    gpu_instance_id='N/A',
    gpu_memory=1081081856,                  # in bytes
    gpu_memory_human='1031MiB',
    gpu_memory_percent=9.4,                 # in percentage (NOTE: this is the percentage of used GPU memory)
    gpu_memory_utilization=5,               # in percentage (NOTE: this is the utilization rate of GPU memory bandwidth)
    gpu_sm_utilization=0,                   # in percentage (NOTE: this is the utilization rate of SMs, i.e. GPU percent)
    host=HostProcessSnapshot(
        real=HostProcess(pid=23266, name='python3', status='running', started='2021-05-10 21:02:40'),
        cmdline=['python3', 'rllib_train.py'],
        command='python3 rllib_train.py',
        cpu_percent=98.5,                   # in percentage
        host_memory=9113627439,             # in bytes
        host_memory_human='8691MiB',
        is_running=True,
        memory_percent=1.6849018430285683,  # in percentage
        name='python3',
        running_time=datetime.timedelta(days=1, seconds=80013, microseconds=470024),
        running_time_human='46:13:33',
        running_time_in_seconds=166413.470024,
        status='running',
        username='panxuehai',
    ),
    host_memory=9113627439,                 # in bytes
    host_memory_human='8691MiB',
    is_running=True,
    memory_percent=1.6849018430285683,      # in percentage (NOTE: this is the percentage of used host memory)
    name='python3',
    pid=23266,
    running_time=datetime.timedelta(days=1, seconds=80013, microseconds=470024),
    running_time_human='46:13:33',
    running_time_in_seconds=166413.470024,
    status='running',
    type='C',                               # 'C' for Compute / 'G' for Graphics / 'C+G' for Both
    username='panxuehai',
)

In [28]: process.uids()  # GpuProcess will automatically inherit attributes from GpuProcess.host
Out[28]: puids(real=1001, effective=1001, saved=1001)

In [29]: process.kill()  # GpuProcess will automatically inherit attributes from GpuProcess.host

In [30]: list(map(Device.processes, all_devices))  # all processes
Out[30]: [
    {
        52059: GpuProcess(pid=52059, gpu_memory=7885MiB, type=C, device=PhysicalDevice(index=0, name="GeForce RTX 2080 Ti", total_memory=11019MiB), host=HostProcess(pid=52059, name='ipython3', status='sleeping', started='14:31:22')),
        53002: GpuProcess(pid=53002, gpu_memory=967MiB, type=C, device=PhysicalDevice(index=0, name="GeForce RTX 2080 Ti", total_memory=11019MiB), host=HostProcess(pid=53002, name='python', status='running', started='14:31:59'))
    },
    {},
    {},
    {},
    {},
    {},
    {},
    {},
    {
        84748: GpuProcess(pid=84748, gpu_memory=8975MiB, type=C, device=PhysicalDevice(index=8, name="GeForce RTX 2080 Ti", total_memory=11019MiB), host=HostProcess(pid=84748, name='python', status='running', started='11:13:38'))
    },
    {
        84748: GpuProcess(pid=84748, gpu_memory=8341MiB, type=C, device=PhysicalDevice(index=9, name="GeForce RTX 2080 Ti", total_memory=11019MiB), host=HostProcess(pid=84748, name='python', status='running', started='11:13:38'))
    }
]

In [31]: this = HostProcess(os.getpid())
    ...: this
Out[31]: HostProcess(pid=35783, name='python', status='running', started='19:19:00')

In [32]: this.cmdline()  # type: List[str]
Out[32]: ['python', '-c', 'import IPython; IPython.terminal.ipapp.launch_new_instance()']

In [33]: this.command()  # not simply `' '.join(cmdline)` but quotes are added
Out[33]: 'python -c "import IPython; IPython.terminal.ipapp.launch_new_instance()"'

In [34]: this.memory_info()
Out[34]: pmem(rss=83988480, vms=343543808, shared=12079104, text=8192, lib=0, data=297435136, dirty=0)

In [35]: import cupy as cp
    ...: x = cp.zeros((10000, 1000))
    ...: this = GpuProcess(os.getpid(), cuda0)  # construct from `GpuProcess(pid, device)` explicitly rather than calling `device.processes()`
    ...: this
Out[35]: GpuProcess(pid=35783, gpu_memory=N/A, type=N/A, device=CudaDevice(cuda_index=0, nvml_index=9, name="NVIDIA GeForce RTX 2080 Ti", total_memory=11019MiB), host=HostProcess(pid=35783, name='python', status='running', started='19:19:00'))

In [36]: this.update_gpu_status()  # update used GPU memory from new driver queries
Out[36]: 267386880

In [37]: this
Out[37]: GpuProcess(pid=35783, gpu_memory=255MiB, type=C, device=CudaDevice(cuda_index=0, nvml_index=9, name="NVIDIA GeForce RTX 2080 Ti", total_memory=11019MiB), host=HostProcess(pid=35783, name='python', status='running', started='19:19:00'))

In [38]: id(this) == id(GpuProcess(os.getpid(), cuda0))  # IMPORTANT: the instance will be reused while the process is running
Out[38]: True
Host (inherited from psutil)
In [39]: host.cpu_count()
Out[39]: 88

In [40]: host.cpu_percent()
Out[40]: 18.5

In [41]: host.cpu_times()
Out[41]: scputimes(user=2346377.62, nice=53321.44, system=579177.52, idle=10323719.85, iowait=28750.22, irq=0.0, softirq=11566.87, steal=0.0, guest=0.0, guest_nice=0.0)

In [42]: host.load_average()
Out[42]: (14.88, 17.8, 19.91)

In [43]: host.virtual_memory()
Out[43]: svmem(total=270352478208, available=192275968000, percent=28.9, used=53350518784, free=88924037120, active=125081112576, inactive=44803993600, buffers=37006450688, cached=91071471616, shared=23820632064, slab=8200687616)

In [44]: host.memory_percent()
Out[44]: 28.9

In [45]: host.swap_memory()
Out[45]: sswap(total=65534947328, used=475136, free=65534472192, percent=0.0, sin=2404139008, sout=4259434496)

In [46]: host.swap_percent()
Out[46]: 0.0

Screenshots

Screen Recording

Example output of nvitop -1:

Screenshot

Example output of nvitop:

Full Compact
Full Compact

Tree-view screen (shortcut: t) for GPU processes and their ancestors:

Tree-view

NOTE: The process tree is built in backward order (recursively back to the tree root). Only GPU processes along with their children and ancestors (parents and grandparents ...) will be shown. Not all running processes will be displayed.

Environment variable screen (shortcut: e):

Environment Screen

Spectrum-like bar charts (with option --colorful):

Spectrum-like Bar Charts


Changelog

See CHANGELOG.md.


License

The source code of nvitop is dual-licensed by the Apache License, Version 2.0 (Apache-2.0) and GNU General Public License, Version 3 (GPL-3.0). The nvitop CLI is released under the GPL-3.0 license while the remaining part of nvitop is released under the Apache-2.0 license. The license files can be found at LICENSE (Apache-2.0) and COPYING (GPL-3.0).

The source code is organized as:

nvitop           (GPL-3.0)
├── __init__.py  (Apache-2.0)
├── version.py   (Apache-2.0)
├── api          (Apache-2.0)
│   ├── LICENSE  (Apache-2.0)
│   └── *        (Apache-2.0)
├── callbacks    (Apache-2.0)
│   ├── LICENSE  (Apache-2.0)
│   └── *        (Apache-2.0)
├── select.py    (Apache-2.0)
├── __main__.py  (GPL-3.0)
├── cli.py       (GPL-3.0)
└── gui          (GPL-3.0)
    ├── COPYING  (GPL-3.0)
    └── *        (GPL-3.0)

Copyright Notice

Please feel free to use nvitop as a dependency for your own projects. The following Python import statements are permitted:

import nvitop
import nvitop as alias
import nvitop.api as api
import nvitop.device as device
from nvitop import *
from nvitop.api import *
from nvitop import Device, ResourceMetricCollector

The public APIs from nvitop are released under the Apache License, Version 2.0 (Apache-2.0). The original license files can be found at LICENSE, nvitop/api/LICENSE, and nvitop/callbacks/LICENSE.

The CLI of nvitop is released under the GNU General Public License, Version 3 (GPL-3.0). The original license files can be found at COPYING and nvitop/gui/COPYING. If you dynamically load the source code of nvitop's CLI or GUI:

from nvitop import cli
from nvitop import gui
import nvitop.cli
import nvitop.gui

your source code should also be released under the GPL-3.0 License.

If you want to add or modify some features of nvitop's CLI, or copy some source code of nvitop's CLI into your own code, the source code should also be released under the GPL-3.0 License (as nvitop contains some modified source code from ranger under the GPL-3.0 License).

nvitop's People

Contributors

dependabot[bot] avatar xuehaipan avatar

Stargazers

 avatar  avatar  avatar  avatar  avatar  avatar  avatar  avatar  avatar  avatar  avatar  avatar  avatar  avatar  avatar  avatar  avatar  avatar  avatar  avatar  avatar  avatar  avatar  avatar  avatar  avatar  avatar  avatar  avatar  avatar  avatar  avatar  avatar  avatar  avatar  avatar  avatar  avatar  avatar  avatar  avatar  avatar  avatar  avatar  avatar  avatar  avatar  avatar  avatar  avatar  avatar  avatar  avatar  avatar  avatar  avatar  avatar  avatar  avatar  avatar  avatar  avatar  avatar  avatar  avatar  avatar  avatar  avatar  avatar  avatar  avatar  avatar  avatar  avatar  avatar  avatar  avatar  avatar  avatar  avatar  avatar  avatar  avatar  avatar  avatar  avatar  avatar  avatar  avatar  avatar  avatar  avatar  avatar  avatar  avatar  avatar  avatar  avatar  avatar  avatar

Watchers

 avatar  avatar  avatar  avatar  avatar  avatar  avatar  avatar  avatar  avatar  avatar  avatar  avatar  avatar  avatar  avatar  avatar  avatar  avatar  avatar  avatar  avatar  avatar

nvitop's Issues

[Question] Why fan speed will be set to 0 when nvitop is running

Required prerequisites

  • I have read the documentation https://nvitop.readthedocs.io.
  • I have searched the Issue Tracker that this hasn't already been reported. (comment there if it has.)
  • I have tried the latest version of nvitop in a new isolated virtual environment.

Questions

Hi, big thanks for creating this great tool!

I found that the gpu fans speed will be set to 0 when nvitop is running at frontend(even the tempature is ~45C), but I did not found any fan control related code, could you explain how it works? thanks!

[Question] Unable to view GPU memory usage in Windows (N/A memory usage)

Required prerequisites

  • I have read the documentation https://nvitop.readthedocs.io.
  • I have searched the Issue Tracker that this hasn't already been reported. (comment there if it has.)
  • I have tried the latest version of nvitop in a new isolated virtual environment.

Questions

Whether I use nvidia-smi or nvitop, they both list my GPU memory usage as N/A and WDDM:N/A respectively. Seeing as nvitop uses nvidia's SMI under-the-hood, I suppose that's why I'm having the similar issue. Oddly, using Process Explorer I am able to see the memory usage of my applications. My drivers are up to date, but the behavior is odd. Has anyone experienced this or better yet resolved it?

OS: Windows 10
GPU: RTX 3080 (531.18)
Both on WSL2 or Windows environments

[Feature Request] Collect metrics in a fixed interval for the lifespan of a training job

Hi @XuehaiPan,

In your examples to collect metrics using ResourceMetricCollector inside a training loop, the collector.collect(), collects a snapshot at each epoch/batch loop which misses the the entire period between the previous and current loop.
If a loop takes 5 minutes, we have the metrics at 5 minutes interval.

I wonder if there is a way to run a process in background to collect the metrics at a certain interval let's say 5 seconds, during the lifespan of a training job?

Therefore if the entire job took 1hr, with the 5 sec interval, we collect 720 snapshots.

Thanks

Package conflicts with `nvidia-ml-py` (`pynvml.py`)

hi,老哥,我安装好之后,输入 nvitop 会出现这个错误:

ERROR: Some FunctionNotFound errors occurred while calling:
    nvmlQuery('nvmlDeviceGetGraphicsRunningProcesses', *args, **kwargs)
    nvmlQuery('nvmlDeviceGetComputeRunningProcesses', *args, **kwargs)
Please verify whether the nvidia-ml-py package is compatible with your NVIDIA driver version.
You can check the release history of nvidia-ml-py at https://pypi.org/project/nvidia-ml-py/#history,
and install the compatible version manually.

但是,我安装其他版本的 nvidia-ml-py,会出现:

ERROR: pip's dependency resolver does not currently take into account all the packages that are installed. This behaviour is the source of the following dependency conflicts.
nvitop 0.3.5.4 requires nvidia-ml-py==11.450.51, but you have nvidia-ml-py 7.352.0 which is incompatible.

看起来 nvitop 需要 nvidia-ml-py==11.450.51,但是我的显卡驱动又和 nvidia-ml-py 版本不兼容,有解决办法吗?

[Feature Request] Add support for prometheus metrics exporter

Required prerequisites

  • I have searched the Issue Tracker that this hasn't already been reported. (comment there if it has.)
  • I have tried the latest version of nvitop in a new isolated virtual environment.

Motivation

能否添加一下metrics exporter这样的server mode,让prometheus和grafana的显示

Solution

No response

Alternatives

No response

Additional context

No response

[Bug] display issue when running inside tmux

Runtime Environment

  • Operating system and version: Ubuntu 16.04 LTS
  • Terminal emulator and version: iTerm2 3.4.15
  • Python version: 3.9.7
  • NVML version (driver version): 470.57
  • nvitop version: main@latest
  • Locale: en_US.UTF-8

Current Behavior

When running nvitop inside tmux, the rendered display will become messed up, as shown in the screenshots. This behavior is not present when not using tmux.

Steps to Reproduce

  1. open a tmux session
  2. run nvitop

Images / Videos

scrnsht

[Question] Installation issue on NVIDIA Jetson AGX Orin (aarch64)

Required prerequisites

  • I have read the documentation https://nvitop.readthedocs.io.
  • I have searched the Issue Tracker that this hasn't already been reported. (comment there if it has.)
  • I have tried the latest version of nvitop in a new isolated virtual environment.

Questions

So I got this error, when I tried run nvtop.
FATAL ERROR: NVIDIA Management Library (NVML) not found.
HINT: The NVIDIA Management Library ships with the NVIDIA display driver (available at
https://www.nvidia.com/Download/index.aspx), or can be downloaded as part of the
NVIDIA CUDA Toolkit (available at https://developer.nvidia.com/cuda-downloads).
The lists of OS platforms and NVIDIA-GPUs supported by the NVML library can be
found in the NVML API Reference at https://docs.nvidia.com/deploy/nvml-api.

So I tried to install the display driver which carried the NVML.

So, When I tried to install, using bash install-nvidia-driver.sh --package=nvidia-driver-470
I got no package found.
The following packages have unmet dependencies:
nvidia-driver-530 : Depends: nvidia-driver-535 but it is not installable
E: Unable to correct problems, you have held broken packages.

Moreover, it seems this particular driver is not suited for AGX Orin. Can you please help me install nvitop on AGX Orin with/without the driver?

image

[Feature Request] Make `AppImage` format or binary file

Required prerequisites

  • I have searched the Issue Tracker that this hasn't already been reported. (comment there if it has.)
  • I have tried the latest version of nvitop in a new isolated virtual environment.

Motivation

appimage format it can run everywhere

and the modern Command like fzf nvtop bat btop, there have appimage format or binary file too

Solution

No response

Alternatives

No response

Additional context

No response

[Bug] gpu memory-usage not show right in driver 510 version

Runtime Environment

  • Operating system and version: Ubuntu 20.04 LTS
  • Terminal emulator and version: GNOME Terminal 3.36.2
  • Python version: 3.8.10
  • NVML version (driver version): 510.47.03
  • nvitop version or commit: 0.5.3
  • nvidia-ml-py version: 11.450.51
  • Locale: zh_CN.UTF-8

Current Behavior

After upgrade the nvidia driver to the latest version 510.47.03, the gpu memory-usage not show right in my workstation both for 1080Ti and A100. It shows more memory usage than the actual one, which is not matched with the nvidia-smi command.

nvitop

image

nvidia-smi

image

It seems the nvtop command also makes mistakes.

nvtop

image

Expected Behavior

The gpu memory-usage should match the nvidia-smi.

[Feature Request] Refresh rate < 1 sec

Required prerequisites

  • I have searched the Issue Tracker that this hasn't already been reported. (comment there if it has.)
  • I have tried the latest version of nvitop in a new isolated virtual environment.

Motivation

I see the current minimum refresh rate is 1 second.
Could it be something like 0.1 sec so that we can get a more accurate overview of what is happening on the GPU?

Solution

Alternatives

Additional context

[Question] live metrics collector

Required prerequisites

  • I have read the documentation https://nvitop.readthedocs.io.
  • I have searched the Issue Tracker that this hasn't already been reported. (comment there if it has.)
  • I have tried the latest version of nvitop in a new isolated virtual environment.

Questions

Hi
Thanks for your great repo.
I have a question about the values of the metrics that nvitop collects.
If I'm not mistaken, the API returns mean/max/min values for specified intervals, I need to collect the absolute values for each second or every few seconds.
Is there any way to handle this?

[Feature Request] 需要一个GUI版本

Required prerequisites

  • I have searched the Issue Tracker that this hasn't already been reported. (comment there if it has.)
  • I have tried the latest version of nvitop in a new isolated virtual environment.

Motivation

<不会代码,安装了使用命令不起作用>

Solution

No response

Alternatives

No response

Additional context

No response

[Bug] Corrupted dependency of version 0.10.0 with `pynvml`

Runtime Environment

  • Operating system and version: Ubuntu 20.04 LTS
  • Terminal emulator and version: N/A
  • Python version: 3.8.10
  • NVML version (driver version): [e.g. 460.84]
  • nvitop version or commit: 0.10.0
  • python-ml-py version: [e.g. 11.450.51]
  • Locale: [e.g. C / C.UTF-8 / en_US.UTF-8]
  • CUDA: 11.6/11.7

Current Behavior

Version 0.10.0 complains about 'pynvml' has no attribute '_nvmlGetFunctionPointer' Here's sequence of working/not working. Servers have the latest versions of py3nvml and pynvml. Dell servers running A100 GPUs. Just built a new Ubuntu 20.04 system running on Dell Poweredge R720 with cuda 11.5 and GTX1080s and I was able to install 0.10.0 with no issues and it is working fine. Thanks.

root@hydra1 ~# nvt
Wed Oct 19 13:57:29 2022
╒═════════════════════════════════════════════════════════════════════════════╕
│ NVITOP 0.9.0       Driver Version: 510.47.03      CUDA Driver Version: 11.6 │
├───────────────────────────────┬──────────────────────┬──────────────────────┤
│ GPU  Name        Persistence-M│ Bus-Id        Disp.A │ MIG M.   Uncorr. ECC │
│ Fan  Temp  Perf  Pwr:Usage/Cap│         Memory-Usage │ GPU-Util  Compute M. │
╞═══════════════════════════════╪══════════════════════╪══════════════════════╪══════════════════════════════════════════════════════╕
│   0  A100-SXM4-80GB      On   │ 00000000:01:00.0 Off │ Disabled           0 │ MEM: █████████▋ 22.4%                                │
│ N/A   28C    P0    69W / 500W │  18380MiB / 80.00GiB │      0%      Default │ UTL: ▏ 0%                                            │
├───────────────────────────────┼──────────────────────┼──────────────────────┼──────────────────────────────────────────────────────┤
│   1  A100-SXM4-80GB      On   │ 00000000:41:00.0 Off │ Disabled           0 │ MEM: █████████████████████████████████████████▊ 97%  │
│ N/A   55C    P0   142W / 500W │  77.74GiB / 80.00GiB │     99%      Default │ UTL: ██████████████████████████████████████████▋ 99% │
├───────────────────────────────┼──────────────────────┼──────────────────────┼──────────────────────────────────────────────────────┤
│   2  A100-SXM4-80GB      On   │ 00000000:81:00.0 Off │ Disabled           0 │ MEM: ▍ 1.0%                                          │
│ N/A   34C    P0    61W / 500W │    850MiB / 80.00GiB │      0%      Default │ UTL: ▏ 0%                                            │
├───────────────────────────────┼──────────────────────┼──────────────────────┼──────────────────────────────────────────────────────┤
│   3  A100-SXM4-80GB      On   │ 00000000:C1:00.0 Off │ Disabled           0 │ MEM: █████▋ 13.0%                                    │
│ N/A   28C    P0    68W / 500W │  10619MiB / 80.00GiB │      0%      Default │ UTL: ▏ 0%                                            │
╘═══════════════════════════════╧══════════════════════╧══════════════════════╧══════════════════════════════════════════════════════╛
[ CPU: █▏ 1.4%                                                                                  ]  ( Load Average:  1.91  1.65  2.59 )
[ MEM: █████▏ 6.1%                                                                              ]  [ SWP: ▏ 0.0%                     ]

╒════════════════════════════════════════════════════════════════════════════════════════════════════════════════════════════════════╕
│ Processes:                                                                                                      [email protected]
│ GPU     PID      USER  GPU-MEM %SM  %CPU  %MEM       TIME  COMMAND                                                                 │
╞════════════════════════════════════════════════════════════════════════════════════════════════════════════════════════════════════╡
│   0   27113 C    root 10141MiB   0   0.5   0.5  28.0 days  trver --log-verbose=0 --strict-model-config=true --model-repos.. │
│   0   59066 C snaith+  7385MiB   0   0.0   0.8   9.8 days  /home/snani/anaconda3/envs//bin/python3.8 /home/sn.. │
├────────────────────────────────────────────────────────────────────────────────────────────────────────────────────────────────────┤
│   1   13134 C    root 76.91GiB  89  99.7   0.7    9:58:03  python ./scripts/speectext_bpe.py --config-path=/rpice/dgx.. │
├────────────────────────────────────────────────────────────────────────────────────────────────────────────────────────────────────┤
│   3   41771 C    root  9765MiB   0   0.5   0.4   46:36:44  tritr --log-verbose=0 --strict-model-config=true --model-repos.. │
╘════════════════════════════════════════════════════════════════════════════════════════════════════════════════════════════════════╛
root@hydra1 ~#  pip3 install --upgrade nvitop
Collecting nvitop
  Downloading nvitop-0.10.0-py3-none-any.whl (159 kB)
     |████████████████████████████████| 159 kB 1.0 MB/s
Requirement already satisfied, skipping upgrade: cachetools>=1.0.1 in /usr/local/lib/python3.8/dist-packages (from nvitop) (5.0.0)
Requirement already satisfied, skipping upgrade: nvidia-ml-py<11.516.0a0,>=11.450.51 in /usr/local/lib/python3.8/dist-packages (from nvitop) (11.450.51)
Requirement already satisfied, skipping upgrade: psutil>=5.6.6 in /usr/local/lib/python3.8/dist-packages (from nvitop) (5.9.0)
Requirement already satisfied, skipping upgrade: termcolor>=1.0.0 in /usr/local/lib/python3.8/dist-packages (from nvitop) (1.1.0)
Installing collected packages: nvitop
  Attempting uninstall: nvitop
    Found existing installation: nvitop 0.9.0
    Uninstalling nvitop-0.9.0:
      Successfully uninstalled nvitop-0.9.0
Successfully installed nvitop-0.10.0
root@hydra1 ~# nvt
Traceback (most recent call last):
  File "/usr/local/bin/nvitop", line 5, in <module>
    from nvitop.cli import main
  File "/usr/local/lib/python3.8/dist-packages/nvitop/__init__.py", line 6, in <module>
    from nvitop import core
  File "/usr/local/lib/python3.8/dist-packages/nvitop/core/__init__.py", line 6, in <module>
    from nvitop.core import host, libcuda, libnvml, utils
  File "/usr/local/lib/python3.8/dist-packages/nvitop/core/libnvml.py", line 543, in <module>
    __patch_backward_compatibility_layers()
  File "/usr/local/lib/python3.8/dist-packages/nvitop/core/libnvml.py", line 539, in __patch_backward_compatibility_layers
    with_mapped_function_name()  # patch first and only for once
  File "/usr/local/lib/python3.8/dist-packages/nvitop/core/libnvml.py", line 443, in with_mapped_function_name
    _pynvml._nvmlGetFunctionPointer  # pylint: disable=protected-access
AttributeError: module 'pynvml' has no attribute '_nvmlGetFunctionPointer'
root@hydra1 ~# pip3 install nvitop==0.9.0
Collecting nvitop==0.9.0
  Using cached nvitop-0.9.0-py3-none-any.whl (157 kB)
Requirement already satisfied: psutil>=5.6.6 in /usr/local/lib/python3.8/dist-packages (from nvitop==0.9.0) (5.9.0)
Requirement already satisfied: cachetools>=1.0.1 in /usr/local/lib/python3.8/dist-packages (from nvitop==0.9.0) (5.0.0)
Requirement already satisfied: termcolor>=1.0.0 in /usr/local/lib/python3.8/dist-packages (from nvitop==0.9.0) (1.1.0)
Requirement already satisfied: nvidia-ml-py<11.500.0a0,>=11.450.51 in /usr/local/lib/python3.8/dist-packages (from nvitop==0.9.0) (11.450.51)
Installing collected packages: nvitop
  Attempting uninstall: nvitop
    Found existing installation: nvitop 0.10.0
    Uninstalling nvitop-0.10.0:
      Successfully uninstalled nvitop-0.10.0
Successfully installed nvitop-0.9.0
root@hydra1 ~# nvt
Wed Oct 19 14:00:57 2022
╒═════════════════════════════════════════════════════════════════════════════╕
│ NVITOP 0.9.0       Driver Version: 510.47.03      CUDA Driver Version: 11.6 │
├───────────────────────────────┬──────────────────────┬──────────────────────┤
│ GPU  Name        Persistence-M│ Bus-Id        Disp.A │ MIG M.   Uncorr. ECC │
│ Fan  Temp  Perf  Pwr:Usage/Cap│         Memory-Usage │ GPU-Util  Compute M. │
╞═══════════════════════════════╪══════════════════════╪══════════════════════╪══════════════════════════════════════════════════════╕
│   0  A100-SXM4-80GB      On   │ 00000000:01:00.0 Off │ Disabled           0 │ MEM: █████████▋ 22.4%                                │
│ N/A   28C    P0    70W / 500W │  18380MiB / 80.00GiB │      0%      Default │ UTL: ▏ 0%                                            │
├───────────────────────────────┼──────────────────────┼──────────────────────┼──────────────────────────────────────────────────────┤
│   1  A100-SXM4-80GB      On   │ 00000000:41:00.0 Off │ Disabled           0 │ MEM: █████████████████████████████████████████▊ 97%  │
│ N/A   55C    P0   346W / 500W │  77.74GiB / 80.00GiB │    100%      Default │ UTL: ███████████████████████████████████████████ MAX │
├───────────────────────────────┼──────────────────────┼──────────────────────┼──────────────────────────────────────────────────────┤
│   2  A100-SXM4-80GB      On   │ 00000000:81:00.0 Off │ Disabled           0 │ MEM: ▍ 1.0%                                          │
│ N/A   34C    P0    61W / 500W │    850MiB / 80.00GiB │      0%      Default │ UTL: ▏ 0%                                            │
├───────────────────────────────┼──────────────────────┼──────────────────────┼──────────────────────────────────────────────────────┤
│   3  A100-SXM4-80GB      On   │ 00000000:C1:00.0 Off │ Disabled           0 │ MEM: █████▋ 13.0%                                    │
│ N/A   28C    P0    68W / 500W │  10619MiB / 80.00GiB │      0%      Default │ UTL: ▏ 0%                                            │
╘═══════════════════════════════╧══════════════════════╧══════════════════════╧══════════════════════════════════════════════════════╛
[ CPU: █▌ 1.8%                                                                                  ]  ( Load Average:  1.42  1.53  2.35 )
[ MEM: █████▎ 6.2%                                                                              ]  [ SWP: ▏ 0.0%                     ]

╒════════════════════════════════════════════════════════════════════════════════════════════════════════════════════════════════════╕
│ Processes:                                                                                                      [email protected]
│ GPU     PID      USER  GPU-MEM %SM  %CPU  %MEM       TIME  COMMAND                                                                 │
╞════════════════════════════════════════════════════════════════════════════════════════════════════════════════════════════════════╡
│   0   27113 C    root 10141MiB   0   0.5   0.5  28.0 days  trir --log-verbose=0 --strict-model-config=true --model-repos.. │
│   0   59066 C snaith+  7385MiB   0   0.0   0.8   9.8 days  /home/snani/anaconda3/envs//home/sn.. │
├────────────────────────────────────────────────────────────────────────────────────────────────────────────────────────────────────┤
│   1   13134 C    root 76.91GiB  88 100.6   0.7   10:01:31  python ./scripts/stext_bpe.py --config-path=/rprice/dgx.. │
├────────────────────────────────────────────────────────────────────────────────────────────────────────────────────────────────────┤
│   3   41771 C    root  9765MiB   0   0.5   0.4   46:40:12  tritr --log-verbose=0 --strict-model-config=true --model-repos.. │
╘════════════════════════════════════════════════════════════════════════════════════════════════════════════════════════════════════╛
root@hydra1 ~# logout

Reverting to 0.9.0 fixes the issue.

# Different server with CUDA 11.7
root@hydra4 aide#  pip3 install --upgrade nvitop
Collecting nvitop
  Downloading nvitop-0.10.0-py3-none-any.whl (159 kB)
     |████████████████████████████████| 159 kB 15.3 MB/s
Requirement already satisfied, skipping upgrade: psutil>=5.6.6 in /usr/local/lib/python3.8/dist-packages (from nvitop) (5.9.0)
Requirement already satisfied, skipping upgrade: termcolor>=1.0.0 in /usr/local/lib/python3.8/dist-packages (from nvitop) (1.1.0)
Requirement already satisfied, skipping upgrade: cachetools>=1.0.1 in /usr/local/lib/python3.8/dist-packages (from nvitop) (5.0.0)
Requirement already satisfied, skipping upgrade: nvidia-ml-py<11.516.0a0,>=11.450.51 in /usr/local/lib/python3.8/dist-packages (from nvitop) (11.450.51)
Installing collected packages: nvitop
  Attempting uninstall: nvitop
    Found existing installation: nvitop 0.9.0
    Uninstalling nvitop-0.9.0:
      Successfully uninstalled nvitop-0.9.0
Successfully installed nvitop-0.10.0
root@hydra4 aide# nvitop
Traceback (most recent call last):
  File "/usr/local/bin/nvitop", line 5, in <module>
    from nvitop.cli import main
  File "/usr/local/lib/python3.8/dist-packages/nvitop/__init__.py", line 6, in <module>
    from nvitop import core
  File "/usr/local/lib/python3.8/dist-packages/nvitop/core/__init__.py", line 6, in <module>
    from nvitop.core import host, libcuda, libnvml, utils
  File "/usr/local/lib/python3.8/dist-packages/nvitop/core/libnvml.py", line 543, in <module>
    __patch_backward_compatibility_layers()
  File "/usr/local/lib/python3.8/dist-packages/nvitop/core/libnvml.py", line 539, in __patch_backward_compatibility_layers
    with_mapped_function_name()  # patch first and only for once
  File "/usr/local/lib/python3.8/dist-packages/nvitop/core/libnvml.py", line 443, in with_mapped_function_name
    _pynvml._nvmlGetFunctionPointer  # pylint: disable=protected-access
AttributeError: module 'pynvml' has no attribute '_nvmlGetFunctionPointer'

root@hydra4 aide# pip3 install nvitop==0.9.0
Collecting nvitop==0.9.0
  Using cached nvitop-0.9.0-py3-none-any.whl (157 kB)
Requirement already satisfied: termcolor>=1.0.0 in /usr/local/lib/python3.8/dist-packages (from nvitop==0.9.0) (1.1.0)
Requirement already satisfied: nvidia-ml-py<11.500.0a0,>=11.450.51 in /usr/local/lib/python3.8/dist-packages (from nvitop==0.9.0) (11.450.51)
Requirement already satisfied: cachetools>=1.0.1 in /usr/local/lib/python3.8/dist-packages (from nvitop==0.9.0) (5.0.0)
Requirement already satisfied: psutil>=5.6.6 in /usr/local/lib/python3.8/dist-packages (from nvitop==0.9.0) (5.9.0)
Installing collected packages: nvitop
  Attempting uninstall: nvitop
    Found existing installation: nvitop 0.10.0
    Uninstalling nvitop-0.10.0:
      Successfully uninstalled nvitop-0.10.0
Successfully installed nvitop-0.9.0
root@hydra4 aide# nvt
Wed Oct 19 14:01:18 2022
╒═════════════════════════════════════════════════════════════════════════════╕
│ NVITOP 0.9.0       Driver Version: 515.43.04      CUDA Driver Version: 11.7 │
├───────────────────────────────┬──────────────────────┬──────────────────────┤
│ GPU  Name        Persistence-M│ Bus-Id        Disp.A │ MIG M.   Uncorr. ECC │
│ Fan  Temp  Perf  Pwr:Usage/Cap│         Memory-Usage │ GPU-Util  Compute M. │
╞═══════════════════════════════╪══════════════════════╪══════════════════════╪══════════════════════════════════════════════════════╕
│   0  A100-SXM4-80GB      On   │ 00000000:01:00.0 Off │  Enabled           0 │ MEM: ▍ 1.0%                                          │
│ N/A   26C    P0    51W / 500W │    854MiB / 80.00GiB │     N/A      Default │ UTL: ░░░░░░░░░░░░░░░░░░░░░░░░░░░░░░░░░░░░░░░░░░░ N/A │
├───────────────────────────────┼──────────────────────┼──────────────────────┼──────────────────────────────────────────────────────┤
│ 0:0      2g.20gb @ GI/CI: 3/0 │     13MiB / 19968MiB │ BAR1:    18MiB /  0% │ MEM: ▏ 0.1%                                          │
│ 0:1      2g.20gb @ GI/CI: 4/0 │     13MiB / 19968MiB │ BAR1:    22MiB /  0% │ MEM: ▏ 0.1%                                          │
│ 0:2      2g.20gb @ GI/CI: 5/0 │     13MiB / 19968MiB │ BAR1:     2MiB /  0% │ MEM: ▏ 0.1%                                          │
├───────────────────────────────┼──────────────────────┼──────────────────────┼──────────────────────────────────────────────────────┤
│   1  A100-SXM4-80GB      On   │ 00000000:41:00.0 Off │ Disabled           0 │ MEM: █████▊ 13.5%                                    │
│ N/A   38C    P0   157W / 500W │  11027MiB / 80.00GiB │     89%      Default │ UTL: ██████████████████████████████████████▎ 89%     │
├───────────────────────────────┼──────────────────────┼──────────────────────┼──────────────────────────────────────────────────────┤
│   2  A100-SXM4-80GB      On   │ 00000000:81:00.0 Off │ Disabled           0 │ MEM: █████▊ 13.5%                                    │
│ N/A   42C    P0   139W / 500W │  11043MiB / 80.00GiB │     90%      Default │ UTL: ██████████████████████████████████████▊ 90%     │
├───────────────────────────────┼──────────────────────┼──────────────────────┼──────────────────────────────────────────────────────┤
│   3  A100-SXM4-80GB      On   │ 00000000:C1:00.0 Off │ Disabled           0 │ MEM: ▍ 1.0%                                          │
│ N/A   25C    P0    55W / 500W │    815MiB / 80.00GiB │      0%      Default │ UTL: ▏ 0%                                            │
╘═══════════════════════════════╧══════════════════════╧══════════════════════╧══════════════════════════════════════════════════════╛
[ CPU: ███▎ 3.8%                                                                                ]  ( Load Average:  6.83  7.11  6.50 )
[ MEM: ███▌ 4.2%                                                                                ]  [ SWP: ▏ 0.0%                     ]

╒════════════════════════════════════════════════════════════════════════════════════════════════════════════════════════════════════╕
│ Processes:                                                                                                 [email protected]
│ GPU     PID      USER  GPU-MEM %SM  %CPU  %MEM   TIME  COMMAND                                                                     │
╞════════════════════════════════════════════════════════════════════════════════════════════════════════════════════════════════════╡
│   1   25414 C aljolje 10209MiB  84 100.3   0.5  25:02  /n/redta/rc043h/PYTORCHY/miniconda2/envs/py3.9_torch1.10_cuda11.3/bin/p.. │
├────────────────────────────────────────────────────────────────────────────────────────────────────────────────────────────────────┤
│   2   29172 C aljolje 10225MiB  86 100.0   0.5  20:35  /n/redta/rc043h/PYTORCHY/miniconda2/envs/py3.9_torch1.10_cuda11.3/bin/p.. │
╘════════════════════════════════════════════════════════════════════════════════════════════════════════════════════════════════════╛
root@hydra4 aide# pip3 install --upgrade py3nvml
Requirement already up-to-date: py3nvml in /usr/local/lib/python3.8/dist-packages (0.2.7)
Requirement already satisfied, skipping upgrade: xmltodict in /usr/local/lib/python3.8/dist-packages (from py3nvml) (0.12.0)
root@hydra4 aide# pip3 install --upgrade pynvml
Requirement already up-to-date: pynvml in /usr/local/lib/python3.8/dist-packages (11.4.1)

Rendering issues caused by locale settings

Runtime Environment

  • Operating system and version: Arch Linux x86_64
  • Terminal emulator and version: Alacritty 0.8.0 (a1b13e68)
  • Python version: Python 3.9.6
  • NVML/CUDA version: nvidia-smi: 465.31 / 11.3
  • nvitop version/commit: 0.3.5.6
  • python-ml-py version: 11.450.51
  • Locale: USA

Current Behavior

  1. After following installation instructions running nvitop command does not work, bash cannot find the command. However, python -m nvitop does work. Added /home/user_name/.local/bin to enable nvitop command to work.
  2. nvitop command prints as expected, however, nvitop -m colored graphs and formatting for CPU and MEM aren't showing correctly.

side x side comparison "nvitop -m"(left) vs "nvitop("right)
image

Expected Behavior

  1. nvitop install would set up env var so that command works immediately after install
  2. CPU and MEM graphical representation of % used would show and format would match that of nvitop command.

Possible Solutions

  1. nvitop install to check/add env var or ReadMe should note for the end-user to check this
  2. I'm not sure :(

Steps to reproduce

  1. Remove user-added env path, open terminal, and run nvitop

  2. Run nvitop -m or python3 -m nvitop -m

'python setup.py test' fails

Runtime Environment

  • Operating system and version: [e.g. Ubuntu 20.04 LTS / Windows 10 Build 19043.1110]
  • Terminal emulator and version: kitty terminal
  • Python version: 3.10.7
  • nvitop version or commit: 0.10.0
  • python-ml-py version: 11.515.75
  • Locale: en_US.UTF-8

Current Behavior

The python setup.py test command fails.

nvitop on  main  3.10.7 (venv) took 16s 
❯ python setup.py test   
/home/gaetan/downloads/nvitop/venv/lib/python3.10/site-packages/setuptools/config/pyprojecttoml.py:104: _BetaConfiguration: Support for `[tool.setuptools]` in `pyproject.toml` is still *beta*.
  warnings.warn(msg, _BetaConfiguration)
running test
WARNING: Testing via this command is deprecated and will be removed in a future version. Users looking for a generic test entry point independent of test runner are encouraged to use tox.
running egg_info
writing nvitop.egg-info/PKG-INFO
writing dependency_links to nvitop.egg-info/dependency_links.txt
writing entry points to nvitop.egg-info/entry_points.txt
writing requirements to nvitop.egg-info/requires.txt
writing top-level names to nvitop.egg-info/top_level.txt
reading manifest file 'nvitop.egg-info/SOURCES.txt'
adding license file 'LICENSE'
writing manifest file 'nvitop.egg-info/SOURCES.txt'
running build_ext
Traceback (most recent call last):
  File "/home/gaetan/downloads/nvitop/setup.py", line 44, in <module>
    setup(
  File "/home/gaetan/downloads/nvitop/venv/lib/python3.10/site-packages/setuptools/__init__.py", line 87, in setup
    return distutils.core.setup(**attrs)
  File "/home/gaetan/downloads/nvitop/venv/lib/python3.10/site-packages/setuptools/_distutils/core.py", line 177, in setup
    return run_commands(dist)
  File "/home/gaetan/downloads/nvitop/venv/lib/python3.10/site-packages/setuptools/_distutils/core.py", line 193, in run_commands
    dist.run_commands()
  File "/home/gaetan/downloads/nvitop/venv/lib/python3.10/site-packages/setuptools/_distutils/dist.py", line 968, in run_commands
    self.run_command(cmd)
  File "/home/gaetan/downloads/nvitop/venv/lib/python3.10/site-packages/setuptools/dist.py", line 1217, in run_command
    super().run_command(command)
  File "/home/gaetan/downloads/nvitop/venv/lib/python3.10/site-packages/setuptools/_distutils/dist.py", line 987, in run_command
    cmd_obj.run()
  File "/home/gaetan/downloads/nvitop/venv/lib/python3.10/site-packages/setuptools/command/test.py", line 224, in run
    self.run_tests()
  File "/home/gaetan/downloads/nvitop/venv/lib/python3.10/site-packages/setuptools/command/test.py", line 227, in run_tests
    test = unittest.main(
  File "/nix/store/9srs642k875z3qdk8glapjycncf2pa51-python3-3.10.7/lib/python3.10/unittest/main.py", line 100, in __init__
    self.parseArgs(argv)
  File "/nix/store/9srs642k875z3qdk8glapjycncf2pa51-python3-3.10.7/lib/python3.10/unittest/main.py", line 124, in parseArgs
    self._do_discovery(argv[2:])
  File "/nix/store/9srs642k875z3qdk8glapjycncf2pa51-python3-3.10.7/lib/python3.10/unittest/main.py", line 244, in _do_discovery
    self.createTests(from_discovery=True, Loader=Loader)
  File "/nix/store/9srs642k875z3qdk8glapjycncf2pa51-python3-3.10.7/lib/python3.10/unittest/main.py", line 154, in createTests
    self.test = loader.discover(self.start, self.pattern, self.top)
  File "/nix/store/9srs642k875z3qdk8glapjycncf2pa51-python3-3.10.7/lib/python3.10/unittest/loader.py", line 349, in discover
    tests = list(self._find_tests(start_dir, pattern))
  File "/nix/store/9srs642k875z3qdk8glapjycncf2pa51-python3-3.10.7/lib/python3.10/unittest/loader.py", line 405, in _find_tests
    tests, should_recurse = self._find_test_path(
  File "/nix/store/9srs642k875z3qdk8glapjycncf2pa51-python3-3.10.7/lib/python3.10/unittest/loader.py", line 483, in _find_test_path
    tests = self.loadTestsFromModule(package, pattern=pattern)
  File "/home/gaetan/downloads/nvitop/venv/lib/python3.10/site-packages/setuptools/command/test.py", line 57, in loadTestsFromModule
    tests.append(self.loadTestsFromName(submodule))
  File "/nix/store/9srs642k875z3qdk8glapjycncf2pa51-python3-3.10.7/lib/python3.10/unittest/loader.py", line 191, in loadTestsFromName
    return self.loadTestsFromModule(obj)
  File "/home/gaetan/downloads/nvitop/venv/lib/python3.10/site-packages/setuptools/command/test.py", line 57, in loadTestsFromModule
    tests.append(self.loadTestsFromName(submodule))
  File "/nix/store/9srs642k875z3qdk8glapjycncf2pa51-python3-3.10.7/lib/python3.10/unittest/loader.py", line 211, in loadTestsFromName
    raise TypeError("calling %s returned %s, not a test" %
TypeError: calling <function libcurses at 0x7f9252eb5750> returned <contextlib._GeneratorContextManager object at 0x7f9252ef06a0>, not a test

Expected Behavior

The test command succeeds.

Context

I was trying to package nvitop for NixOS.
The installation process for python applications calls python setup.py test by default.

Steps to Reproduce

  1. python setup.py test

[Enhancement] Backward compatible NVML Python bindings

Runtime Environment

  • Operating system and version: Ubuntu 20.04 LTS
  • Terminal emulator and version: GNOME Terminal 3.36.2
  • Python version: 3.9.13
  • NVML version (driver version): 470.129.06
  • nvitop version or commit: v0.7.1
  • python-ml-py version: 11.450.51
  • Locale: en_US.UTF-8

Context

The official NVML Python bindings (PyPI package nvidia-ml-py) do not guarantee backward compatibility for different NVIDIA drivers. For example, NVML added nvmlDeviceGetComputeRunningProcesses_v2 and nvmlDeviceGetGraphicsRunningProcesses_v2 in CUDA 11.x drivers (R450+). But the package nvidia-ml-py arbitrary call the latest version of the function in the unversioned function:

def nvmlDeviceGetComputeRunningProcesses_v2(handle):
    # first call to get the size
    c_count = c_uint(0)
    fn = _nvmlGetFunctionPointer("nvmlDeviceGetComputeRunningProcesses_v2")
    ret = fn(handle, byref(c_count), None)

    ...

def nvmlDeviceGetComputeRunningProcesses(handle):
    return nvmlDeviceGetComputeRunningProcesses_v2(handle);

This will cause NVMLError_FunctionNotFound error on CUDA 10.x drivers (e.g. R430).

Now there are the v3 version of nvmlDeviceGet{Compute,Graphics,MPSCompute}RunningProcesses functions come with the R510+ drivers. E.g., in nvidia-ml-py==11.515.48:

def nvmlDeviceGetComputeRunningProcesses_v3(handle):
    # first call to get the size
    c_count = c_uint(0)
    fn = _nvmlGetFunctionPointer("nvmlDeviceGetComputeRunningProcesses_v3")
    ret = fn(handle, byref(c_count), None)

    ...

def nvmlDeviceGetComputeRunningProcesses(handle):
    return nvmlDeviceGetComputeRunningProcesses_v3(handle)

The v2 version of c_nvmlMemory_v2_t is appearing on the horizon (not found in R510 driver yet). This causes issue #13.

class c_nvmlMemory_t(_PrintableStructure):
    _fields_ = [
        ('total', c_ulonglong),
        ('free', c_ulonglong),
        ('used', c_ulonglong),
    ]
    _fmt_ = {'<default>': "%d B"}

class c_nvmlMemory_v2_t(_PrintableStructure):
    _fields_ = [
        ('version', c_uint),
        ('total', c_ulonglong),
        ('reserved', c_ulonglong),
        ('free', c_ulonglong),
        ('used', c_ulonglong),
    ]
    _fmt_ = {'<default>': "%d B"}

nvmlMemory_v2 = 0x02000028
def nvmlDeviceGetMemoryInfo(handle, version=None):
    if not version:
        c_memory = c_nvmlMemory_t()
        fn = _nvmlGetFunctionPointer("nvmlDeviceGetMemoryInfo")
    else:
        c_memory = c_nvmlMemory_v2_t()
        c_memory.version = version
        fn = _nvmlGetFunctionPointer("nvmlDeviceGetMemoryInfo_v2")
    ret = fn(handle, byref(c_memory))
    _nvmlCheckReturn(ret)
    return c_memory

Possible Solutions

  1. Determine the best dependency version of nvidia-ml-py during installation.

    This requires the user to install the NVIDIA driver first, which may not be fulfilled on a freshly installed system. Besides, it's hard to list this driver dependency in the package metadata.

  2. Wait for the PyPI package nvidia-ml-py to become backward compatible.

    The package NVIDIA/go-nvml offers backward compatible APIs:

    The API is designed to be backwards compatible, so the latest bindings should work with any version of libnvidia-ml.so installed on your system.

    I posted this on the NVIDIA developer forums [PyPI/nvidia-ml-py] Issue Reports for nvidia-ml-py but did not get any official response yet.

  3. Vender the nvidia-ml-py in nvitop. (Note: nvidia-ml-py is released under the BSD License)

    This requires bumping the vendered version and making a minor release of nvitop each time a new version of nvidia-ml-py comes out.

  4. Automatically patch the pynvml module when the first call fails when calling the versioned APIs. This can achieve by manipulating the __dict__ attribute or the module.__class__ attribute.

    The goal of this solution is not to make fully backward-compatible Python bindings. That may be out of the scope of nvitop, e.g. ExcludedDeviceInfo -> BlacklistDeviceInfo. Also, note that this solution may cause performance issues for a much deeper call stack.

[Question] `nvitop` runs non-dynamically inside `slurm` jobs

Runtime Environment

  • Operating system and version: CentOS 7.4
  • Python version: 3.8.13
  • NVML version (driver version): 470.63
  • nvitop version or commit: 0.7.2
  • python-ml-py version: 11.450.51
  • Locale: zh_CN.UTF-8

Current Behavior

Query the GPU usage of the computing node through Slurm, and the output is displayed statically

Images / Videos

b1d1d04c16ca93fbd7d9fa39a2ac273

[Question] Custom criteria for `select_devices`

Required prerequisites

  • I have searched the Issue Tracker that this hasn't already been reported. (comment there if it has.)
  • I have tried the latest version of nvitop in a new isolated virtual environment.

Motivation

Can "select_devices" be updated to specify a GPU and policy? If the policy is set to "queue", the specified GPU can be held until it meets the requirements.

Solution

No response

Alternatives

No response

Additional context

No response

[Question] Which processes are using GPU memory?

What command(s) will be able to tell which process(es) are using GPU memory?

Runtime Environment

  • Operating system and version: Ubuntu 22.04 LTS
  • Terminal emulator and version: gnome-desktop3-data/jammy-updates,jammy-updates,now 42.1-0ubuntu1 all [installed]
  • Python version: 3.10.4
  • NVML version (driver version): 510.73.05
  • nvitop version or commit: nvitop 0.5.6
  • python-ml-py version: ??? what is that?
  • Locale: en_US.UTF-8

Current Behavior

working fine...

Expected Behavior

Looking forward to check which processes are using GPU memory ???

Context

N/A

Possible Solutions

N/A

Steps to Reproduce

Just run it...

nvitop

Traceback

Images / Videos

N/A

[BUG] Cannot gather infomation of the `/XWayland` process in WSLg

Required prerequisites

  • I have read the documentation https://nvitop.readthedocs.io.
  • I have searched the Issue Tracker that this hasn't already been reported. (comment there if it has.)
  • I have tried the latest version of nvitop in an new isolated virtual environment.

What version of nvitop are you using?

0.11.0

Operating system and version

Windows 10 build 10.0.19045.0

NVIDIA driver version

526.98

NVIDIA-SMI

Sat Dec 10 20:36:09 2022
+-----------------------------------------------------------------------------+
| NVIDIA-SMI 525.60.02    Driver Version: 526.98       CUDA Version: 12.0     |
|-------------------------------+----------------------+----------------------+
| GPU  Name        Persistence-M| Bus-Id        Disp.A | Volatile Uncorr. ECC |
| Fan  Temp  Perf  Pwr:Usage/Cap|         Memory-Usage | GPU-Util  Compute M. |
|                               |                      |               MIG M. |
|===============================+======================+======================|
|   0  NVIDIA GeForce ...  On   | 00000000:09:00.0  On |                  N/A |
|  0%   56C    P3    34W / 240W |   2880MiB /  8192MiB |      7%      Default |
|                               |                      |                  N/A |
+-------------------------------+----------------------+----------------------+

+-----------------------------------------------------------------------------+
| Processes:                                                                  |
|  GPU   GI   CI        PID   Type   Process name                  GPU Memory |
|        ID   ID                                                   Usage      |
|=============================================================================|
|    0   N/A  N/A        23      G   /Xwayland                       N/A      |
+-----------------------------------------------------------------------------+

Python environment

$ python3 -m pip freeze | python3 -c 'import sys; print(sys.version, sys.platform); print("".join(filter(lambda s: any(word in s.lower() for word in ("nvi", "cuda", "nvml", "gpu")), sys.stdin)))'
3.10.8 (main, Oct 11 2022, 11:35:05) [GCC 11.2.0] linux
nvidia-ml-py==11.515.75
nvitop==0.11.0

Problem description

The XWayland process in WSLg uses the NVIDIA GPU in the WSL instance. However, WSL does not expose the process in the /proc directory. So the psutil fails to gather process information by reading the files under /proc/23.

Steps to Reproduce

Command lines:

$ wsl.exe --shutdown
$ wsl.exe --update
$ wsl.exe
user@WSL $ nvitop

Traceback

No response

Logs

$ nvitop -1
Sat Dec 10 12:35:33 2022
╒═════════════════════════════════════════════════════════════════════════════╕
│ NVITOP 0.11.0        Driver Version: 526.98       CUDA Driver Version: 12.0 │
├───────────────────────────────┬──────────────────────┬──────────────────────┤
│ GPU  Name        Persistence-M│ Bus-Id        Disp.A │ Volatile Uncorr. ECC │
│ Fan  Temp  Perf  Pwr:Usage/Cap│         Memory-Usage │ GPU-Util  Compute M. │
╞═══════════════════════════════╪══════════════════════╪══════════════════════╪════════════════════╕
│   0  GeForce RTX 3070    On   │ 00000000:09:00.0  On │                  N/A │ MEM: ███▏ 34.7%    │
│  0%   55C    P3    30W / 240W │    2844MiB / 8192MiB │     49%      Default │ UTL: ████▍ 49%     │
╘═══════════════════════════════╧══════════════════════╧══════════════════════╧════════════════════╛
[ CPU: █▌ 3.1%                                                ]  ( Load Average:  0.08  0.02  0.01 )
[ MEM: ██▎ 4.5%                                               ]  [ SWP: ▏ 0.0%                     ]

╒══════════════════════════════════════════════════════════════════════════════════════════════════╕
│ Processes:                                                       PanXuehai@BIGAI-PanXuehai (WSL) │
│ GPU     PID      USER  GPU-MEM %SM  %CPU  %MEM  TIME  COMMAND                                    │
╞══════════════════════════════════════════════════════════════════════════════════════════════════╡
│   0      23 G     N/A WDDM:N/A N/A   N/A   N/A   N/A  No Such Process                            │
╘══════════════════════════════════════════════════════════════════════════════════════════════════╛

Screenshot:

image

Expected behavior

Show the process information rather than N/A and No Such Process.

Additional context

I have raised an issue in microsoft/wslg#919.

[BUG] PIDs are scrambled and `No Such Process` is printed since update to NVIDIA drivers

Required prerequisites

  • I have read the documentation https://nvitop.readthedocs.io.
  • I have searched the Issue Tracker that this hasn't already been reported. (comment there if it has.)
  • I have tried the latest version of nvitop in a new isolated virtual environment.

What version of nvitop are you using?

git hash 4093334972a334e9057f5acf7661a2c1a96bd021

Operating system and version

Docker image (under Centos 7 host)

NVIDIA driver version

535.54.03

NVIDIA-SMI

+---------------------------------------------------------------------------------------+
| NVIDIA-SMI 535.54.03              Driver Version: 535.54.03    CUDA Version: 12.2     |
|-----------------------------------------+----------------------+----------------------+
| GPU  Name                 Persistence-M | Bus-Id        Disp.A | Volatile Uncorr. ECC |
| Fan  Temp   Perf          Pwr:Usage/Cap |         Memory-Usage | GPU-Util  Compute M. |
|                                         |                      |               MIG M. |
|=========================================+======================+======================|
|   0  NVIDIA GeForce GTX 1080 Ti     On  | 00000000:02:00.0 Off |                  N/A |
| 23%   45C    P2              57W / 250W |   2658MiB / 11264MiB |     32%      Default |
|                                         |                      |                  N/A |
+-----------------------------------------+----------------------+----------------------+
|   1  NVIDIA GeForce GTX 1080 Ti     On  | 00000000:82:00.0 Off |                  N/A |
| 24%   45C    P2              55W / 250W |   3430MiB / 11264MiB |      0%      Default |
|                                         |                      |                  N/A |
+-----------------------------------------+----------------------+----------------------+

+---------------------------------------------------------------------------------------+
| Processes:                                                                            |
|  GPU   GI   CI        PID   Type   Process name                            GPU Memory |
|        ID   ID                                                             Usage      |
|=======================================================================================|
|    0   N/A  N/A      2863      C   /opt/deepdetect/build/main/dede            1656MiB |
|    0   N/A  N/A      4520      C   /opt/deepdetect/build/main/dede             368MiB |
|    0   N/A  N/A      5001      C   /opt/deepdetect/build/main/dede             630MiB |
|    1   N/A  N/A      3267      C   /opt/deepdetect/build/main/dede             438MiB |
|    1   N/A  N/A      3675      C   /opt/deepdetect/build/main/dede             308MiB |
|    1   N/A  N/A      4072      C   /opt/deepdetect/build/main/dede            2314MiB |
|    1   N/A  N/A      5565      C   /opt/deepdetect/build/main/dede             366MiB |
+---------------------------------------------------------------------------------------+

Python environment

This is the docker version from the latest git head (6/20/2023)

$ sudo docker run -it --rm --runtime=nvidia --gpus=all --pid=host --entrypoint /bin/bash nvitop:4093334972a334e9057f5acf7661a2c1a96bd021
(venv) root@ad4380048e10:/nvitop# python3 -m pip freeze | python3 -c 'import sys; print(sys.version, sys.platform); print("".join(filter(lambda s: any(word in s.lower() for word in ("nvi", "cuda", "nvml", "gpu")), sys.stdin)))'
3.8.10 (default, May 26 2023, 14:05:08)
[GCC 9.4.0] linux
nvidia-ml-py==11.525.112
nvitop @ file:///nvitop

(venv) root@ad4380048e10:/nvitop#

Problem description

The output shows scrambled PIDs for processes after the initial process in the lists for each card, and then shows No Such Process for the wrong PIDs. This only started after the driver update, so I assume something is changed in the nvidia drivers.

Steps to Reproduce

The Python snippets (if any):

Command lines:

$ sudo docker run -it --rm --runtime=nvidia --gpus=all --pid=host nvitop:4093334972a334e9057f5acf7661a2c1a96bd021 --once
Tue Jun 20 18:35:07 2023
╒═════════════════════════════════════════════════════════════════════════════╕
│ NVITOP 1.1.2       Driver Version: 535.54.03      CUDA Driver Version: 12.2 │
├───────────────────────────────┬──────────────────────┬──────────────────────┤
│ GPU  Name        Persistence-M│ Bus-Id        Disp.A │ Volatile Uncorr. ECC │
│ Fan  Temp  Perf  Pwr:Usage/Cap│         Memory-Usage │ GPU-Util  Compute M. │
╞═══════════════════════════════╪══════════════════════╪══════════════════════╪════════════════════════════════════════════════════════════════════╕
│   0  ..orce GTX 1080 Ti  On   │ 00000000:02:00.0 Off │                  N/A │ MEM: █████████████▍ 23.5%                                          │
│ 28%   42C    P8     9W / 250W │   2650MiB / 11264MiB │      0%      Default │ UTL: ▏ 0%                                                          │
├───────────────────────────────┼──────────────────────┼──────────────────────┼────────────────────────────────────────────────────────────────────┤
│   1  ..orce GTX 1080 Ti  On   │ 00000000:82:00.0 Off │                  N/A │ MEM: █████████████████▍ 30.5%                                      │
│ 29%   44C    P8    10W / 250W │   3430MiB / 11264MiB │      0%      Default │ UTL: ▏ 0%                                                          │
╘═══════════════════════════════╧══════════════════════╧══════════════════════╧════════════════════════════════════════════════════════════════════╛
[ CPU: ██████████████████████████████████████████████████████████████████████████████████████████████████ MAX ]  ( Load Average: 71.03 39.83 35.33 )
[ MEM: ███████████████▊ 16.1%                                                                   USED: 9.49GiB ]  [ SWP: ▏ 0.0%                     ]

╒══════════════════════════════════════════════════════════════════════════════════════════════════════════════════════════════════════════════════╕
│ Processes:                                                                                                                     root@2f027c15efb1 │
│ GPU     PID      USER  GPU-MEM %SM  %CPU  %MEM     TIME  COMMAND                                                                                 │
╞══════════════════════════════════════════════════════════════════════════════════════════════════════════════════════════════════════════════════╡
│   0    2863 C    1000  1648MiB   0   0.0   1.8  2:15:55  /opt/deepdetect/build/main/dede -host 0.0.0.0 -port 8080 a652c745cc9b placeshybrid      │
│   0       0 C     N/A     4KiB   0   N/A   N/A      N/A  No Such Process                                                                         │
│   0 429496. C     N/A       0B   0   N/A   N/A      N/A  No Such Process                                                                         │
├──────────────────────────────────────────────────────────────────────────────────────────────────────────────────────────────────────────────────┤
│   1    3267 C    1000   438MiB N/A   0.0   1.3  2:15:18  /opt/deepdetect/build/main/dede -host 0.0.0.0 -port 8080 bf55e7b22839 inceptionresnetv2 │
│   1       0 C     N/A     4KiB N/A   N/A   N/A      N/A  No Such Process                                                                         │
│   1 242640. C     N/A      N/A N/A   N/A   N/A      N/A  No Such Process                                                                         │
│   1 429496. C     N/A       0B N/A   N/A   N/A      N/A  No Such Process                                                                         │
╘══════════════════════════════════════════════════════════════════════════════════════════════════════════════════════════════════════════════════╛

Traceback

No response

Logs

$ sudo docker run -it --rm --runtime=nvidia --gpus=all --pid=host -e LOGLEVEL=debug nvitop:4093334972a334e9057f5acf7661a2c1a96bd021 --once
[DEBUG] 2023-06-20 18:35:57,178 nvitop.api.libnvml::nvmlDeviceGetMemoryInfo: NVML memory info version 2 is available.
Tue Jun 20 18:35:57 2023
╒═════════════════════════════════════════════════════════════════════════════╕
│ NVITOP 1.1.2       Driver Version: 535.54.03      CUDA Driver Version: 12.2 │
├───────────────────────────────┬──────────────────────┬──────────────────────┤
│ GPU  Name        Persistence-M│ Bus-Id        Disp.A │ Volatile Uncorr. ECC │
│ Fan  Temp  Perf  Pwr:Usage/Cap│         Memory-Usage │ GPU-Util  Compute M. │
╞═══════════════════════════════╪══════════════════════╪══════════════════════╪════════════════════════════════════════════════════════════════════╕
│   0  ..orce GTX 1080 Ti  On   │ 00000000:02:00.0 Off │                  N/A │ MEM: █████████████▍ 23.5%                                          │
│ 24%   35C    P8     8W / 250W │   2650MiB / 11264MiB │      0%      Default │ UTL: ▏ 0%                                                          │
├───────────────────────────────┼──────────────────────┼──────────────────────┼────────────────────────────────────────────────────────────────────┤
│   1  ..orce GTX 1080 Ti  On   │ 00000000:82:00.0 Off │                  N/A │ MEM: █████████████████▍ 30.5%                                      │
│ 25%   36C    P8     9W / 250W │   3430MiB / 11264MiB │      0%      Default │ UTL: ▏ 0%                                                          │
╘═══════════════════════════════╧══════════════════════╧══════════════════════╧════════════════════════════════════════════════════════════════════╛
[ CPU: █████████████████████████████████████████████████████████████████████████████████████████████████▊ MAX ]  ( Load Average: 84.50 48.19 38.40 )
[ MEM: ███████████████▋ 15.9%                                                                   USED: 9.36GiB ]  [ SWP: ▏ 0.0%                     ]

╒══════════════════════════════════════════════════════════════════════════════════════════════════════════════════════════════════════════════════╕
│ Processes:                                                                                                                     root@333a2a93dbb1 │
│ GPU     PID      USER  GPU-MEM %SM  %CPU  %MEM     TIME  COMMAND                                                                                 │
╞══════════════════════════════════════════════════════════════════════════════════════════════════════════════════════════════════════════════════╡
│   0    2863 C    1000  1648MiB   0   0.0   1.8  2:16:45  /opt/deepdetect/build/main/dede -host 0.0.0.0 -port 8080 a652c745cc9b placeshybrid      │
│   0       0 C     N/A     4KiB   0   N/A   N/A      N/A  No Such Process                                                                         │
│   0 429496. C     N/A       0B   0   N/A   N/A      N/A  No Such Process                                                                         │
├──────────────────────────────────────────────────────────────────────────────────────────────────────────────────────────────────────────────────┤
│   1    3267 C    1000   438MiB N/A   0.0   1.3  2:16:08  /opt/deepdetect/build/main/dede -host 0.0.0.0 -port 8080 bf55e7b22839 inceptionresnetv2 │
│   1       0 C     N/A     4KiB N/A   N/A   N/A      N/A  No Such Process                                                                         │
│   1 242640. C     N/A      N/A N/A   N/A   N/A      N/A  No Such Process                                                                         │
│   1 429496. C     N/A       0B N/A   N/A   N/A      N/A  No Such Process                                                                         │
╘══════════════════════════════════════════════════════════════════════════════════════════════════════════════════════════════════════════════════╛

Expected behavior

Prior to the driver update, the information was present for the same PIDs included in nvidia-smi but with the full commandlines and the per-process resource statistics (e.g. GPU PID USER GPU-MEM %SM %CPU %MEM TIME). Now it seems to be having an issue parsing proper PIDs from the nvidia libraries, and then failing downstream from there.

Additional context

I'm not much of a Python programmer unfortunately so I'm not clear where to dig in, but I'd assume the issue is somewhere in the area of receiving the process list for the cards and deciphering the PIDs. My assumption is that something changed in the driver or some structure or class such that parsing code seems to have broken somewhere.

[BUG] (Windows) nvitop lists no processes; OverflowError: Python int too large to convert to C long

Required prerequisites

  • I have read the documentation https://nvitop.readthedocs.io.
  • I have searched the Issue Tracker that this hasn't already been reported. (comment there if it has.)
  • I have tried the latest version of nvitop in a new isolated virtual environment.

What version of nvitop are you using?

1.1.2

Operating system and version

Windows 10 Build 19045.2965

NVIDIA driver version

535.98.0

NVIDIA-SMI

Tue Jun 20 15:48:35 2023
+---------------------------------------------------------------------------------------+
| NVIDIA-SMI 535.98                 Driver Version: 535.98       CUDA Version: 12.2     |
|-----------------------------------------+----------------------+----------------------+
| GPU  Name                     TCC/WDDM  | Bus-Id        Disp.A | Volatile Uncorr. ECC |
| Fan  Temp   Perf          Pwr:Usage/Cap |         Memory-Usage | GPU-Util  Compute M. |
|                                         |                      |               MIG M. |
|=========================================+======================+======================|
|   0  NVIDIA GeForce GTX 1070      WDDM  | 00000000:01:00.0  On |                  N/A |
|  6%   64C    P0              39W / 151W |   864MiB /  8192MiB |     10%      Default |
|                                         |                      |                  N/A |
+-----------------------------------------+----------------------+----------------------+

+---------------------------------------------------------------------------------------+
| Processes:                                                                            |
|  GPU   GI   CI        PID   Type   Process name                            GPU Memory |
|        ID   ID                                                             Usage      |
|=======================================================================================|
|    0   N/A  N/A      5184    C+G   C:\Windows\explorer.exe                   N/A      |
|    0   N/A  N/A      6552    C+G   ....Search_cw5n1h2txyewy\SearchApp.exe    N/A      |
|    0   N/A  N/A      9468    C+G   ...on\114.0.1823.51\msedgewebview2.exe    N/A      |
|    0   N/A  N/A     12416    C+G   ...m Files\Mozilla Firefox\firefox.exe    N/A      |
|    0   N/A  N/A     12988    C+G   ...on\114.0.1823.43\msedgewebview2.exe    N/A      |
|    0   N/A  N/A     17368    C+G   ...5n1h2txyewy\ShellExperienceHost.exe    N/A      |
|    0   N/A  N/A     22068    C+G   ...\cef\cef.win7x64\steamwebhelper.exe    N/A      |
|    0   N/A  N/A     22768    C+G   ...al\Discord\app-1.0.9013\Discord.exe    N/A      |
|    0   N/A  N/A     24012    C+G   ....Search_cw5n1h2txyewy\SearchApp.exe    N/A      |
|    0   N/A  N/A     24780    C+G   ...CBS_cw5n1h2txyewy\TextInputHost.exe    N/A      |
|    0   N/A  N/A     28860    C+G   ...m Files\Mozilla Firefox\firefox.exe    N/A      |
+---------------------------------------------------------------------------------------+

Python environment

Installed with a virtual environment via python -m venv which downloaded cachetools-5.3.1 colorama-0.4.6 nvidia-ml-py-11.525.112 nvitop-1.1.2 psutil-5.9.5 termcolor-2.3.0 windows-curses-2.3.1

3.11.4 (tags/v3.11.4:d2340ef, Jun 7 2023, 05:45:37) [MSC v.1934 64 bit (AMD64)] win32

Problem description

Running nvitop doesn't list processes and says Gathering process status forever. After quitting the program, there are OverflowError errors.

Steps to Reproduce

Just ran nvitop within the virtual environment.

Traceback

Exception in thread process-snapshot-daemon:
Traceback (most recent call last):
  File "C:\Python311\Lib\threading.py", line 1038, in _bootstrap_inner
    self.run()
  File "C:\Python311\Lib\threading.py", line 975, in run
    self._target(*self._args, **self._kwargs)
  File "D:\test\venv\Lib\site-packages\nvitop\gui\screens\main\process.py", line 281, in _snapshot_target
    self.take_snapshots()
  File "D:\test\venv\Lib\site-packages\cachetools\__init__.py", line 702, in wrapper
    v = func(*args, **kwargs)
        ^^^^^^^^^^^^^^^^^^^^^
  File "D:\test\venv\Lib\site-packages\nvitop\gui\screens\main\process.py", line 256, in take_snapshots
    snapshots = GpuProcess.take_snapshots(self.processes, failsafe=True)
                                          ^^^^^^^^^^^^^^
  File "D:\test\venv\Lib\site-packages\nvitop\gui\screens\main\process.py", line 305, in processes
    return list(
           ^^^^^
  File "D:\test\venv\Lib\site-packages\nvitop\gui\screens\main\process.py", line 306, in <genexpr>
    itertools.chain.from_iterable(device.processes().values() for device in self.devices),
                                  ^^^^^^^^^^^^^^^^^^
  File "D:\test\venv\Lib\site-packages\nvitop\api\device.py", line 1661, in processes
    proc = processes[p.pid] = self.GPU_PROCESS_CLASS(
                              ^^^^^^^^^^^^^^^^^^^^^^^
  File "D:\test\venv\Lib\site-packages\nvitop\gui\library\process.py", line 26, in __new__
    instance = super().__new__(cls, *args, **kwargs)
               ^^^^^^^^^^^^^^^^^^^^^^^^^^^^^^^^^^^^^
  File "D:\test\venv\Lib\site-packages\nvitop\api\process.py", line 474, in __new__
    instance._host = HostProcess(pid)
                     ^^^^^^^^^^^^^^^^
  File "D:\test\venv\Lib\site-packages\nvitop\api\process.py", line 204, in __new__
    host.Process._init(instance, pid, True)
  File "D:\test\venv\Lib\site-packages\psutil\__init__.py", line 361, in _init
    self.create_time()
  File "D:\test\venv\Lib\site-packages\psutil\__init__.py", line 719, in create_time
    self._create_time = self._proc.create_time()
                        ^^^^^^^^^^^^^^^^^^^^^^^^
  File "D:\test\venv\Lib\site-packages\psutil\_pswindows.py", line 694, in wrapper
    return fun(self, *args, **kwargs)
           ^^^^^^^^^^^^^^^^^^^^^^^^^^
  File "D:\test\venv\Lib\site-packages\psutil\_pswindows.py", line 948, in create_time
    user, system, created = cext.proc_times(self.pid)
                            ^^^^^^^^^^^^^^^^^^^^^^^^^
OverflowError: Python int too large to convert to C long
Traceback (most recent call last):
  File "<frozen runpy>", line 198, in _run_module_as_main
  File "<frozen runpy>", line 88, in _run_code
  File "D:\test\venv\Scripts\nvitop.exe\__main__.py", line 7, in <module>
  File "D:\test\venv\Lib\site-packages\nvitop\cli.py", line 376, in main
    ui.print()
  File "D:\test\venv\Lib\site-packages\nvitop\gui\ui.py", line 203, in print
    self.main_screen.print()
  File "D:\test\venv\Lib\site-packages\nvitop\gui\screens\main\__init__.py", line 152, in print
    print_width = min(panel.print_width() for panel in self.container)
                  ^^^^^^^^^^^^^^^^^^^^^^^^^^^^^^^^^^^^^^^^^^^^^^^^^^^^
  File "D:\test\venv\Lib\site-packages\nvitop\gui\screens\main\__init__.py", line 152, in <genexpr>
    print_width = min(panel.print_width() for panel in self.container)
                      ^^^^^^^^^^^^^^^^^^^
  File "D:\test\venv\Lib\site-packages\nvitop\gui\screens\main\process.py", line 551, in print_width
    self.ensure_snapshots()
  File "D:\test\venv\Lib\site-packages\nvitop\gui\screens\main\process.py", line 252, in ensure_snapshots
    self.snapshots = self.take_snapshots()
                     ^^^^^^^^^^^^^^^^^^^^^
  File "D:\test\venv\Lib\site-packages\cachetools\__init__.py", line 702, in wrapper
    v = func(*args, **kwargs)
        ^^^^^^^^^^^^^^^^^^^^^
  File "D:\test\venv\Lib\site-packages\nvitop\gui\screens\main\process.py", line 256, in take_snapshots
    snapshots = GpuProcess.take_snapshots(self.processes, failsafe=True)
                                          ^^^^^^^^^^^^^^
  File "D:\test\venv\Lib\site-packages\nvitop\gui\screens\main\process.py", line 305, in processes
    return list(
           ^^^^^
  File "D:\test\venv\Lib\site-packages\nvitop\gui\screens\main\process.py", line 306, in <genexpr>
    itertools.chain.from_iterable(device.processes().values() for device in self.devices),
                                  ^^^^^^^^^^^^^^^^^^
  File "D:\test\venv\Lib\site-packages\nvitop\api\device.py", line 1661, in processes
    proc = processes[p.pid] = self.GPU_PROCESS_CLASS(
                              ^^^^^^^^^^^^^^^^^^^^^^^
  File "D:\test\venv\Lib\site-packages\nvitop\gui\library\process.py", line 26, in __new__
    instance = super().__new__(cls, *args, **kwargs)
               ^^^^^^^^^^^^^^^^^^^^^^^^^^^^^^^^^^^^^
  File "D:\test\venv\Lib\site-packages\nvitop\api\process.py", line 474, in __new__
    instance._host = HostProcess(pid)
                     ^^^^^^^^^^^^^^^^
  File "D:\test\venv\Lib\site-packages\nvitop\api\process.py", line 204, in __new__
    host.Process._init(instance, pid, True)
  File "D:\test\venv\Lib\site-packages\psutil\__init__.py", line 361, in _init
    self.create_time()
  File "D:\test\venv\Lib\site-packages\psutil\__init__.py", line 719, in create_time
    self._create_time = self._proc.create_time()
                        ^^^^^^^^^^^^^^^^^^^^^^^^
  File "D:\test\venv\Lib\site-packages\psutil\_pswindows.py", line 694, in wrapper
    return fun(self, *args, **kwargs)
           ^^^^^^^^^^^^^^^^^^^^^^^^^^
  File "D:\test\venv\Lib\site-packages\psutil\_pswindows.py", line 948, in create_time
    user, system, created = cext.proc_times(self.pid)
                            ^^^^^^^^^^^^^^^^^^^^^^^^^
OverflowError: Python int too large to convert to C long

Logs

Only change is the addition of this line:

[DEBUG] 2023-06-20 15:54:54,361 nvitop.api.libnvml::nvmlDeviceGetMemoryInfo: NVML memory info version 2 is available.

Expected behavior

I expected nvitop to list the processes similar to how running nvidia-smi does.

Additional context

image
(A few things in this screenshot were hidden for privacy purposes)

[Bug] Execution Freeze while using `CudaDevice.count()` in global scope

Required prerequisites

  • I have read the documentation https://nvitop.readthedocs.io.
  • I have searched the Issue Tracker that this hasn't already been reported. (comment there if it has.)
  • I have tried the latest version of nvitop in a new isolated virtual environment.

Questions

Upon calling print(CudaDevice.count()) I receive the following error and the execution gets stuck and have to interrupt it manually. Can you please guide ?
nvitop version 1.1.1
NVIDIA-SMI 470.182.03 Driver Version: 470.182.03 CUDA Version: 11.4


  File "schedule_clients.py", line 27, in <module>
    print(CudaDevice.count())
  File "/home/aradhya/anaconda3/envs/dreamfuse/lib/python3.9/site-packages/nvitop/api/device.py", line 2132, in count
    return len(super().parse_cuda_visible_devices())
  File "/home/aradhya/anaconda3/envs/dreamfuse/lib/python3.9/site-packages/nvitop/api/device.py", line 488, in parse_cuda_visible_devices
    return parse_cuda_visible_devices(cuda_visible_devices)
  File "/home/aradhya/anaconda3/envs/dreamfuse/lib/python3.9/site-packages/nvitop/api/device.py", line 2357, in parse_cuda_visible_devices
    return _parse_cuda_visible_devices(cuda_visible_devices, format='index')
  File "/home/aradhya/anaconda3/envs/dreamfuse/lib/python3.9/site-packages/nvitop/api/device.py", line 2491, in _parse_cuda_visible_devices
    raw_uuids = _parse_cuda_visible_devices_to_uuids(cuda_visible_devices, verbose=False)
  File "/home/aradhya/anaconda3/envs/dreamfuse/lib/python3.9/site-packages/nvitop/api/device.py", line 2616, in _parse_cuda_visible_devices_to_uuids
    parser.start()
  File "/home/aradhya/anaconda3/envs/dreamfuse/lib/python3.9/multiprocessing/process.py", line 121, in start
    self._popen = self._Popen(self)
  File "/home/aradhya/anaconda3/envs/dreamfuse/lib/python3.9/multiprocessing/context.py", line 284, in _Popen
    return Popen(process_obj)
  File "/home/aradhya/anaconda3/envs/dreamfuse/lib/python3.9/multiprocessing/popen_spawn_posix.py", line 32, in __init__
    super().__init__(process_obj)
  File "/home/aradhya/anaconda3/envs/dreamfuse/lib/python3.9/multiprocessing/popen_fork.py", line 19, in __init__
    self._launch(process_obj)
  File "/home/aradhya/anaconda3/envs/dreamfuse/lib/python3.9/multiprocessing/popen_spawn_posix.py", line 42, in _launch
    prep_data = spawn.get_preparation_data(process_obj._name)
  File "/home/aradhya/anaconda3/envs/dreamfuse/lib/python3.9/multiprocessing/spawn.py", line 154, in get_preparation_data
    _check_not_importing_main()
  File "/home/aradhya/anaconda3/envs/dreamfuse/lib/python3.9/multiprocessing/spawn.py", line 134, in _check_not_importing_main
    raise RuntimeError('''
RuntimeError: 
        An attempt has been made to start a new process before the
        current process has finished its bootstrapping phase.

        This probably means that you are not using fork to start your
        child processes and you have forgotten to use the proper idiom
        in the main module:

            if __name__ == '__main__':
                freeze_support()
                ...

        The "freeze_support()" line can be omitted if the program
        is not going to be frozen to produce an executable.
^CTraceback (most recent call last):
  File "/home/aradhya/stable-dreamfusionBkp/schedule_clients.py", line 27, in <module>
    print(CudaDevice.count())
  File "/home/aradhya/anaconda3/envs/dreamfuse/lib/python3.9/site-packages/nvitop/api/device.py", line 2132, in count
    return len(super().parse_cuda_visible_devices())
  File "/home/aradhya/anaconda3/envs/dreamfuse/lib/python3.9/site-packages/nvitop/api/device.py", line 488, in parse_cuda_visible_devices
    return parse_cuda_visible_devices(cuda_visible_devices)
  File "/home/aradhya/anaconda3/envs/dreamfuse/lib/python3.9/site-packages/nvitop/api/device.py", line 2357, in parse_cuda_visible_devices
    return _parse_cuda_visible_devices(cuda_visible_devices, format='index')
  File "/home/aradhya/anaconda3/envs/dreamfuse/lib/python3.9/site-packages/nvitop/api/device.py", line 2491, in _parse_cuda_visible_devices
    raw_uuids = _parse_cuda_visible_devices_to_uuids(cuda_visible_devices, verbose=False)
  File "/home/aradhya/anaconda3/envs/dreamfuse/lib/python3.9/site-packages/nvitop/api/device.py", line 2623, in _parse_cuda_visible_devices_to_uuids
    result = queue.get()
  File "/home/aradhya/anaconda3/envs/dreamfuse/lib/python3.9/multiprocessing/queues.py", line 365, in get
    res = self._reader.recv_bytes()
  File "/home/aradhya/anaconda3/envs/dreamfuse/lib/python3.9/multiprocessing/connection.py", line 216, in recv_bytes
    buf = self._recv_bytes(maxlength)
  File "/home/aradhya/anaconda3/envs/dreamfuse/lib/python3.9/multiprocessing/connection.py", line 414, in _recv_bytes
    buf = self._recv(4)
  File "/home/aradhya/anaconda3/envs/dreamfuse/lib/python3.9/multiprocessing/connection.py", line 379, in _recv
    chunk = read(handle, remaining)
KeyboardInterrupt

[Feature Request] Add support to AMD's ROCm GPU

Required prerequisites

  • I have searched the Issue Tracker that this hasn't already been reported. (comment there if it has.)
  • I have tried the latest version of nvitop in a new isolated virtual environment.

Motivation

I have been using nvitop for monitoring NVIDIA devices and processes, and I find it to be a great tool with a beautiful UI. Thank you for this good project!

However, I noticed that it doesn't support AMD's ROCm GPU platform. As an AMD user (we have an AMD GPU cluster), I can only use "rocm-smi" to monitor my GPU, and I would love to have a similar tool like nvitop for ROCm.

I believe that adding support for AMD's ROCm GPU would make nvitop a more versatile and inclusive monitoring tool. It would allow users who work with AMD GPUs to benefit from the same features and options that nvitop provides to NVIDIA users.

Solution

Using rocm-smi

Alternatives

No response

Additional context

No response

[Enhancement] Add confirm message box before sending signals to processes

Runtime Environment

  • Operating system and version: Ubuntu 20.04 LTS
  • Terminal emulator and version: Windows Terminal 1.14.2281.0
  • Python version: 3.10.6
  • NVML version (driver version): 515.65.01
  • nvitop version or commit: main@2f5c96
  • python-ml-py version: 11.495.46
  • Locale: en_US.UTF-8

Current Behavior

Kill/Terminate/Interrupt processes without a confirmation message.

Expected Behavior

Add a message box.

Context

The user may accidentally enable capslock and press the K / T / I key. Also, many users used to use the Ctrl-c key to exit the top monitor, which may interrupt the selected process.

Max memory clock methods point to current memory clock methods

"gpu_max_clock_graphics_mhz": gpu.max_graphics_clock(),
"gpu_max_clock_sm_mhz": gpu.max_sm_clock(),
"gpu_max_clock_memory_mhz": gpu.max_memory_clock(),
"gpu_max_clock_video_mhz": gpu.max_video_clock(),
    def max_graphics_clock(self) -> Union[int, NaType]:  # in MHz
        """Maximum frequency of graphics (shader) clock in MHz.

        Returns: Union[int, NaType]
            The maximum frequency of graphics (shader) clock in MHz, or :const:`nvitop.NA` when not applicable.

        Command line equivalent:

        .. code:: bash

            nvidia-smi --id=<IDENTIFIER> --format=csv,noheader,nounits --query-gpu=clocks.max.graphics
        """  # pylint: disable=line-too-long

        return self.clock_infos().graphics
    @memoize_when_activated
    @ttl_cache(ttl=5.0)
    def clock_infos(self) -> ClockInfos:  # in MHz
        """Returns a named tuple with current clock speeds (in MHz) for the device.

        Returns: ClockInfos(graphics, sm, memory, video)
            A named tuple with current clock speeds (in MHz) for the device, the item could be :const:`nvitop.NA` when not applicable.
        """  # pylint: disable=line-too-long

        return ClockInfos(
            graphics=libnvml.nvmlQuery(
                'nvmlDeviceGetClockInfo', self.handle, libnvml.NVML_CLOCK_GRAPHICS
            ),
            sm=libnvml.nvmlQuery('nvmlDeviceGetClockInfo', self.handle, libnvml.NVML_CLOCK_SM),
            memory=libnvml.nvmlQuery('nvmlDeviceGetClockInfo', self.handle, libnvml.NVML_CLOCK_MEM),
            video=libnvml.nvmlQuery(
                'nvmlDeviceGetClockInfo', self.handle, libnvml.NVML_CLOCK_VIDEO
            ),
        )

    clocks = clock_infos

Package conflicts with `nvidia-ml-py` (`pynvml.py`)

Runtime Environment

  • Operating system and version: [e.g. Ubuntu 20.04 LTS / Windows 10 Build 19043.1110]
  • Terminal emulator and version: [e.g. GNOME Terminal 3.36.2 / Windows Terminal 1.8.1521.0]
  • Python version: [e.g. 3.5.6 / 3.9.6]
  • NVML version (driver version): [e.g. 460.84]
  • nvitop version or commit: [e.g. 0.3.5.6 / main@b669fa3]
  • python-ml-py version: [e.g. 11.450.51]
  • Locale: [e.g. C / C.UTF-8 / en_US.UTF-8]

Current Behavior

image

Expected Behavior

run as previews

`nvitop` command not found after installation

Runtime Environment

  • Operating system and version: Windows 11 Pro version 21H2 (OS Build 22000.65)
  • Terminal emulator and version: Windows PowerShell 5.1.22000.65
  • Python version: 3.9.6
  • NVML/CUDA version: NVIDIA-SMI 471.21 Driver Version: 471.21 CUDA Version: 11.4
  • nvitop version/commit: 0.3.5.5
  • python-ml-py version: 11.450.51
  • Locale: ENG

Current Behavior

1 - After installing nvitop as instructed you cannot launch nvitop by running nvitop command in Windows Command Prompt or Windows PowerShell. The current solution is to use python -m nvitop command to run.

2 - Running nvitop using "python -m nvitop" produces error "ModuleNotFoundError: No module named '_curses'". The solution is to install windows-curses using pip3 install windows-curses

Expected Behavior

1 - nvitop command should be executable directly from Windows Command Prompt or Windows PowerShell after installation.

2 - pip should install all necessary packages needed for Windows such as windows-curses package.

Context

Unless you are experienced with Python this could be difficult for an average user.

Possible Solutions

1 - Use python -m nvitop to run nvitop or add to PATH

2 - Install windows-curses pip package after installation of nvitop

Steps to reproduce

  1. Install nvitop on Windows and try to run using nvitop command.

  2. After installation run nvitop with python -m nvitop command.

[Enhancement] Skip error gpus and show normal infos automatically

Runtime Environment

  • Operating system and version: Ubuntu 20.04 LTS
  • Terminal emulator and version: SSH
  • Python version: 3.8.10
  • NVML version (driver version): 515.65.01
  • nvitop version or commit: 0.10.0
  • nvidia-ml-py version: 11.515.75

Current Behavior

There are four GPUs on our server. And one of those was overheated for some reasons, which make that GPU cannot be recognized. If run nvidia-smi command without any args to query all the GPUs, error Unable to determine the device handle for GPU 0000:0C:00.0: Unknown Error will show without showing the remaining normal GPUs' infos. But if the command assigns the normal GPUs (nvidia-smi -i 0,1,3), all infos of the normal GPUs can be shown directly.

image

image

And if I use nvitop command to show the GPUs' infos, nvidia-ml-py will throw exceptions like this below,

image

image

Expected Behavior

I hope that with nvitop command, all the GPUs with errors can be skipped automatically, and show the normal GPUs' infos. If possible, maybe the error GPUs' info can be shown as tips below the normal infos using red fonts for emphasizing.

[Feature Request] Add support for PCIE throughput and NVLink throughput

Required prerequisites

  • I have searched the Issue Tracker that this hasn't already been reported. (comment there if it has.)
  • I have tried the latest version of nvitop in a new isolated virtual environment.

Motivation

It would be nice to be able to monitor throughput between CPU & GPU, and that between different GPUs.

like in Jupyter Lab - GPU dashboards, https://developer.nvidia.com/blog/gpu-dashboards-in-jupyter-lab/

Solution

No response

Alternatives

No response

Additional context

No response

interval sec isn't work at linux

% nvitop --interval SEC
usage: nvitop [--help] [--version] [--once] [--monitor [{auto,full,compact}]]
[--ascii] [--force-color] [--light] [--gpu-util-thresh th1 th2]
[--mem-util-thresh th1 th2] [--only idx [idx ...]]
[--only-visible] [--compute] [--graphics]
[--user [USERNAME [USERNAME ...]]] [--pid PID [PID ...]]
nvitop: error: unrecognized arguments: --interval SEC

nvitop version : 0.5.5
python version :3.6.13
linux version :CentOS Linux release 7.9.2009 (Core)

[Feature Request] Graphs for per process metrics

@XuehaiPan

Current Behavior

now if we run nvitop we can see amazing cli with fancy features
it has per process metrics like gpu-mem sm and ... in numbers

Expected Behavior

its get really amazing if you add live graph like some other part of nvitop (e.g avg mem usage)
for SM metric per process
i mean not showing this just by percent number actually show this by live graph changing

[Feature Request] Show the real memory usage instead of just show the percentage

Required prerequisites

  • I have searched the Issue Tracker that this hasn't already been reported. (comment there if it has.)
  • I have tried the latest version of nvitop in a new isolated virtual environment.

Motivation

Thanks for this tool. For the memory panel, I can only see the percentage. Is it possible to show the real memory size together?
Thanks

Solution

No response

Alternatives

No response

Additional context

No response

NVML ERROR: RM has detected an NVML/RM version mismatch.

I installed the nvitop via pip3 as described and it worked fine.

Then I installed nvcc via:

sudo apt install nvidia-cuda-toolkit

Then nvitop stopped working with the error:

NVML ERROR: RM has detected an NVML/RM version mismatch.

How to make both work?

`nvitop` command not found after installation

I ran the same exact commands on Ubuntu 18.04 with no problem but it doesn't work in Ubuntu 20.04. Could you please have a look?

jalal@manu:/SeaExpNFS$ pip install --upgrade nvitop
Collecting nvitop
  Using cached https://files.pythonhosted.org/packages/66/01/ab487ca351609d1d3466846cdd20d9dbe647240ff04f0dae9812d29248ef/nvitop-0.5.2-py3-none-any.whl
Collecting cachetools>=1.0.1 (from nvitop)
  Using cached https://files.pythonhosted.org/packages/ea/c1/4740af52db75e6dbdd57fc7e9478439815bbac549c1c05881be27d19a17d/cachetools-4.2.4-py3-none-any.whl
Collecting nvidia-ml-py==11.450.51 (from nvitop)
Collecting termcolor>=1.0.0 (from nvitop)
Collecting psutil>=5.5.0 (from nvitop)
Installing collected packages: cachetools, nvidia-ml-py, termcolor, psutil, nvitop
Successfully installed cachetools-4.2.4 nvidia-ml-py-11.450.51 nvitop-0.5.2 psutil-5.8.0 termcolor-1.1.0
jalal@manu:/SeaExpNFS$ nvitop
nvitop: command not found
jalal@manu:/SeaExpNFS$ lsb_release -a
LSB Version:	core-9.20170808ubuntu1-noarch:printing-9.20170808ubuntu1-noarch:security-9.20170808ubuntu1-noarch
Distributor ID:	Ubuntu
Description:	Ubuntu 18.04.6 LTS
Release:	18.04
Codename:	bionic
jalal@manu:/SeaExpNFS$ uname -a
Linux manu 5.4.0-91-generic #102~18.04.1-Ubuntu SMP Thu Nov 11 14:46:36 UTC 2021 x86_64 x86_64 x86_64 GNU/Linux
jalal@manu:/SeaExpNFS$ python
Python 3.6.9 (default, Dec  8 2021, 21:08:43) 
[GCC 8.4.0] on linux
Type "help", "copyright", "credits" or "license" for more information.
>>> 
jalal@manu:/SeaExpNFS$ pip --version
pip 9.0.1 from /usr/lib/python3/dist-packages (python 3.6)

nvidia-ml-py version conflicts with other packages (e.g., gpustat)

Context: wookayin/gpustat#107 trying to use nvidia-ml-py, Related issues: #4

Hello @XuehaiPan,

I just realized that nvitop requires nvidia-ml-py to be pinned at 11.450.51 due to the incompatible API, as discussed in wookayin/gpustat#107. My solution (in gpustat) to this bothersome library is to use pynvml greater than 11.450.129, but this would create some nuisance problems for normal users who may have both nvitop and gpustat>=1.0 installed.

From nvitop's README:

IMPORTANT: pip will install nvidia-ml-py==11.450.51 as a dependency for nvitop. Please verify whether the nvidia-ml-py package is compatible with your NVIDIA driver version. You can check the release history of nvidia-ml-py at nvidia-ml-py's Release History, and install the compatible version manually by:

Since nvidia-ml-py>=11.450.129, the definition of nvmlProcessInfo_t has introduced two new fields gpuInstanceId and computeInstanceId (GI ID and CI ID in newer nvidia-smi) which are incompatible with some old NVIDIA drivers. nvitop may not display the processes correctly due to this incompatibility.

Is having pynvml version NOT pinned at the specific version an option for you? More specifically, nvmlDeviceGetComputeRunningProcesses_v2 exists since 11.450.129+. In my opinion, pinning nvidia-ml-py at too old and too specific version isn't a great idea, although I also admit that the solution I accepted isn't ideal at all.

We could discuss and coordinate together to avoid any package conflict issues, because in the current situation gpustat and nvitop would be not compatible with each other due to the nvidia-ml-py version.

[Feature Request] torch_geometric support

First of all, thank you for the excellent nvitop.

I want to know if you have plans to add an integration with PyTorch Geometric (pyg)? It is a really great library for GNNs. I don't know if its helpful at all but it also has some profiling functions in the torch_geometric.profile module.
Since pytorch lightning doesn't give you granular control over your models (sometimes reqd in research) I haven't seen anyone use it. On the flipside, pytorch geometric is probably the most popular library for GNNs.

Hope you consider this!

[Bug] ModuleNotFoundError: No module named 'pwd'

Runtime Environment

  • Operating system and version: Windows 10 Build 19042.685
  • Python version: 3.8.10
  • Terminal emulator and version: PyCharm 2021.3 (Professional Edition)
  • nvitop version or commit: 0.5.2
  • python-ml-py version: 11.450.51
  • Locale: zh_CN.UTF-8

Current Behavior

When I type the nvitop in console in pycharm, it repports the error ModuleNotFoundError: No module named 'pwd'.
I have run nvitop correctly when I install it.

Expected Behavior

I want to use it for its great gui.

Context

Steps to Reproduce

1.In PyCharm IDE, switch to console and type nvitop, and enter.

Traceback

Traceback (most recent call last):
  File "C:\Users\user\AppData\Local\Programs\Python\Python38\lib\runpy.py", line 194, in _run_module_as_main
  File "C:\Users\user\AppData\Local\Programs\Python\Python38\lib\runpy.py", line 87, in _run_code
    exec(code, run_globals)
  File "D:\PyPrj\venv\Scripts\nvitop.exe\__main__.py", line 4, in <module>
  File "d:\pyprj\venv\lib\site-packages\nvitop\cli.py", line 12, in <module>
    from nvitop.gui import Top, Device, libcurses, colored, USERNAME
  File "d:\pyprj\venv\lib\site-packages\nvitop\gui\__init__.py", line 6, in <module>
    from nvitop.gui.library import Device, libcurses, colored, USERNAME, SUPERUSER
  File "d:\pyprj\venv\lib\site-packages\nvitop\gui\library\__init__.py", line 15, in <module>
    from nvitop.gui.library.utils import (colored, cut_string, make_bar,
  File "d:\pyprj\venv\lib\site-packages\nvitop\gui\library\utils.py", line 66, in <module>
    USERNAME = getpass.getuser()
  File "C:\Users\user\AppData\Local\Programs\Python\Python38\lib\getpass.py", line 168, in getuser
    import pwd
ModuleNotFoundError: No module named 'pwd'

[Feature Request] MIG device support (e.g. A100 GPUs)

Hello!

Firstly, thanks for creating and maintaining such an excellent library.

Runtime Environment

  • Operating system and version: Ubuntu 20.04 LTS
  • Terminal emulator and version: GNOME Terminal 3.36.2
  • Python version: `3.7
  • NVML version (driver version): 450.0
  • nvitop version or commit: main@b669fa3
  • python-ml-py version: 11.450.51
  • Locale: en_US.UTF-8

Current Behavior

When running nvitop on MiG enabled A100 GPU. nvitop fails to detect the GPU running process and GPU memory consumption. Which can otherwise be viewed by running the command, nvidia-smi

Expected Behavior

The A100 MiG GPU should be visible in the GUI.

Context

So far we can only view CPU usage metrics, which are really handy but it would also be nice to have GPU usage as designed.

Possible Solutions

I think that the MiG naming convention is different from regular naming conventions, and looks something like this:
MIG 7g.80gb Device 0: rather than just Device 0: as is currently set-up in the nvitop repo.

Steps to reproduce

  • Run A100 in Mig mode
  • start nvitop watch -n 0.5 nvitop

Recommend Projects

  • React photo React

    A declarative, efficient, and flexible JavaScript library for building user interfaces.

  • Vue.js photo Vue.js

    🖖 Vue.js is a progressive, incrementally-adoptable JavaScript framework for building UI on the web.

  • Typescript photo Typescript

    TypeScript is a superset of JavaScript that compiles to clean JavaScript output.

  • TensorFlow photo TensorFlow

    An Open Source Machine Learning Framework for Everyone

  • Django photo Django

    The Web framework for perfectionists with deadlines.

  • D3 photo D3

    Bring data to life with SVG, Canvas and HTML. 📊📈🎉

Recommend Topics

  • javascript

    JavaScript (JS) is a lightweight interpreted programming language with first-class functions.

  • web

    Some thing interesting about web. New door for the world.

  • server

    A server is a program made to process requests and deliver data to clients.

  • Machine learning

    Machine learning is a way of modeling and interpreting data that allows a piece of software to respond intelligently.

  • Game

    Some thing interesting about game, make everyone happy.

Recommend Org

  • Facebook photo Facebook

    We are working to build community through open source technology. NB: members must have two-factor auth.

  • Microsoft photo Microsoft

    Open source projects and samples from Microsoft.

  • Google photo Google

    Google ❤️ Open Source for everyone.

  • D3 photo D3

    Data-Driven Documents codes.