Git Product home page Git Product logo

tidyr's Introduction

tidyr tidyr website

CRAN status R-CMD-check Codecov test coverage

Overview

The goal of tidyr is to help you create tidy data. Tidy data is data where:

  1. Each variable is a column; each column is a variable.
  2. Each observation is a row; each row is an observation.
  3. Each value is a cell; each cell is a single value.

Tidy data describes a standard way of storing data that is used wherever possible throughout the tidyverse. If you ensure that your data is tidy, you’ll spend less time fighting with the tools and more time working on your analysis. Learn more about tidy data in vignette("tidy-data").

Installation

# The easiest way to get tidyr is to install the whole tidyverse:
install.packages("tidyverse")

# Alternatively, install just tidyr:
install.packages("tidyr")

# Or the development version from GitHub:
# install.packages("pak")
pak::pak("tidyverse/tidyr")
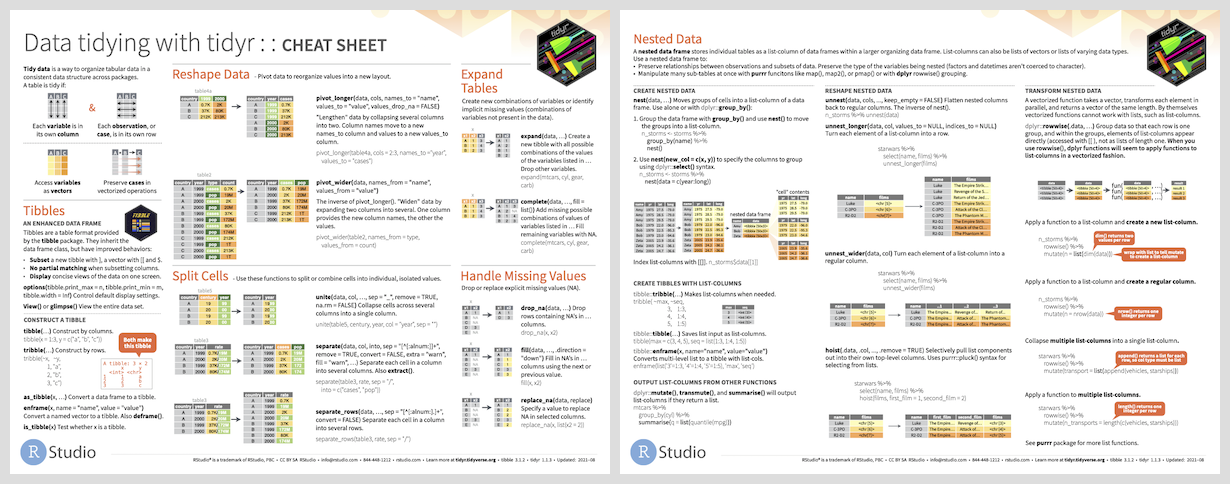
Cheatsheet

Getting started

library(tidyr)

tidyr functions fall into five main categories:

  • “Pivoting” which converts between long and wide forms. tidyr 1.0.0 introduces pivot_longer() and pivot_wider(), replacing the older spread() and gather() functions. See vignette("pivot") for more details.

  • “Rectangling”, which turns deeply nested lists (as from JSON) into tidy tibbles. See unnest_longer(), unnest_wider(), hoist(), and vignette("rectangle") for more details.

  • Nesting converts grouped data to a form where each group becomes a single row containing a nested data frame, and unnesting does the opposite. See nest(), unnest(), and vignette("nest") for more details.

  • Splitting and combining character columns. Use separate_wider_delim(), separate_wider_position(), and separate_wider_regex() to pull a single character column into multiple columns; use unite() to combine multiple columns into a single character column.

  • Make implicit missing values explicit with complete(); make explicit missing values implicit with drop_na(); replace missing values with next/previous value with fill(), or a known value with replace_na().

Related work

tidyr supersedes reshape2 (2010-2014) and reshape (2005-2010). Somewhat counterintuitively, each iteration of the package has done less. tidyr is designed specifically for tidying data, not general reshaping (reshape2), or the general aggregation (reshape).

data.table provides high-performance implementations of melt() and dcast()

If you’d like to read more about data reshaping from a CS perspective, I’d recommend the following three papers:

To guide your reading, here’s a translation between the terminology used in different places:

tidyr 1.0.0 pivot longer pivot wider
tidyr < 1.0.0 gather spread
reshape(2) melt cast
spreadsheets unpivot pivot
databases fold unfold

Getting help

If you encounter a clear bug, please file a minimal reproducible example on github. For questions and other discussion, please use community.rstudio.com.


Please note that the tidyr project is released with a Contributor Code of Conduct. By contributing to this project, you agree to abide by its terms.

tidyr's People

Contributors

aaronwolen avatar atusy avatar ax42 avatar batpigandme avatar billdenney avatar charliejhadley avatar davisadamw avatar davisvaughan avatar hadley avatar jennybc avatar jimhester avatar joshkatz avatar juliasilge avatar krlmlr avatar lionel- avatar lorenzwalthert avatar markdly avatar matthewjnield avatar mgirlich avatar mine-cetinkaya-rundel avatar riinuots avatar rjpat avatar rmsharp avatar romainfrancois avatar salim-b avatar shanepiesik avatar tjmahr avatar wibeasley avatar williamlai2 avatar yutannihilation avatar

Stargazers

 avatar  avatar  avatar  avatar  avatar  avatar  avatar  avatar  avatar  avatar  avatar  avatar  avatar  avatar  avatar  avatar  avatar  avatar  avatar  avatar  avatar  avatar  avatar  avatar  avatar  avatar  avatar  avatar  avatar  avatar  avatar  avatar  avatar  avatar  avatar  avatar  avatar  avatar  avatar  avatar  avatar  avatar  avatar  avatar  avatar  avatar  avatar  avatar  avatar  avatar  avatar  avatar  avatar  avatar  avatar  avatar  avatar  avatar  avatar  avatar  avatar  avatar  avatar  avatar  avatar  avatar  avatar  avatar  avatar  avatar  avatar  avatar  avatar  avatar  avatar  avatar  avatar  avatar  avatar  avatar  avatar  avatar  avatar  avatar  avatar  avatar  avatar  avatar  avatar  avatar  avatar  avatar  avatar  avatar  avatar  avatar  avatar  avatar  avatar  avatar

Watchers

 avatar  avatar  avatar  avatar  avatar  avatar  avatar  avatar  avatar  avatar  avatar  avatar  avatar  avatar  avatar  avatar  avatar  avatar  avatar  avatar  avatar  avatar  avatar  avatar  avatar  avatar  avatar  avatar  avatar  avatar  avatar  avatar  avatar  avatar  avatar  avatar  avatar  avatar  avatar  avatar  avatar  avatar  avatar  avatar  avatar  avatar  avatar  avatar  avatar  avatar  avatar  avatar  avatar  avatar  avatar  avatar  avatar  avatar  avatar  avatar  avatar  avatar  avatar  avatar  avatar  avatar  avatar  avatar  avatar  avatar  avatar  avatar  avatar

tidyr's Issues

spread doesn't work with dplyr::grouped_df

I'm trying to use spread after grouping/summarising with dplyr. The intended input is as below.

iris %>%
    tidyr::gather(variable, value, c(Sepal.Length, Sepal.Width, Petal.Length, Petal.Width)) %>%
    dplyr::group_by(Species, variable) %>%
    dplyr::summarise(Total = sum(value))
# Source: local data frame [12 x 3]
# Groups: Species
# 
#       Species     variable Total
#1      setosa Sepal.Length 250.3
#2      setosa  Sepal.Width 171.4
#3      setosa Petal.Length  73.1
# ...

Passing above result to spread results in index out of bounds error.

iris %>%
    tidyr::gather(variable, value, c(Sepal.Length, Sepal.Width, Petal.Length, Petal.Width)) %>%
    dplyr::group_by(Species, variable) %>%
    dplyr::summarise(Total = sum(value)) %>%
    tidyr::spread(Species, Total)
 # Error: index out of bounds

No problem when I convert the result to data.frame once.

iris %>%
    tidyr::gather(variable, value, c(Sepal.Length, Sepal.Width, Petal.Length, Petal.Width)) %>%
    dplyr::group_by(Species, variable) %>%
    dplyr::summarise(Total = sum(value)) %>%
    data.frame() %>%
    tidyr::spread(Species, Total)
#       variable setosa versicolor virginica
#1 Sepal.Length  250.3      296.8     329.4
#2  Sepal.Width  171.4      138.5     148.7
#3 Petal.Length   73.1      213.0     277.6
#4  Petal.Width   12.3       66.3     101.3

I assume

spread causes system to run out of memory

How long/wide can a data frame be -- going from gathered to spread form?

I have a 200,000 row data frame I'm spreading to create 200,000 columns and I'm running out of memory.

Have you tested to see limits on the operations with various machines?

Expand function

Expand function, as proposed in #21 would be very useful, especially if it works with group_by. For instance on a grouped data.table:

expand_.grouped_dt <- function(.data,...,.dots){
  dots <- lazyeval::all_dots(.dots, ...)
  var_name <- names(dplyr::select_vars_(names(.data), dots))
  byvars <- dt_env(.data, lazyeval::common_env(dots))$vars
  for (t in var_name) {
    setkeyv(.data,c(byvars, t))
    call <- substitute(.data[, list(seq.int(t[1], t[.N])), by = c(byvars)], list(t = as.name(t)))
    ans  <- eval(call)
    setnames(ans, c(byvars, t))
    setkeyv(ans, c(byvars, t))
    .data <- .data[ans, allow.cartesian = TRUE]
  }
  .data
}

Related stackoverflow questions:
http://stackoverflow.com/questions/25694940/from-unbalanced-to-balanced-panel
http://stackoverflow.com/questions/16878905/data-table-outer-join-by-group
http://stackoverflow.com/questions/10438969/fastest-way-to-add-rows-for-missing-values-in-a-data-frame
http://stackoverflow.com/questions/22956803/fastest-way-for-filling-in-missing-dates-for-data-table

Error using spread()

I think that there is a problem with the spread() function. In this example, when I have a look at the gathered data, I've got 0.09 for work and 0.62 for home.

> filter(ga, id == 1, trt == "treatment", time == "T1")
 id       trt location time value
1  1 treatment     work   T1  0.09
2  1 treatment     home   T1  0.62

But in the spread dataset, I've got 0.09 for home and 0.62 for work.

> sga[1,]
 id       trt time work home
1  1 treatment   T1 0.62 0.09

Do you know why this is wrong ? Do you have any solution to my issue ? Thanks

Reason for R version 3.1.0 dependency?

Hello, I would like to use the tidyr package at my enterprise but we do not have R 3.1.0 currently installed (we are still using R 3.0.2). Is there a specific reason this package requires R 3.1.0, unlike dplyr which can be installed on R 3.0.2?

unable to install: "Error in function (type, msg, asError = TRUE) : <not set>"

I am trying to install tidyr and getting this error

> devtools::install_github("hadley/tidyr")
Installing github repo tidyr/master from hadley
Downloading master.zip from https://github.com/hadley/tidyr/archive/master.zip
Error in function (type, msg, asError = TRUE)  : <not set>
> sessionInfo()
R version 3.1.0 (2014-04-10)
Platform: x86_64-pc-linux-gnu (64-bit)

locale:
[1] LC_CTYPE=en_US.UTF-8       LC_NUMERIC=C               LC_TIME=en_US.UTF-8       
[4] LC_COLLATE=en_US.UTF-8     LC_MONETARY=en_US.UTF-8      LC_MESSAGES=en_US.UTF-8   
[7] LC_PAPER=en_US.UTF-8       LC_NAME=C                  LC_ADDRESS=C              
[10] LC_TELEPHONE=C             LC_MEASUREMENT=en_US.UTF-8 LC_IDENTIFICATION=C       

attached base packages:
[1] stats     graphics  grDevices utils     datasets  methods   base     

other attached packages:
[1] devtools_1.5       vimcom.plus_0.9-92 setwidth_1.0-3     colorout_1.0-2    

loaded via a namespace (and not attached):
[1] digest_0.6.4   evaluate_0.5.5 httr_0.3       memoise_0.2.1  parallel_3.1.0 RCurl_1.95-4.1
[7] stringr_0.6.2  tools_3.1.0    whisker_0.3-2 

separate() and NA

Hi, I had a request from Hadley to file a bug report on Stack Overflow. I hope this is the right place to do it. If not, please let me know. The issue was the following. I experimentally tried to use separate() with NA. The results was that R returned an error message below. The current solution offered was to make change NA to NA-NA before using separate().

x <- c("a-1","b-2","c-3")
y <- c("d-4","e-5", NA)
z <- c("f-6", "g-7", "h-8")

foo <- data.frame(x,y,z, stringsAsFactors = F)

ana <- foo %>%
   separate(y, c("part1", "part2"))

# > foo
#    x    y   z
#1 a-1  d-4 f-6
#2 b-2  e-5 g-7
#3 c-3 <NA> h-8
# > ana <- foo %>%
# +        separate(y, c("part1", "part2"))
# Error: Values not split into 2 pieces at 3

spread changes factor order

Hi, and thank you for this package!

One question arose, when using tidyr version 0.2.0 from cran.
I want to reshape a longtable to a wide one, which is no problem, but the outcome (ordering) is somehow unexpected.
When using unite(), the new variabel is of type character, which does not contain any information about category ordering. So the output columns are sorted alphabetically, after using spread(). Is there any way, to keep the factor-ordering information - or to avoid unite() (submitting > 1 keys to spread()) - i fear currently this is not possible?
Would this be possible in future versions? It would be extremely helpful for creating tables automatically, when a certain order of columns is given a-priori.

# creating some variables
year <- c(rep(2006,4),rep(2007,4),rep(2006,4),rep(2007,4),rep(2006,4),rep(2007,4))
f1 <- factor(rep(c("m","w","gesamt"),each=8),levels=c("m","w","gesamt"))
f2 <- factor(rep(letters[1:4],6),levels=letters[1:4])
val <- round(rnorm(24),2)

# creating a data.frame
d1 <- data.frame(year = year,f1,f2,val)

d1
   year     f1 f2   val
1  2006      m  a -0.92
2  2006      m  b  0.93
3  2006      m  c  1.10
4  2006      m  d -1.04
5  2007      m  a  0.02
6  2007      m  b -0.22
7  2007      m  c  1.00
8  2007      m  d -0.50
9  2006      w  a  1.56
10 2006      w  b -0.52
11 2006      w  c -1.51
12 2006      w  d  0.50
13 2007      w  a -0.25
14 2007      w  b -0.56
15 2007      w  c -0.31
16 2007      w  d  0.50
17 2006 gesamt  a  0.74
18 2006 gesamt  b -1.90
19 2006 gesamt  c  0.44
20 2006 gesamt  d  0.46
21 2007 gesamt  a -0.91
22 2007 gesamt  b  1.20
23 2007 gesamt  c  0.03
24 2007 gesamt  d -0.41

# from long --> to wide
d1 %>% unite(univar,f1,f2) %>% spread(univar,val)

  year gesamt_a gesamt_b gesamt_c gesamt_d   m_a   m_b m_c   m_d   w_a   w_b   w_c w_d
1 2006     0.74     -1.9     0.44     0.46 -0.92  0.93 1.1 -1.04  1.56 -0.52 -1.51 0.5
2 2007    -0.91      1.2     0.03    -0.41  0.02 -0.22 1.0 -0.50 -0.25 -0.56 -0.31 0.5

Thank you!
Manuel

spread no longer works on grouped tbl

Hi,

Before I upgraded the versions of dplyr & tidy, the following works fine for me
dataset %>% opearsions %>% spread(Col,Qty)

However, after the upgrade, it seems that I will have to put a ungroup() function so that spread can work.
for example:
mtcars %>% group_by(cyl) %>% spread(gear,disp) throws out Error: index out of bounds
While mtcars %>% group_by(cyl) %>% ungroup() %>% spread(gear,disp) works fine

I liked the old way of not specifying the ungroup() function in the chaining. I'd like to know if this is an intended behaviour in this release or just a bug.

Thanks for the good work.

gather can't rename colname, if library reshape

if I load pkgs like the order below, the colnames of the results will be different:

# test codes: 

stocks <- data.frame(
    time = as.Date('2009-01-01') + 0:9,
    X = rnorm(10, 0, 1),
    Y = rnorm(10, 0, 2),
    Z = rnorm(10, 0, 4)
)

gather(stocks, stock, price, -time)

# scenario 1

 library(reshape)
 library("tidyr")
 library("dplyr")

**results**
 time variable       value
1  2009-01-01        X -0.20396704
2  2009-01-02        X -0.08796103
3  2009-01-03        X -0.03838348

# scenario 2

 library("tidyr")
 library("dplyr")

**results**
   time stock       price
1  2009-01-01     X -0.64470022
2  2009-01-02     X  2.05484389

spread does not work on grouped_df

Apparently spread does not work on grouped_df objects. Toy example:

library(dplyr)                          # from github, 2014 Oct 31
library(tidyr)                          # from github, 2014 Oct 31

## generate data
household <- rep(1:500, times = sample(5, 500, replace = TRUE))
df <- data.frame(household = household,
                 day = sample(3, length(household), replace = TRUE))

## count day indexes for each household
df_days <- summarize(group_by(df, household, day), day_count = n())
## spread, converting to data frame -- works
spread(as.data.frame(df_days), day, day_count)
## spread without conversion -- does not work
spread(df_days, day, day_count)

where the last line fails with

Error in `[.grouped_df`(data, key_col) : 
  cannot group, grouping variables 'household' not included

Maybe I misunderstood something, but I thought grouped_df could be used like data frame.

A nicer error if the value column doesn't exist

Hi,

I had a typo in the name of the value column and it led to the not especially enlightening error

Error in dim(ordered) <- c(attr(row_id, "n"), attr(col_id, "n")) : 
  attempt to set an attribute on NULL

It would be nice if you could fit in a stopifnot (or assertthat) somewhere along the way. :)

Thx
Stefan

Version: Current CRAN on R 3.1.1

tidy-data.Rmd: Section links don't work on CRAN

Section references appear in tidy-data.Rmd, but rather than appearing as links/linkable objects, the markdown appears. For example, on CRAN, the title of one section appears like this: "# Defining tidy data {#sec:defining}"

This occurs on code lines 20, 93, end of 131, and 237.

I don't know how to fix this, so I'm reporting it as an issue.

unnest multiple columns at once

I'd like unnest to support unnesting multiple columns at once. For example,

x <- data_frame(
  a=c("a:b", "c"), b=c("1:2", "3"), c=c(11,22)) %>%
  transform(
    a = strsplit(a,":"),
    b = strsplit(b,":")) %>%
  unnest(a, b)

would produce

  a b  c
1 a 1 11
2 b 2 11
3 c 3 22

As a real world example where this comes up, the HGNC allows extracting gene family ids and descriptions, but it organizes them like this:

       hgnc_id                hgnc_gene_name hgnc_gene_family_ids                         hgnc_gene_family_descriptions
 1: HGNC:10006    Rh-associated glycoprotein  CD\tbloodgroup\tSLC   CD molecules\tBlood group antigens\tSolute carriers
 2: HGNC:10008 Rh blood group, CcEe antigens       CD\tbloodgroup                    CD molecules\tBlood group antigens
 3: HGNC:10009     Rh blood group, D antigen       CD\tbloodgroup                    CD molecules\tBlood group antigens
 4:  HGNC:1001         B-cell CLL/lymphoma 6      ZBTB\tZNF\tBTBD -\tZinc fingers, C2H2-type\tBTB/POZ domain containing

I'd like it unnest hgnc_gene_family_ids and hgnc_gene_family_descriptions simultaneously:

       hgnc_id                hgnc_gene_name hgnc_gene_family_ids hgnc_gene_family_descriptions
 1  HGNC:10006    Rh-associated glycoprotein                   CD                  CD molecules
 2  HGNC:10006    Rh-associated glycoprotein           bloodgroup          Blood group antigens
 3  HGNC:10006    Rh-associated glycoprotein                  SLC               Solute carriers
 4  HGNC:10008 Rh blood group, CcEe antigens                   CD                  CD molecules
 5  HGNC:10008 Rh blood group, CcEe antigens           bloodgroup          Blood group antigens
 6  HGNC:10009     Rh blood group, D antigen                   CD                  CD molecules
 7  HGNC:10009     Rh blood group, D antigen           bloodgroup          Blood group antigens
 8   HGNC:1001         B-cell CLL/lymphoma 6                 ZBTB                             -
 9   HGNC:1001         B-cell CLL/lymphoma 6                  ZNF       Zinc fingers, C2H2-type
 10  HGNC:1001         B-cell CLL/lymphoma 6                 BTBD     BTB/POZ domain containing

as a preliminary implementation, I have this

unnest <- function (data, cols){
    if(length(cols) > 1) {
       nested <- data[,cols]
       unnested <- apply(data[,cols], 2, function(x) list(unlist(x)))
       n <- lapply(nested,                                                                                                                                                                                      
           function(nested_col) vapply(nested_col, length, numeric(1)))
       if(length(unique(n)) != 1) {
           stop("nested columns must have the same number of elements for in each cell")
       }
       data <- data[rep(1:nrow(data), n[[1]]),]
       which_cols <- which(names(data) %in% cols)

       for(i in 1:length(cols)){
           data[, which_cols[i] ] <- unnested[[i]]
       }
       rownames(data) <- NULL
       return(data)
    } else {
       nested <- data[[cols]]
       unnested <- list(unlist(nested))
       names(unnested) <- cols
       n <- vapply(nested, length, numeric(1))
       rest <- data[rep(1:nrow(data), n), setdiff(names(data), cols),
           drop = FALSE]
       rownames(rest) <- NULL
       return(tidyr:::append_df(rest, unnested, which(names(data) == cols) - 1))
    }
}

If this looks like something that would be generally useful, I'd be happy to make a pull request that fits it into the package.

separate() upset by tbl_dfs with x.1 column naming convention

Apologies if this is a dupe, or should be for dplyr. The following behavior chokes spread(). Here's a convoluted 'reprex':

library(dplyr)
library(tidyr)

s <- summarise(
  group_by(iris, Species), 
  sepal_l = mean(Sepal.Length), sepal_w = mean(Sepal.Width),
  petal_l = mean(Petal.Length), petal_w = mean(Petal.Width)
)

# The result of gather()
gather(s, Species, value)
# Source: local data frame [12 x 3]
# 
#       Species Species.1 value
#1      setosa   sepal_l 5.006
#2  versicolor   sepal_l 5.936
#3   virginica   sepal_l 6.588
# ... (abridged by br)

# This is the problematic call
separate(
  gather(s, Species, value),
  Species.1, c("part", "orient"), sep = "_"
)

# Error in matrix(unlist(pieces), ncol = n, byrow = TRUE) : 
#   'data' must be of a vector type, was 'NULL'

In similar-ish cases (tidyverse/dplyr#860, #51) ungrouping seemed to help. However, here only calling data.frame() on the data does.

separate( # Same error as above
  ungroup(gather(s, Species, value)),
  Species.1, c("part", "orient"), sep = "_"
)

separate( # Same error as above
  gather(ungroup(s), Species, value),
  Species.1, c("part", "orient"), sep = "_"
)

separate( # This works
  data.frame(gather(s, Species, value)), 
  Species.1, c("part", "orient"), sep = "_"
)

# Desired result:
#       Species  part orient value
#1      setosa sepal      l 5.006
#2  versicolor sepal      l 5.936
#3   virginica sepal      l 6.588
#4      setosa sepal      w 3.428
# ... (abridged by br)

Comparing objects that work and those that don't, the the x.1 renaming convention for duplicate column names (in this case Species.1) seems to be the only difference. The tbl_df shows Species.1 as the column name, but seems to represent it as 'Species' internally, when unclassed. 'Species.1' is the col parameter in the problematic call to spread().

# e.g.
a <- gather(s, Species, value); b <- data.frame(a)
unclass(a); unclass(b)

Versions:

other attached packages:
[1] tidyr_0.2.0 dplyr_0.4.1

loaded via a namespace (and not attached):
 [1] assertthat_0.1  DBI_0.3.1       lazyeval_0.1.10 magrittr_1.5    parallel_3.1.2 
 [6] plyr_1.8.1      Rcpp_0.11.3     reshape2_1.4.1  stringi_0.4-1   stringr_0.6.2  
[11] tools_3.1.2

Apologies for the verbose report!

spread with missing values of a factor of key_value

I want to make tables from different data where I use spread to make tables with levels of a factor for columns. spread is a good tool to do this. I need all columns even if there are no observations of some levels of the factor. reshape::cast with add.missing accomplished this; spread has no option with the same ability. Here is a simple example:

require(tidyr)
 require(dplyr)
 Data<-expand.grid(
    row=paste("r",1:3,sep=""),
    col=paste("c",1:4,sep="")   
 )

 Data<-mutate(Data,
    value=as.integer(gsub("[rc]","",paste(row,col,sep="")))
 )

 filter(Data,col!="c3")%>%
 spread(col,value,fill=0)

 require(reshape)
 filter(Data,col!="c3")%>%
 cast(row~col,
  add.missing=TRUE,value="value",fill=0
 )

cast keeps c3 even though there are not values because levels(Data$col) has all the columns. Spread does not:

row c1 c2 c3 c4
1 r1 11 12 0 14
2 r2 21 22 0 24
3 r3 31 32 0 34

This is the facility from cast I would like retained or returned. May be I am missing something in the spread options or some other function I should be using in tid- or dpl-yr.

More informative argument name than ... in gather

In gather, the argument name for "Specification of columns to gather" is .... ... is often used for "other arguments to xxx". I believe that an argument which is so central to the gather function deserves a more informative name. For example, in gather_ the equivalent argument has a proper name: gather_cols. Wouldn't it be nice(r) with a similar name in gather as well? (version 0.1.0.9000)

Provide rbind solution that can add list element names as a variable in the output

Problem: you have a list of data.frames and the element names convey information. You want to row bind them together and, in the new data.frame, you want a variable for the list element each observation originated in.

2014-08-22_rbind-and-store-as var

Demo: fragment subset of iris into separate data.frames, stored as list.
Note: Species info carried only via list names

my_list <- lapply(split(subset(iris, select = -Species),
                        iris$Species), "[", 1:2, )

Simple rbind-y calls cannot recover Species:

do.call("rbind", my_list) # rownames have never looked so good ...
##               Sepal.Length Sepal.Width Petal.Length Petal.Width
## setosa.1               5.1         3.5          1.4         0.2
## setosa.2               4.9         3.0          1.4         0.2
## versicolor.51          7.0         3.2          4.7         1.4
## versicolor.52          6.4         3.2          4.5         1.5
## virginica.101          6.3         3.3          6.0         2.5
## virginica.102          5.8         2.7          5.1         1.9
dplyr::rbind_all(my_list)
##   Sepal.Length Sepal.Width Petal.Length Petal.Width
## 1          5.1         3.5          1.4         0.2
## 2          4.9         3.0          1.4         0.2
## 3          7.0         3.2          4.7         1.4
## 4          6.4         3.2          4.5         1.5
## 5          6.3         3.3          6.0         2.5
## 6          5.8         2.7          5.1         1.9

Current workaround: prep with mapply() to restore Species, then rbind (thanks @kara_woo for this snippet)

my_list2 <-
  mapply(`[<-`, my_list, 'Species', value = names(my_list), SIMPLIFY = FALSE)
dplyr::rbind_all(my_list2)
##   Sepal.Length Sepal.Width Petal.Length Petal.Width    Species
## 1          5.1         3.5          1.4         0.2     setosa
## 2          4.9         3.0          1.4         0.2     setosa
## 3          7.0         3.2          4.7         1.4 versicolor
## 4          6.4         3.2          4.5         1.5 versicolor
## 5          6.3         3.3          6.0         2.5  virginica
## 6          5.8         2.7          5.1         1.9  virginica

spread with code and description key

Sometimes, a "long" dataset format has actually two columns for keys: a code, and a description, generally too long for variable names (for instance : http://www.bea.gov/regional/downloadzip.cfm)

A good way to deal with these data would be attach the information in the description column as attributes to the "spread" dataset (like variable labels)

For now, one has to delete the description colum:

library(dplyr)
df <- data.frame(
  id     = c(1, 1),
  variable     = c("ind331", "ind33"),
  description  = c("Primary metals manufacturing", "Fabricated metal product"),
  value        = c(93,14)
)
df %>% select(-description) %>% spread(variable, value)

case for changing argument order in gather()

I'd like to make a case for changing the order of the arguments in gather() to this:

gather(data, ..., key = "key", value = "value", na.rm = FALSE, convert = FALSE)

This means that when using the pipe operator %>% with spread() or gather() it will always read:

data => verb => columns to 'operate' + some other stuff

loses datiness

d <- data.frame(id="dummy", key="fred", value=as.Date("2015-02-05"), stringsAsFactors=FALSE)
spread(d, key, value)

produces the numeric answer rather than the actual date (i.e. it loses the class).

[this is tidyr 0.2.0]

Fixed option for separate?

Hi,

Many thanks. tidyr + dplyr use the most sensible logic for organizing data that I have encountered. Gracias.

I expected this to work:

asdf<-data.frame(secA.quesA = runif(10), secA.quesB.part1=runif(10), secA.quesB.part2=runif(10))
long <- asdf %>% gather(ques, response, secA.quesA:secA.quesB.part2) %>%

  • separate(ques, c("section", "question", "part"))
    Error: Values not split into 3 pieces at 1, 2, 3, 4, 5, 6, 7, 8, 9, 10

Could we add a "fixed" option to separate that would allow unequal splits? Or make "fixed" default? Or is this possible already?

cran repository out of date for Mac (0.2.0 not linked and 0.1.0 is missing)

I'm not sure if this is the best place for this notice ... I apologize in advance if this is not the appropriate location.

Repository on CRAN does not list any version of tidyr for Mac ... (its pointing to a missing older 0.1.0 version of the bin tar file)

the correct 0.2.0 version (http://cran.r-project.org/bin/macosx/mavericks/contrib/3.1/tidyr_0.2.0.tgz) is available, but not linked in the repository.

From a Mac OS X:
"
install.packages("tidyr")

There is a binary version available (and will be installed) but the source version is
later:
binary source
tidyr 0.1 0.2.0

trying URL 'http://cran.rstudio.com/bin/macosx/mavericks/contrib/3.1/tidyr_0.1.tgz'
Warning in install.packages :
cannot open: HTTP status was '404 Not Found'
Error in download.file(url, destfile, method, mode = "wb", ...) :
cannot open URL 'http://cran.rstudio.com/bin/macosx/mavericks/contrib/3.1/tidyr_0.1.tgz'
Warning in install.packages :
download of package ‘tidyr’ failed

"

unnesting list variable with dataframes.

Hi

I recently ran into the situation where I had a dplyr dataframe with one of the variables being a list variable. This list variable contained a dataframe. I wanted to unnest this collumn. Each collumn in the nested dataframes should become a separate collumn in the unnested data frame. As far as I know this is not possible in the current implementation (in straightforward way). What would be the suggested strategy to have this behaviour?

greetz

gather() appears significantly slower than corresponding melt

Hadley asked me to create the following issue. After answering this question about melt/cast on Stack Overflow, I decided to test the equivalent command based on tidyr's gather, as that is supposed to be the "next best thing". However, gather seems to take consistently longer than reshape, which is interesting. Using the following code:

A <- c('123 address st', '125 address st', '127 address st')
B <- c('122 address st', '124 address st', '126 address st')
DF <- data.frame(A, B, stringsAsFactors = FALSE)

library(reshape2)
library(tidyr)
all.equal(melt(data = DF, value.name = 'C', measure.vars = c('A', 'B'), gather(DF, variable, C, A:B))

All equal returns true. However, the following timings are obtained on an i7-2600K, overclocked to 4.6Ghz, 16GB RAM.

library(microbenchmark)
microbenchmark(melt(data = DF, value.name = 'C', measure.vars = c('A', 'B')),
 gather(DF, variable, C, A:B), times = 10000L, control=list(order='block'))
Unit: microseconds
                                                          expr     min      lq     mean  median      uq       max neval
 melt(data = DF, value.name = "C", measure.vars = c("A", "B")) 105.732 109.901 115.8685 111.689 114.071  1110.028 10000
                                  gather(DF, variable, C, A:B) 311.535 320.767 339.4160 326.725 332.383 28922.337 10000
> sessionInfo()
R version 3.1.2 (2014-10-31)
Platform: x86_64-w64-mingw32/x64 (64-bit)

locale:
[1] LC_COLLATE=English_United States.1252  LC_CTYPE=English_United States.1252    LC_MONETARY=English_United States.1252
[4] LC_NUMERIC=C                           LC_TIME=English_United States.1252    

attached base packages:
[1] stats     graphics  grDevices utils     datasets  methods   base     

other attached packages:
[1] microbenchmark_1.4-2 tidyr_0.2.0          reshape2_1.4.1      

loaded via a namespace (and not attached):
 [1] assertthat_0.1   colorspace_1.2-4 DBI_0.3.1        digest_0.6.8     dplyr_0.4.1      ggplot2_1.0.0    grid_3.1.2       gtable_0.1.2    
 [9] lazyeval_0.1.10  magrittr_1.5     MASS_7.3-37      munsell_0.4.2    parallel_3.1.2   plyr_1.8.1       proto_0.3-10     Rcpp_0.11.3     
[17] scales_0.2.4     stringr_0.6.2    tools_3.1.2 

Should separate's 'extra' argument have a fill option?

Suppose I have a data frame where a column contains information that I would like to separate, but only some of the rows have the second part. Would it make sense to have an option to fill the empty cells with NAs?

My use case is college football rankings tables. In the teams column they also list the first place votes, if any, which I want saved as its own column. Right now I'm using stringr + regex to extract the votes, set the ones without votes to NA or zero, and then scrub the numeric information from the teams column.

Could this potentially be improved with separate? Something like,
separate(col, into = c("col1", "col2"), sep = ",", extra = "fill") or fill = TRUE, or fill = "value" ?

My thought would be for each row, if delimiter exists, then split, otherwise col stays in col1 and col2 would be filled with NA or the desired value.

Thoughts?

Spread should work with drop=FALSE and fill=NA and create columns (not rows) from empty factor levels

Short description

The function id fails to consider the possibility that it's input is a data frame containing (or only including) factors with zero length members. As does the function id_var, called by id. This causes problems for the spread function, which should be able to handle these cases and generate named empty columns. This further causes problems for dplyr, which can result in missing column names (that should have been generated by the factor transformation) in later stages in the pipe. Instead the name is bound to some other thing in the global scope and the script (or shiny app) will error or otherwise fail.


Long description

In the following non empty example

data.frame(U=c("foo","bar")[c(1,1,2,2)],K=factor(letters[c(1:2,1:2)],levels=letters[1:2]),V=c(1:2,1:2)) %>% spread(K,V)

We get a data frame (like) with columns "a", "b".

    U a b
1 bar 1 2
2 foo 1 2

Now assume I know it has "a" and "b", and in later steps I consume "a" and "b" in e.g. mutate, or ggvis.

What if there is no data?

data.frame(U=c("foo","bar")[c()],K=factor(letters[c()],levels=letters[c(1:2)]),V=numeric()) %>% spread(K,V)

This produces the following:

[1] U
<0 rows> (or 0-length row.names)

Which then goes horribly wrong if I try to consume "a"

> .Last.value %>% mutate(zep = a)
Error: unsupported type for column 'zep' (CLOSXP, classes = function)

What happened here? It pulled 'a' form the environment - in fact it's using shiny::a - a function to produce html.

Ideally, drop=FALSE should address this - by creating columns for factor levels that don't exist in the data.

But right now that doesn't work - drop=FALSE does something different - it fills in missing data...

I can't even make this work properly, to produce an example, but never mind.

Give separate an option to work like stringr::str_split_fixed

Something like

data.frame( a = c( "Key: aValue", "AnotherKey: messy: Value" ) ) %>%
  separate( a, c("key", "value"), sep=": ")

gives

Error: Values not split into 2 pieces at 2

I would love to see an option which makes separate doing the same as str_split_fixed does, i.e.

 data.frame( a = c( "Key: aValue", "AnotherKey: messy: Value" ) ) %>%
  do( {
    tmp <- as.data.frame( str_split_fixed( .$a, ": ", n  = 2 ) )
    names(tmp) <- c("key", "value")
    cbind( ., tmp )
  } )

Nest() and unnest() operators

Would converted repeated values in to a list-column, and vice versa. Would be useful primitive when working with values like (1, 2, 3)

Is there an explicit tidyr attitude towards grouped tbl?

I just got baffled by spread() and the root cause appears to be that the input was a grouped_df.

Note from the future: After combing through closed issues I found #32, which seems to answer my question. Will wait for dplyr fix.

I am wondering if

  • my workflow is really weird and this should not come up in real life

  • my use of ungroup() is the intended workflow

  • tidyr needs to play nicer with grouped tbls

    Here's a MRE with ChickWeight:

(mini_ragged_chick <- ChickWeight %>%
   filter( (Chick == 18) |
             (Chick == 13 & Time %in% c(2, 4, 6)) |
             (Chick == 46 & Time %in% c(0, 6, 8))) %>%
  mutate(Chick = paste0("Chick", Chick)))

(grouped_chick <- mini_ragged_chick %>%
   group_by(Diet, Time) %>%
   tally)

## does not work
grouped_chick %>% spread(Time, n)

## these all work; I think they work because grouping is removed?
grouped_chick %>% ungroup %>% spread(Time, n)
grouped_chick %>% as.data.frame %>% spread(Time, n)
grouped_chick %>% as.data.frame  %>% tbl_df %>% spread(Time, n)
grouped_chick %>% tbl_df %>% spread(Time, n)

spread crashing for a data_frame with 2 columns (but not for a data.frame)

I am on the latest version of everything using RStudio: "Check for Updates -> All packages are up to date."

Spread works when using a data.frame:

> df <- data.frame(x = c("a", "b"), y = c(3, 4))
> df
  x y
1 a 3
2 b 4
> df %>% spread(x, y) 
   a  b
1  3 NA
2 NA  4

But with a data_frame, the same commands error out:

> df <- data_frame(x = c("a", "b"), y = c(3, 4))
> 
> 
> df
Source: local data frame [2 x 2]
  x y
1 a 3
2 b 4
> df %>% spread(x, y) 
Error in .subset2(x, i, exact = exact) : subscript out of bounds

Does that make sense?

Thanks!

Joshua

Regex "dot" crashing Rstudio with separate

I caused an issue with separate yesterday. While tidying, I gathered a series of columns into a single column that looks like this,

df <- data.frame(yrqtr = rep("X1996.04", times = 1000000))

My desire is to separate this column by "." but the following was causing RStudio to hang and then crash,

df <- separate(df, col = yrqtr, into = c("year", "quarter"), sep = ".")

After some investigation I realized my mistake by remembering that "dot" means match everything in regular expressions. So I'm breaking separate by supplying it the worst possible regex. Changing that line to sep = "\\." eliminates the problem.

I imagine that other people will run into this issue also by following their intuitions for the separator argument. Had the column been "X1996@04", sep = "@" would have worked, and in the manner I initially expected would work with "."

Is sep = "." a pain point worth throwing a warning about?

Interestingly, sep = "." + extra = "merge" also "solves" the crashing, but it's doing so in a way that obscures the error of my improper regex string.

gather() does not work on data frame tbl's that have been group'd

## Bug report: gather() does not work on data frame tbl's that have been
## group'd.

library(dplyr)
library(tidyr)

## From ?gather

stocks <- data.frame(
  time = as.Date('2009-01-01') + 0:9,
  X = rnorm(10, 0, 1),
  Y = rnorm(10, 0, 2),
  Z = rnorm(10, 0, 4))

## Below works fine

gather(stocks, stock, price, -time)

## And works fine after tbl_df.

stocks <- tbl_df(stocks)
gather(stocks, stock, price, -time)

## But if we group_by(time) first, we get an error.

stocks <- group_by(stocks, time)
gather(stocks, stock, price, -time) ## Produces Error: index out of bounds

## Ungroup and everything is fine.

stocks <- ungroup(stocks)
gather(stocks, stock, price, -time) ## Works fine.

## Maybe this is not a bug because gather() should not work on group'ed data 
## frames. But, if so, that fact should be made clear in the help. I think it is
## a bug, either in tidyr or in dplyr. Alas, I am not smart enough to know which
## function/package is at fault.

[FR] gather_all / gather 'smart' default when only key and value given

example data

df <- structure(list(d = c(1, 1, 1, 1, 1, 1, 1, 1, 1, 1, 1, 1), l1 = c(1.5, 
1.5, 1.5, 1.5, 1.5, 1.5, 2, 2, 2, 2, 2, 2), l2 = c(1.83333333333333, 
1.83333333333333, 2.16666666666667, 2.16666666666667, 2.5, 2.5, 
2.33333333333333, 2.33333333333333, 2.66666666666667, 2.66666666666667, 
3, 3), l3 = c(2.33333333333333, 2.83333333333333, 2.66666666666667, 
3.16666666666667, 3, 3.5, 2.83333333333333, 3.33333333333333, 
3.16666666666667, 3.66666666666667, 3.5, 4)), class = "data.frame", row.names = c(NA, 
-12L), .Names = c("d", "l1", "l2", "l3"))
head(df)

    d  l1       l2       l3
1   1 1.5 1.833333 2.333333
2   1 1.5 1.833333 2.833333
3   1 1.5 2.166667 2.666667
4   1 1.5 2.166667 3.166667
5   1 1.5 2.500000 3.000000
6   1 1.5 2.500000 3.500000

intention

gather all columns of df into x,y.

current UI

df %>% gather(x, y, d:l3)

request

It would be nice if gather had an all-inclusive default when only key and value arguments are provided. This seems like the most intuitive default to me as I don't think you'd ever want to gather
no columns into a key and value... This would mean that for df the following "smart default" would be equivalent to the current UI (gather all columns).

df %>% gather(x, y)

the select() philosophy

Would this be confusing? Does it go against select()?

Now I think this impacts the whole opposite to the select() paradigm. That is if ... is NULL it current selects nothing... but what is the use case for selecting nothing? There are definitely some use cases for selecting everything ( such as that within gather() ).

In the quest of making code more naturally reader friendly an empty selection giving everything is definitely a negative... so perhaps an alternative solution:

df %>% gather(x, y, all= TRUE)
df %>% gather_all_into(x, y)
df %>% gather_into(x, y)  # think: spread_outof(x,y) to reverse?

but my favorite...

df %>% into(x, y) # opens the door to 'outfrom()` / `outof`

Error using spread()

I think that there is a problem with the spread() function. In this example, when I have a look at the gathered data, I've got 0.09 for work and 0.62 for home.

> filter(ga, id == 1, trt == "treatment", time == "T1")
 id       trt location time value
1  1 treatment     work   T1  0.09
2  1 treatment     home   T1  0.62

But in the spread dataset, I've got 0.09 for home and 0.62 for work.

sga  <- spread(ga, location, value)
> sga[1,]
 id       trt time work home
1  1 treatment   T1 0.62 0.09

Do you know why this is wrong ? Do you have any solution to my issue ? Thanks

Implement renaming of columns in gather()

While gather() uses select_vars() underneath, it ignores variable renaming. It would be nice if gather_() can accept a named vector for gather_cols and rename the values in the key column.

The desired output using the example from ?gather is:

gather(stocks, stock, price, -time, XNEW=X)
#          time stock       price
#1  2009-01-01     XNEW -0.94386401
#2  2009-01-02     XNEW -0.36005819
#3  2009-01-03     XNEW  0.22049081
#4  2009-01-04     XNEW  0.45765251
# ...

Recommend Projects

  • React photo React

    A declarative, efficient, and flexible JavaScript library for building user interfaces.

  • Vue.js photo Vue.js

    🖖 Vue.js is a progressive, incrementally-adoptable JavaScript framework for building UI on the web.

  • Typescript photo Typescript

    TypeScript is a superset of JavaScript that compiles to clean JavaScript output.

  • TensorFlow photo TensorFlow

    An Open Source Machine Learning Framework for Everyone

  • Django photo Django

    The Web framework for perfectionists with deadlines.

  • D3 photo D3

    Bring data to life with SVG, Canvas and HTML. 📊📈🎉

Recommend Topics

  • javascript

    JavaScript (JS) is a lightweight interpreted programming language with first-class functions.

  • web

    Some thing interesting about web. New door for the world.

  • server

    A server is a program made to process requests and deliver data to clients.

  • Machine learning

    Machine learning is a way of modeling and interpreting data that allows a piece of software to respond intelligently.

  • Game

    Some thing interesting about game, make everyone happy.

Recommend Org

  • Facebook photo Facebook

    We are working to build community through open source technology. NB: members must have two-factor auth.

  • Microsoft photo Microsoft

    Open source projects and samples from Microsoft.

  • Google photo Google

    Google ❤️ Open Source for everyone.

  • D3 photo D3

    Data-Driven Documents codes.