Git Product home page Git Product logo

star-history's Introduction

🧩 Also available as a Chrome extension

✨ Star History ✨

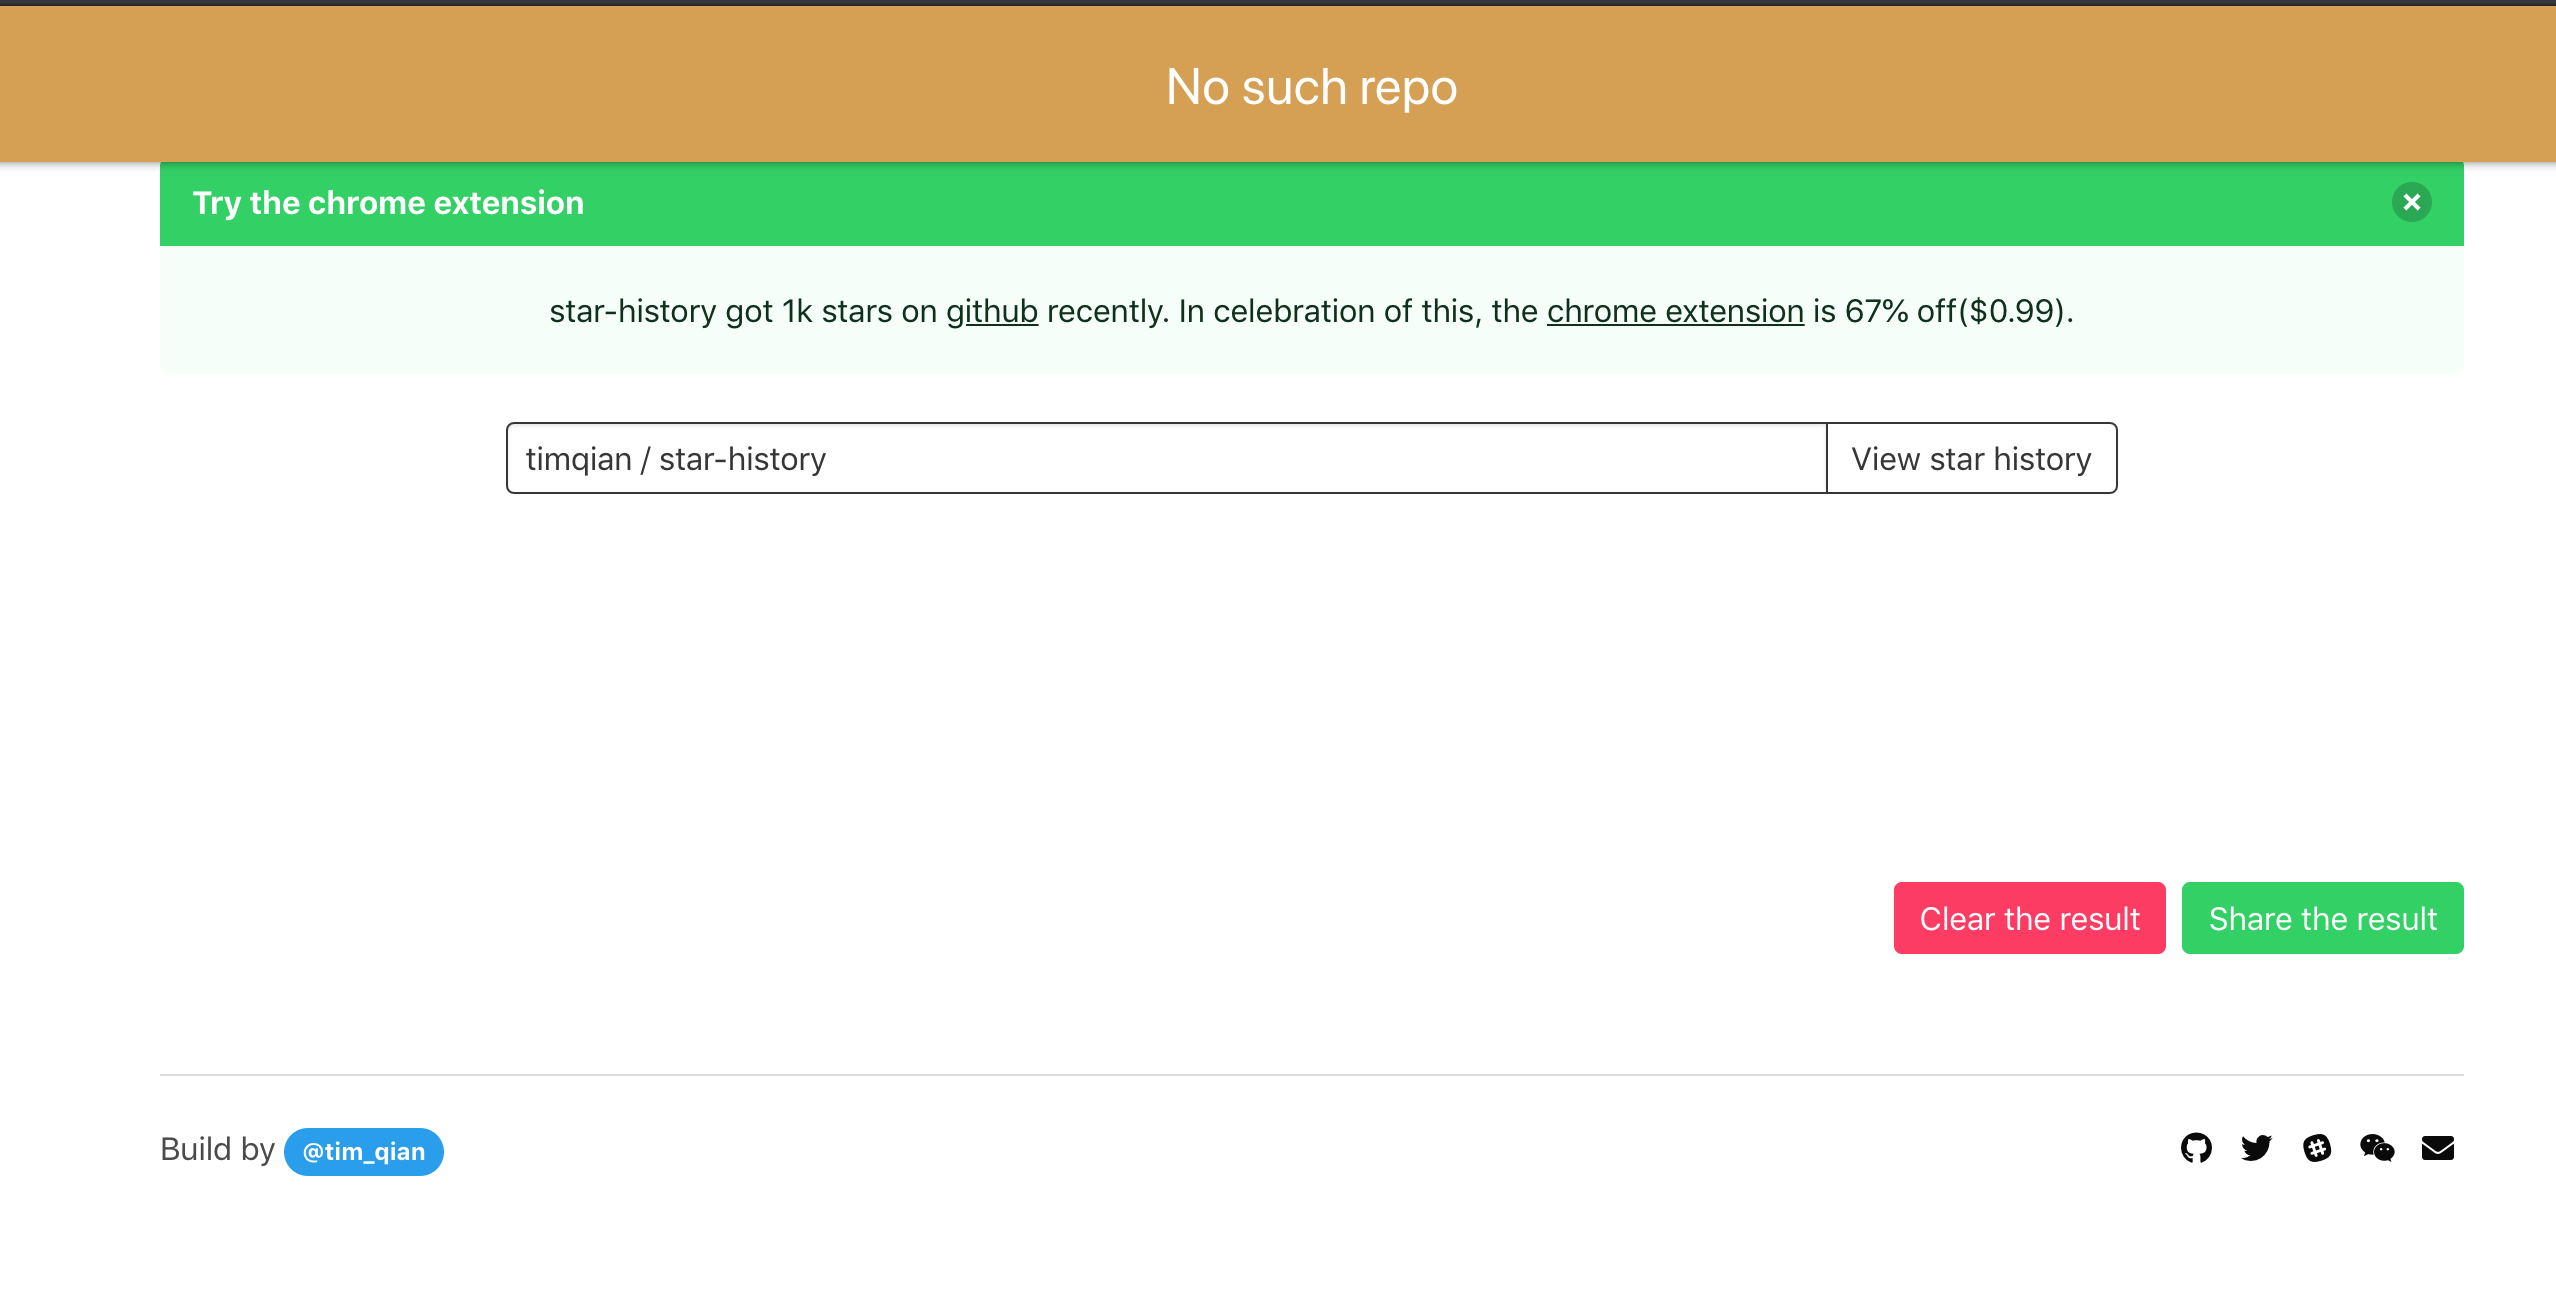
star-history.com, the missing GitHub star history graph of GitHub repos.

Star History Chart

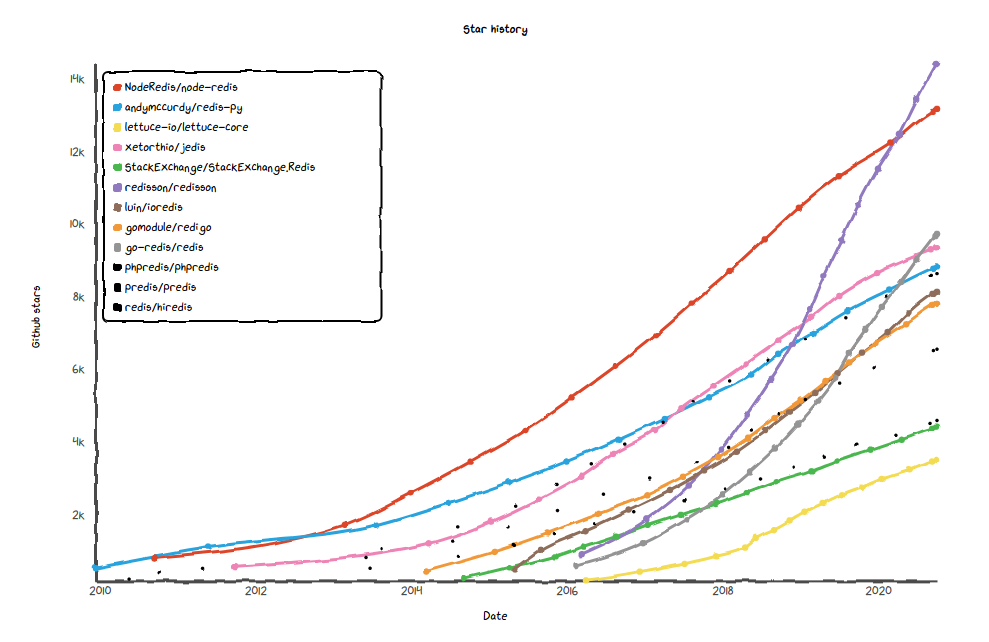
👆 THIS is a live chart created with the following html: 👇

<picture>
  <source
    media="(prefers-color-scheme: dark)"
    srcset="
      https://api.star-history.com/svg?repos=star-history/star-history&type=Date&theme=dark
    "
  />
  <source
    media="(prefers-color-scheme: light)"
    srcset="
      https://api.star-history.com/svg?repos=star-history/star-history&type=Date
    "
  />
  <img
    alt="Star History Chart"
    src="https://api.star-history.com/svg?repos=star-history/star-history&type=Date"
  />
</picture>

💜 Sponsors

Bytebase

Bytebase is an open source, web-based database schema change and version control tool for teams. Supporting MySQL, PostgreSQL, Oracle, MongoDB, Redis, Snowflake, ClickHouse, TiDB, Google Spanner.

Dify

Dify is an open source LLMOps platform that helps developers build AI applications more simply and quickly. Its core idea is to define various aspects of AI applications, including Prompts, Contexts, and Plugins, through declarative YAML files.

✨ Features

  • Unique sketch xkcd feeling chart;
  • One-click generation of high-quality image for chart;
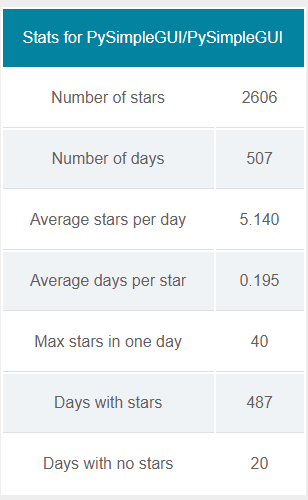
  • Support multiple chart view mode based on date or timeline;
  • Embed the real-time chart into GitHub readme or other websites (like the one we embed here on the top)
  • And various useful functions:
    • toggle repo visibility;
    • shortcut to input repo;
    • share on Twitter quickly;
    • support input multiple repos;
    • ...waiting for you to find out!

🌠 Screenshots

🏗 Development

Star-history is built using a modern tech stack: Vue + Vite + TailwindCSS.

Prerequisites

Install dependencies

pnpm i

Start with your interest

  • Main website is the homepage of star-history with most of useful features and blogs about open source.

    pnpm dev

    The website will be served at http://localhost:3000.

  • Chrome extension supports the basic chart viewer as a free additional product.

    pnpm build:ext

    Load the built ./dist folder as unpacked project to chrome extensions page.

  • API server is an experimental feature. It's mainly used to generate chart SVG image file that can be embeded into GitHub readme.

    cd server
    pnpm i && pnpm dev

    The API server will be running on http://localhost:8080.

star-history's People

Contributors

adela-bytebase avatar boojack avatar chanandy1024 avatar chinesedfan avatar d-bytebase avatar dependabot[bot] avatar enolaved avatar eungjun-yi avatar hyoban avatar kaliiiiiiiiii avatar kevinpjk avatar lsqy avatar megrax avatar milasuperstar avatar nirajpandkar avatar okalachev avatar payne911 avatar peasoft avatar remainingtoast avatar renovate[bot] avatar serima avatar snyk-bot avatar suzaku avatar talljack avatar tianzhou avatar timqian avatar tom-doerr avatar uncenter avatar v1r3n avatar writinwaters avatar

Stargazers

 avatar  avatar  avatar  avatar  avatar  avatar  avatar  avatar  avatar  avatar  avatar  avatar  avatar  avatar  avatar  avatar  avatar  avatar  avatar  avatar  avatar  avatar  avatar  avatar  avatar  avatar  avatar  avatar  avatar  avatar  avatar  avatar  avatar  avatar  avatar  avatar  avatar  avatar  avatar  avatar  avatar  avatar  avatar  avatar  avatar  avatar  avatar  avatar  avatar  avatar  avatar  avatar  avatar  avatar  avatar  avatar  avatar  avatar  avatar  avatar  avatar  avatar  avatar  avatar  avatar  avatar  avatar  avatar  avatar  avatar  avatar  avatar  avatar  avatar  avatar  avatar  avatar  avatar  avatar  avatar  avatar  avatar  avatar  avatar  avatar  avatar  avatar  avatar  avatar  avatar  avatar  avatar  avatar  avatar  avatar  avatar  avatar  avatar  avatar  avatar

Watchers

 avatar  avatar  avatar  avatar  avatar  avatar  avatar  avatar  avatar  avatar  avatar  avatar  avatar  avatar  avatar  avatar  avatar  avatar  avatar  avatar  avatar  avatar  avatar  avatar  avatar

star-history's Issues

Add License

Could you add a license to the project?
I bought your browser extension to support you and your project but just noticed that this isn't free software, which makes me somewhat uncomfortable.

Comparing projects

It would be nice to be able to compare projects in the sense how the number of stars have grown since it got launched.
If there is a project from 2015 and one from 2018 one might be interested if one is growing faster which is hard to see atm. Therefore a possibility of changing the x axis to months since launch would be nice. + zoom functionality like #50 to focus on the first x months.

Thanks for the project.

TODOs

  • prevent 'crash' for invalid input
  • multiple kinds of input styles(eg: github.com/timqian/star-history, ...)
  • use url hash to 'remember' searches

Negative star count

When I insert fpg1503/MakeXcodeGr8Again it shows a star count of -30 for 06/23/2016. I don't think that makes much sense.

chrome extension

A chrome extension version of this project is better, I may do it if I find time.

Deprecation email about authentication using tokens

Today I got an email containing the following (and information that shows it was sent because of a star-history and my token I have it linked with):

Hi @TheThirdOne,

Your personal access token was used as part of a query parameter to access an endpoint through the GitHub API

Please use the Authorization HTTP header instead, as using the access_token query parameter is deprecated.

Depending on your API usage, we'll be sending you this email reminder once every 3 days for each token and User-Agent used in API calls made on your behalf.
Just one URL that was accessed with a token and User-Agent combination will be listed in the email reminder, not all.

Visit https://developer.github.com/changes/2019-11-05-deprecated-passwords-and-authorizations-api/#authenticating-using-query-parameters for more information.

Thanks,
The GitHub Team

It seems like this should be an easy fix; the affected lines seem to be: https://github.com/timqian/star-history/blob/7d1bbd8c950a70e97f598b981b13c1d6d5e92885/core/getStarHistory.js#L16-L23

information: systematic stat weakness

The graph can show only the history of the current star givers.
It cannot show stars that where revoked later.

So lets face this situation:

  1. someone creates a nice piece of software, many people like it and the project gets many stars.
  2. suddenly something turns bad/evil with the projects (e.g it comes to public it contained virus or the last releases where rubbish and previous users move somewhere else) and now many people revoke their star from the project.

Now the star-history graph still would show an increasing interest, because the graph is calculated only from current star givers.

To resolve this it would be required to constantly monitor the stars (write to a database for instance weekly) of every project that you want to see in the graph, so you can detect when stars are taken away too.

remove spaces from query

In many places GitHub displays repos with spaces like so: timqian / star-history. Whenever I copy/paste the repo name into the Star history app I have manually delete the spaces. It's a small annoyance but should be easy to fix?

logarithmic display

Could you add an option for logarithmic display? This would help compare trends between repositories with vastly different stars.

Set up a CI/CD pipeline

We should use Travis CI or CircleCI...?

  • Linter
  • Unit test
  • Deploy to production once merged into master

Graph Changes

Hey. The graphs on the hosted version appear to look slightly different with the new UI. It seems to flat line at the top. Not really an issue but just wanted to highlight that.

Rate of growth chart

Could we show a plot of the difference between each pair of points? Mathematically speaking, I'm asking for an approximate derivative:

delta = (star1, star2) => ({
  count: star1.count - star2.count,
  time: star1.time,
})

What would you think?

Crashes when the repo name is wrong

Hey @timqian, a very useful repo!

I've struggled with one thing a few times and it seems to me that the issue may be topical to other people too. When you mistype a name of a repo and Github API returns 404, the app crashes. Seeing an alert means that you now have to reload the whole page and start pasting the names of the repos you want to compare from scratch. This is a bit time-consuming.

A need to carefully pick a part of the github url seems to be a bit redundant too. Could the app understand timqian/star-history, https://github.com/timqian/star-history https://github.com/timqian/star-history/, github.com/timqian/star-history or even [email protected]:timqian/star-history.git equally well? This must be quite easy with regexps.

Could the app be a bit more tolerant to human mistakes? Maybe having a list as proposed in #23 where some rows get a coloured marker and some get crosses will be the best solution from the UX perspective. Here is an example of what I mean:

• facebook/react
• https://github.com/jquery/jquery
× timqian/hello-world
• timqian/star-history

A user just types the names of the repos separated by a newline. The markers automatically appear on the right just like the numbers in a text editor. A cross means that a repo does not exist, and a coloured bullet (or a dash) refers to a line in a chart. This way a textfield serves both as the input and the output and we no longer need a legend since its job has already been done.

What do you think of this idea?

一些bug

image

我鼠标移在12.13号,但是高亮的点位置不对;
还有如果一段时间star数没有变化的话,应该是一条水平线吧,而不是什么都没有

Export CSV

Thanks for this great website! I was just wondering, would it be simple to add an "export to CSV" button to the website, to have the data in the graph downloaded as a CSV file? Would be great for presentations and further visualizations etc.

After clearing graph via "Clear", tooltips are still rendered

Steps to reproduce:

  • Added a few repositories to view star history of (e.g. Ensighten/grunt-spritesmith, Ensighten/spritesmith, twolfson/gulp.spritesmith)
  • Cleared graph data via "Clear" button
  • Moved mouse over former graph area

Expected behavior: No tooltip should appear

Actual behavior: Tooltip for past graph data appeared

Screenshot:

selection_234

What type of license?

Hi @timqian ,

Thanks for this excellent service.
I would like to know what type of license is provided for this service?
Can I integrate this service in my open source project SwiftHub?

Thanks again!
simulator screen shot - iphone xr - 2019-03-07 at 15 05 25

TODOs

  • Clear button(clear results and remove hash)
  • use current star number as the last point on the graph

No caching

At the moment it always hits the API, it would be good to add caching caching, e.g. when sharing a link it doesn't use a lot of API calls

I suggest caching data via Redis with an expiry time of 1 hour

Upper limit

The charts are only limited to 39960 stars max on the y-axis? Like here. Is that a limitation of the GitHub API or something?

Feature request: Summing up + csv list input

Amazing repository, thank you.

I think it could have been really awesome if it was possible to enter a list (hundreds or thousands even) of repositories and get a sum up of their stars history. I believe it can be useful to discover trends in wider scale.

[ Enhancement ] Show statistics about each project

I also use another star graphing program:
https://seladb.github.io/StarTrack-js/

One feature I really like is their statistics below the graph. Each graphed project has these stats shown:

image

I've found that these stats can tell me a little more about the project than the graph alone. The average per day is an excellent one because it shows if a project's rate rate is accelerating.

Not sure if you have access to these stats or you maybe can show even more??

(I purchased the Chrome add-on. It's great! Would be nice to be able to compare via that add-on too or see these stats!)

Date Extraction

Hi,

Is there a way to extract the dates that the repos were starred? I would like to use this information to predict stars for a repo? Is there already a capability within this application?

Thanks,
Heather

sampling the last entry of each page

It seems we are currently using the first entry of each page as sample. If a repo has been quiet lately, the chart will miss data points to the most recent date and look awkward.

Recommend Projects

  • React photo React

    A declarative, efficient, and flexible JavaScript library for building user interfaces.

  • Vue.js photo Vue.js

    🖖 Vue.js is a progressive, incrementally-adoptable JavaScript framework for building UI on the web.

  • Typescript photo Typescript

    TypeScript is a superset of JavaScript that compiles to clean JavaScript output.

  • TensorFlow photo TensorFlow

    An Open Source Machine Learning Framework for Everyone

  • Django photo Django

    The Web framework for perfectionists with deadlines.

  • D3 photo D3

    Bring data to life with SVG, Canvas and HTML. 📊📈🎉

Recommend Topics

  • javascript

    JavaScript (JS) is a lightweight interpreted programming language with first-class functions.

  • web

    Some thing interesting about web. New door for the world.

  • server

    A server is a program made to process requests and deliver data to clients.

  • Machine learning

    Machine learning is a way of modeling and interpreting data that allows a piece of software to respond intelligently.

  • Game

    Some thing interesting about game, make everyone happy.

Recommend Org

  • Facebook photo Facebook

    We are working to build community through open source technology. NB: members must have two-factor auth.

  • Microsoft photo Microsoft

    Open source projects and samples from Microsoft.

  • Google photo Google

    Google ❤️ Open Source for everyone.

  • D3 photo D3

    Data-Driven Documents codes.