by Scott Prahl


![]()

Simple and fast calculation of beam sizes from a single monochrome image based on the ISO 11146 method of variances. Some effort has been made to make the algorithm less sensitive to background offset and noise.
This module also supports M² calculations based on a series of images collected at various distances from the focused beam.
Extensive documentation can be found at <https://laserbeamsize.readthedocs.io>
Use pip:
pip install --user laserbeamsizeor conda:
conda install -c conda-forge laserbeamsizeor use immediately by clicking the Google Colaboratory button below
Finding the center and dimensions of a good beam image:
import imageio.v3 as iio
import laserbeamsize as lbs
file = "https://github.com/scottprahl/laserbeamsize/raw/main/docs/t-hene.pgm"
image = iio.imread(file)
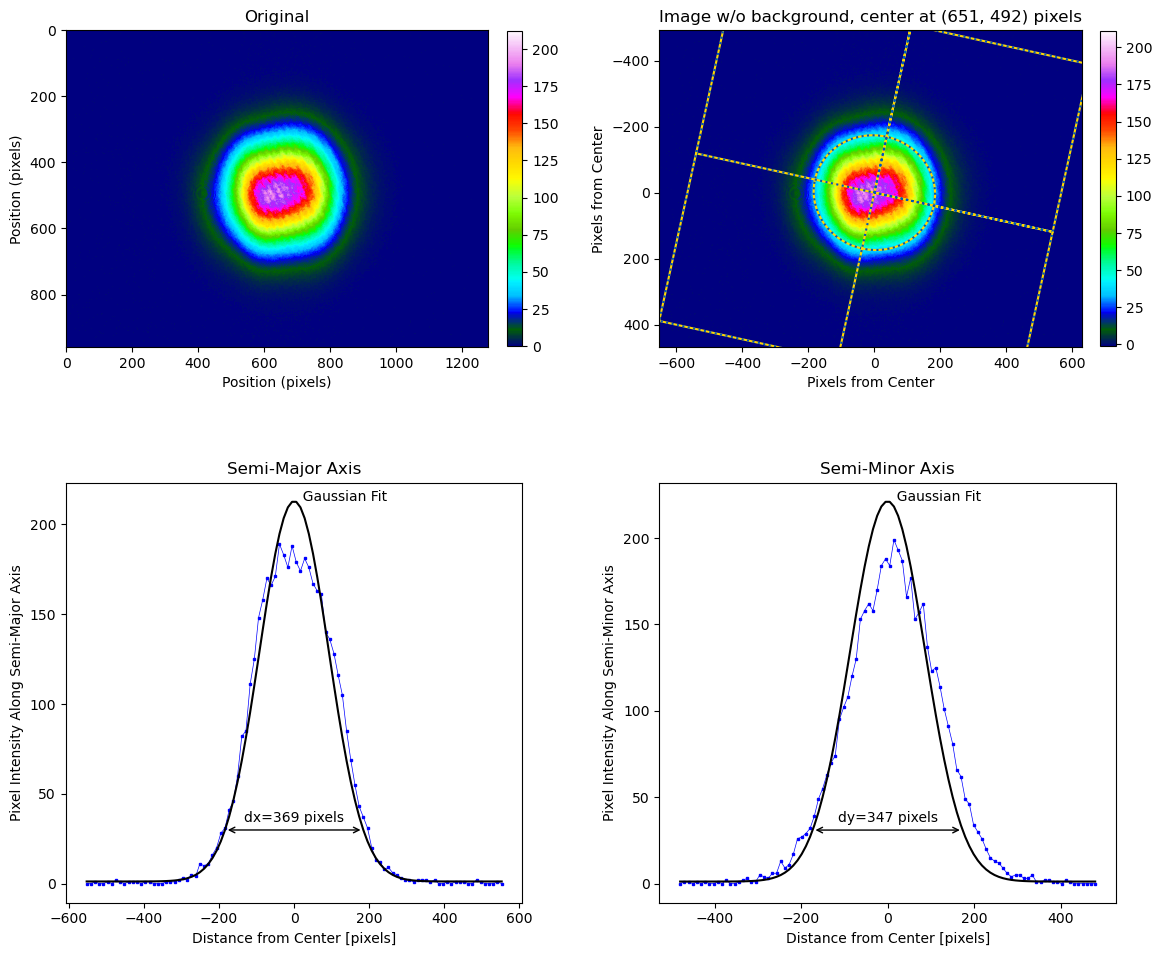
x, y, dx, dy, phi = lbs.beam_size(image)
print("The center of the beam ellipse is at (%.0f, %.0f)" % (x, y))
print("The ellipse diameter (closest to horizontal) is %.0f pixels" % dx)
print("The ellipse diameter (closest to vertical) is %.0f pixels" % dy)
print("The ellipse is rotated %.0f° ccw from the horizontal" % (phi * 180/3.1416))to produce:
The center of the beam ellipse is at (651, 492)
The ellipse diameter (closest to horizontal) is 369 pixels
The ellipse diameter (closest to   vertical) is 347 pixels
The ellipse is rotated -12° ccw from the horizontal
A visual report can be done with one function call:
lbs.plot_image_analysis(beam)
plt.show()
produces something like
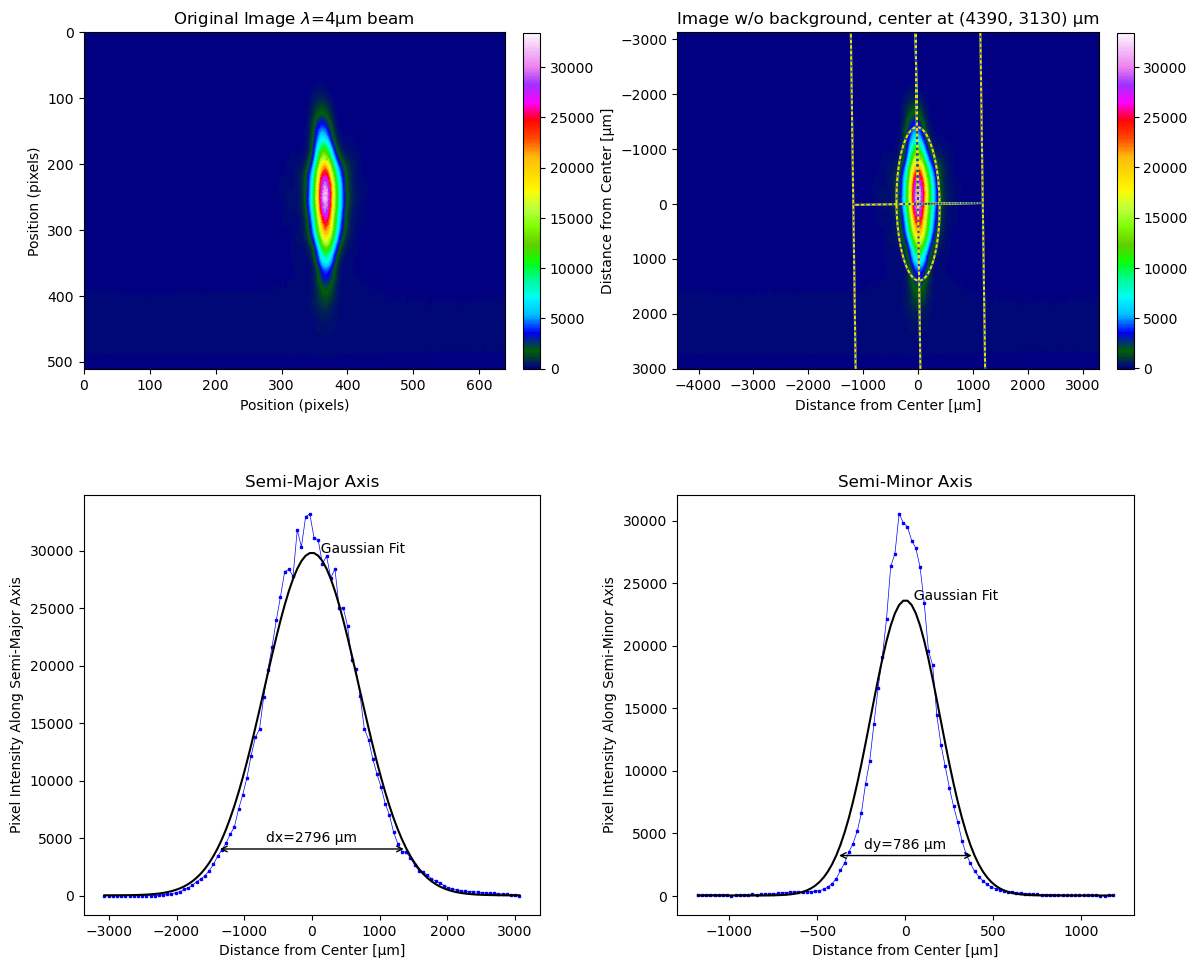
or:
lbs.plot_image_analysis(beam, r"Original Image $\lambda$=4µm beam", pixel_size = 12, units='µm')
plt.show()
produces something like
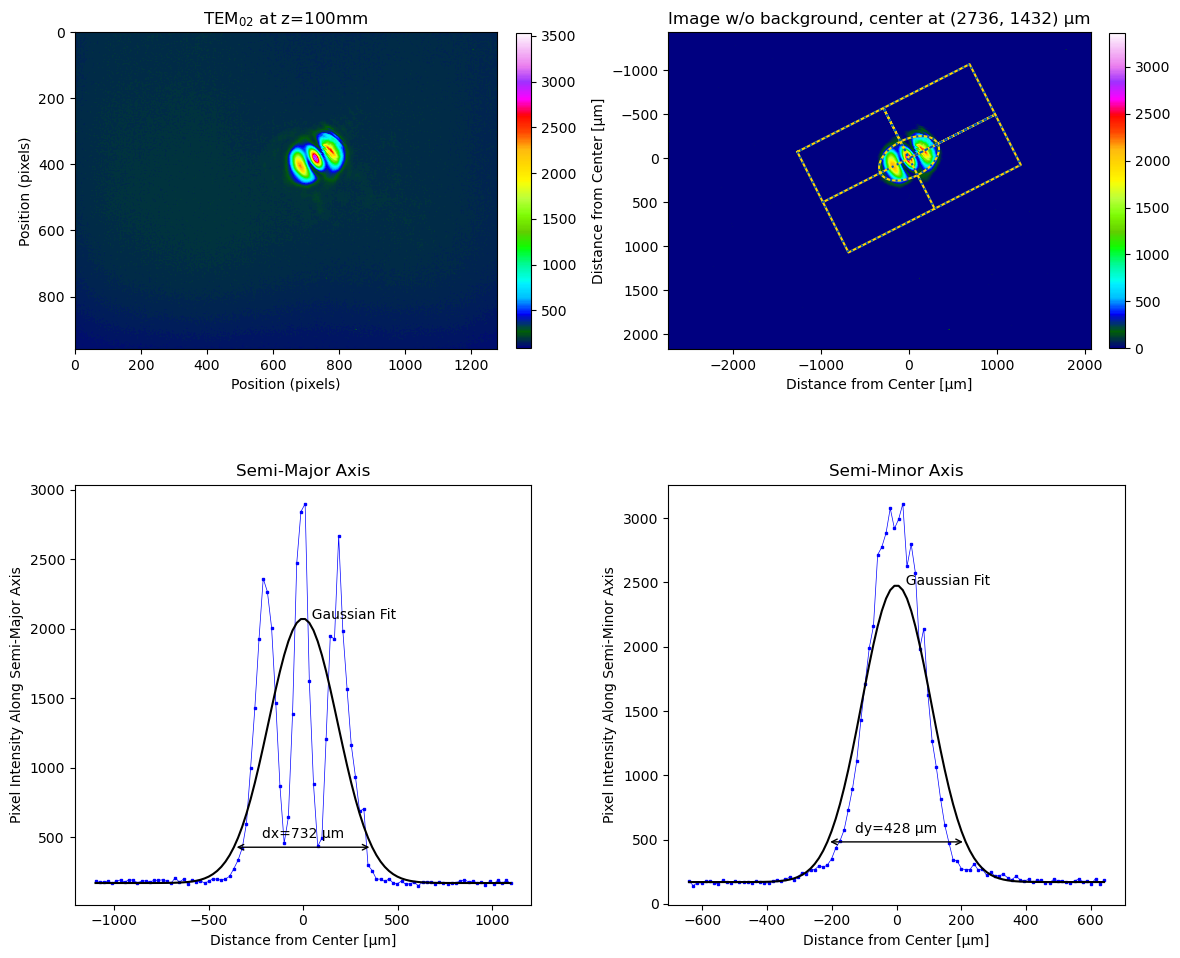
Non-gaussian beams work too:
# 12-bit pixel image stored as high-order bits in 16-bit integers
tem02 = imageio.imread("TEM02_100mm.pgm") >> 4
lbs.plot_image_analysis(tem02, title = r"TEM$_{02}$ at z=100mm", pixel_size=3.75)
plt.show()
produces
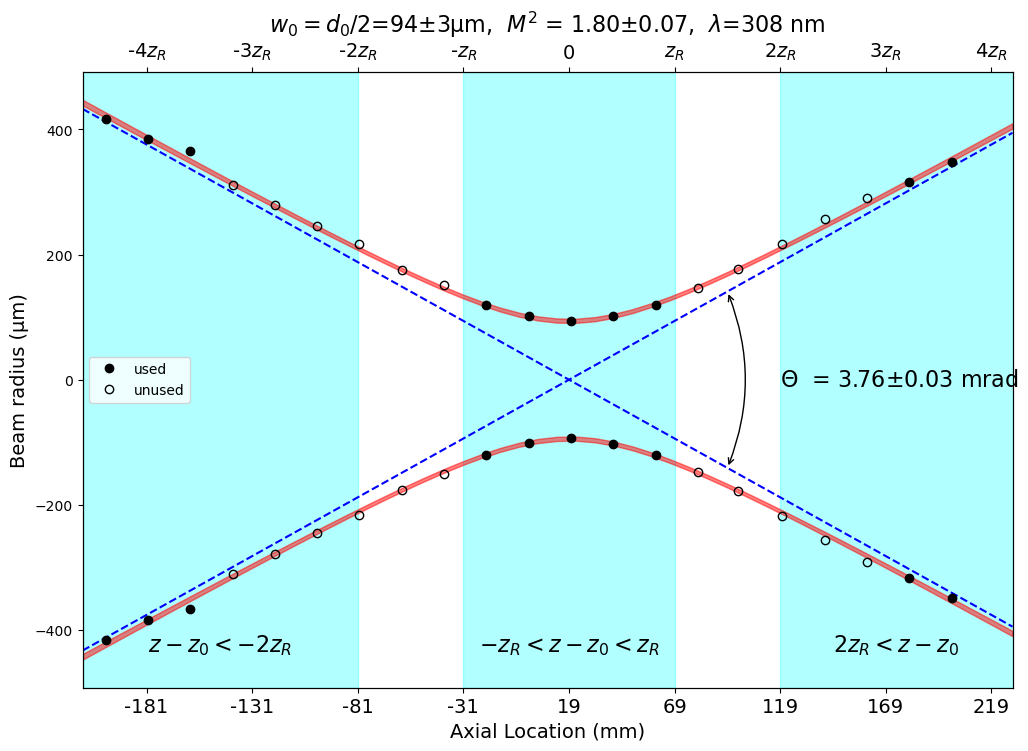
Determining M² for a laser beam is also straightforward. Just collect beam diameters from five beam locations within one Rayleigh distance of the focus and from five locations more than two Rayleigh distances:
lambda1=308e-9 # meters
z1_all=np.array([-200,-180,-160,-140,-120,-100,-80,-60,-40,-20,0,20,40,60,80,99,120,140,160,180,200])*1e-3
d1_all=2*np.array([416,384,366,311,279,245,216,176,151,120,101,93,102,120,147,177,217,256,291,316,348])*1e-6
lbs.M2_radius_plot(z1_all, d1_all, lambda1, strict=True)
plt.show()
produces
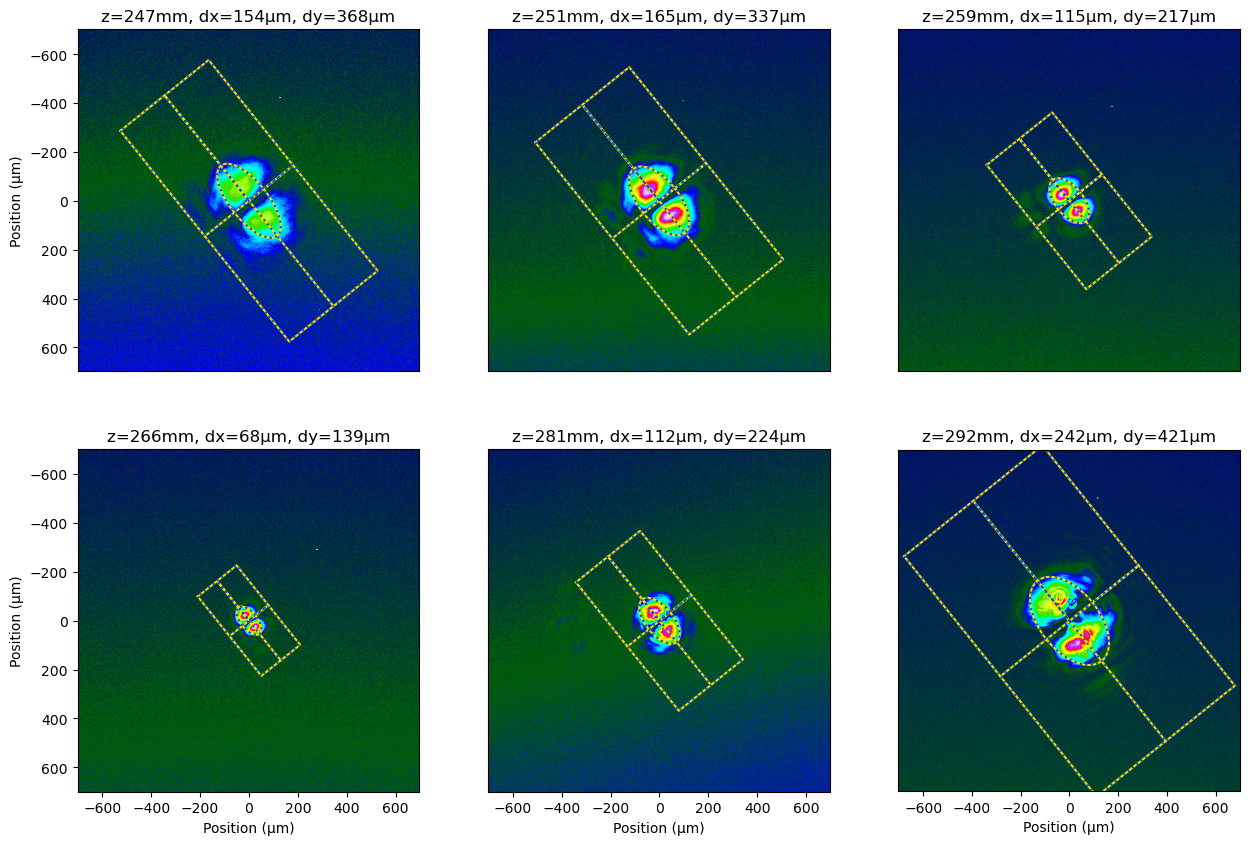
Here is an analysis of a set of images that do not meet the ISO 11146 requirements for determining M² (because the image locations are not taken in right locations relative to the focus). These beam images are from a HeNe laser with slightly misaligned mirrors to primarily lase in a TEM₀₁ transverse mode. The laser resonator had a fixed rotation of 38.7° from the plane of the optical table.:
lambda0 = 632.8e-9 # meters
z10 = np.array([247,251,259,266,281,292])*1e-3 # meters
filenames = ["sb_%.0fmm_10.pgm" % (number*1e3) for number in z10]

# the 12-bit pixel images are stored in high-order bits in 16-bit values
tem10 = [imageio.imread(name)>>4 for name in filenames]

# remove top to eliminate artifact
for i in range(len(z10)):
    tem10[i] = tem10[i][200:,:]

# find beam rotated by 38.7° in all images
fixed_rotation = np.radians(38.7)
options = {'pixel_size': 3.75, 'units': "µm", 'crop': [1400,1400], 'z':z10, 'phi':fixed_rotation}
dy, dx= lbs.beam_size_montage(tem10, **options)  # dy and dx in microns
plt.show()
produces
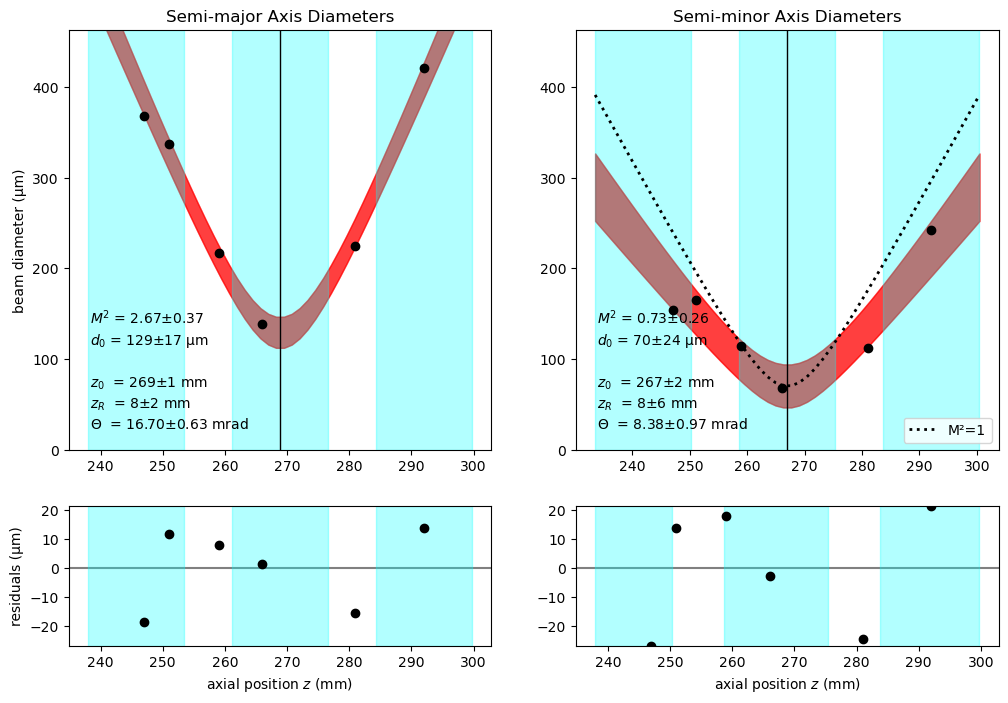
Here is one way to plot the fit using the above diameters:
lbs.M2_diameter_plot(z10, dx*1e-6, lambda0, dy=dy*1e-6)
plt.show()
In the graph on the below right, the dashed line shows the expected divergence of a pure gaussian beam. Since real beams should diverge faster than this (not slower) there is some problem with the measurements (too few!). On the other hand, the M² value the semi-major axis 2.6±0.7 is consistent with the expected value of 3 for the TEM₁₀ mode.
laserbeamsize is licensed under the terms of the MIT license.


