Git Product home page Git Product logo

ajax-panel's People

Contributors

andybaumgar avatar bulletfactory avatar daniellee avatar danilogit avatar linar-jether avatar linkslice avatar mattttt avatar nopzor1200 avatar ryantxu avatar torkelo avatar

Stargazers

 avatar  avatar  avatar  avatar  avatar  avatar  avatar  avatar  avatar  avatar  avatar  avatar  avatar  avatar  avatar  avatar  avatar  avatar  avatar  avatar  avatar  avatar  avatar  avatar  avatar  avatar  avatar  avatar  avatar  avatar  avatar  avatar  avatar  avatar  avatar  avatar  avatar  avatar  avatar  avatar  avatar  avatar  avatar  avatar  avatar  avatar  avatar  avatar  avatar  avatar  avatar  avatar  avatar  avatar  avatar  avatar  avatar  avatar  avatar  avatar  avatar  avatar  avatar  avatar  avatar  avatar  avatar  avatar  avatar  avatar  avatar  avatar  avatar  avatar  avatar  avatar  avatar  avatar  avatar  avatar  avatar  avatar  avatar  avatar  avatar  avatar  avatar  avatar  avatar  avatar  avatar  avatar  avatar  avatar  avatar  avatar  avatar  avatar  avatar  avatar

Watchers

 avatar  avatar  avatar  avatar  avatar  avatar  avatar  avatar  avatar  avatar  avatar

ajax-panel's Issues

GET method does not show the result

package main

import (
“fmt”
“net/http”
“github.com/gorilla/mux”
)
func showRecord(w http.ResponseWriter, r *http.Request) {
out :=“Hello World”
w.Header().Set(“Content-Type”, “text/plain”)
fmt.Fprintf(w,out)

}
func handleRequests() {
router :=mux.NewRouter()
router.HandleFunc("/dashboard/show",showRecord).Methods(“GET”)
http.ListenAndServe(":8080", router)
}

func main() {
handleRequests()
}

In ryantx-ajax-panel I am able to get the output using iframe. But when using GET method in the panel getting the below error

Request Error
{“data”:{“message”:“Unexpected error”}}

Please guide how to get the output using GET method instead of iframe.

Thanks,
Debasish

support multiple requests in one panel

A support request
example:

  1. make a request from one data source => result 1
  2. make another request from another data source => result 2
    ...

aggregate results, and show the final result in an angular template.

rsp.headers is not a function ERROR

My grafana version is 6.7.0
My ajax plugin is the latest.
I am trying to use the plugin and i am getting the error in dev tools console after call a post request, the request is sent normally and the response is get normally to.

image

This is making the ajax plugin to not render the message that is sent on response but after i click in grafana refresh button the previous message is rendered.

Iframe height

Iframe to load video, looks correct at first.

Screen Shot 2019-08-19 at 4 07 26 PM

But then after saving and coming back it cuts off the bottom of the frame.

Screen Shot 2019-08-19 at 4 07 59 PM

How do I correct this?

Split the project

Hey Team,

I am going to work on code based on this project and split the request and the display into a data source and a panel. The Goal is to have a data source with the ability to have multiple URLs that you can call. This should allow you to make more dynamic UI experiences with sourced data from more than one location. Also, it will allow you to use generic data sources and make custom panels without having to make a new plugin each time.

I'm reaching out to see if you wanted to update this project and make a new one or make two totally new ones, or I can just make new ones and not bother you.

Let me know
Thanks

"error loading" in Philips smart tv

the plugin is working nice on a chrome browser on pc, but i'm getting this error in Philips smart TV

image

is there some configuration to do ?

we are using Grafana Open Source v7.2.2 (ad9d408ac2)
ajax-panel Version 0.0.7-dev

in log, some errors:
t=2020-10-26T16:45:00-0300 lvl=eror msg="Data proxy error" logger=data-proxy-log userId=2 orgId=1 uname=codam path=/api/datasources/proxy/1 remote_addr=192.168.1.158 referer="http://192.168.1.11:3000/d/WmvPAFtGz/gtr-olho-vivo-mes?orgId=1&kiosk=tv&orgld=1&refresh=5m" error="http: proxy error: context canceled" t=2020-10-26T16:45:00-0300 lvl=info msg="Request Completed" logger=context userId=2 orgId=1 uname=codam method=GET path=/api/datasources/proxy/1 status=502 remote_addr=192.168.1.158 time_ms=626 size=0 referer="http://192.168.1.11:3000/d/WmvPAFtGz/gtr-olho-vivo-mes?orgId=1&kiosk=tv&orgld=1&refresh=5m"

HTTP Error (404) Not Found

When updating the plugin using the grafana-cli utility, everything broke, and Grafana shows `HTTP Error (404) Not Found" whenever I load a dashboard that has an Ajax panel on it.

Request URL: http://grafana.mycompany/public/plugins/ryantxu-ajax-panel/module.html?v=1524046009100
Request Method: GET
Status Code: 404 Not Found
Remote Address: 10.0.99.99:80
Referrer Policy: no-referrer-when-downgrade

It makes me wonder if I need to update Grafana, but idk...

Grafana v5.0.0-beta5 (commit: c21d9de) 

Images not rendering well

I'm trying to show a decision tree that is built with some input on the Grafana Dashboard and I get this al the image values but no render for them.
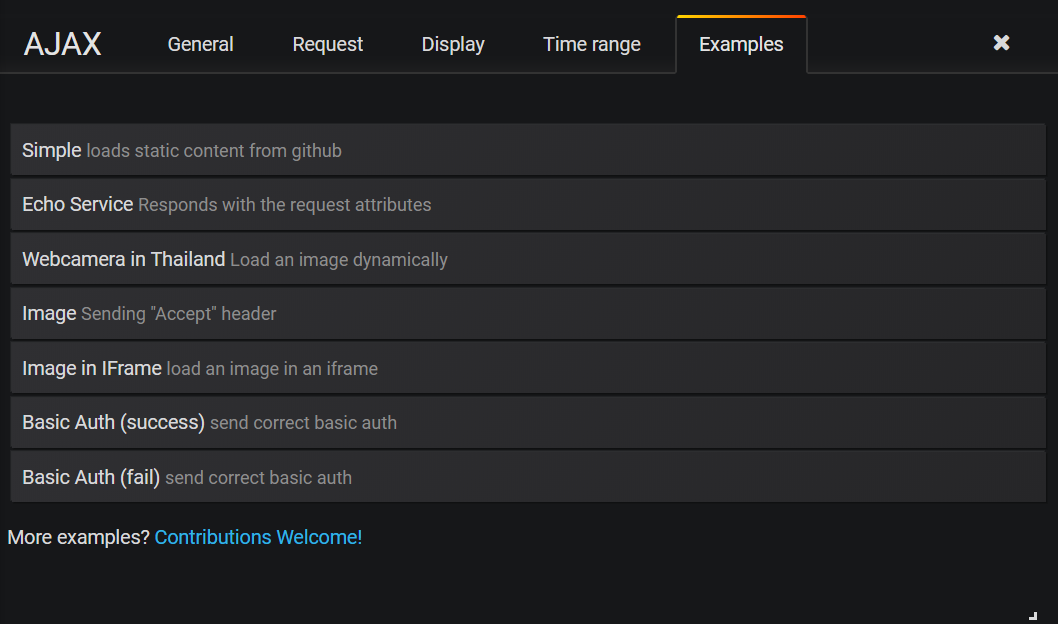
You could replicate it by picking the image accept header example of the panel .

descarga (5)

URL Display in Grafana 7.0

Hi team,

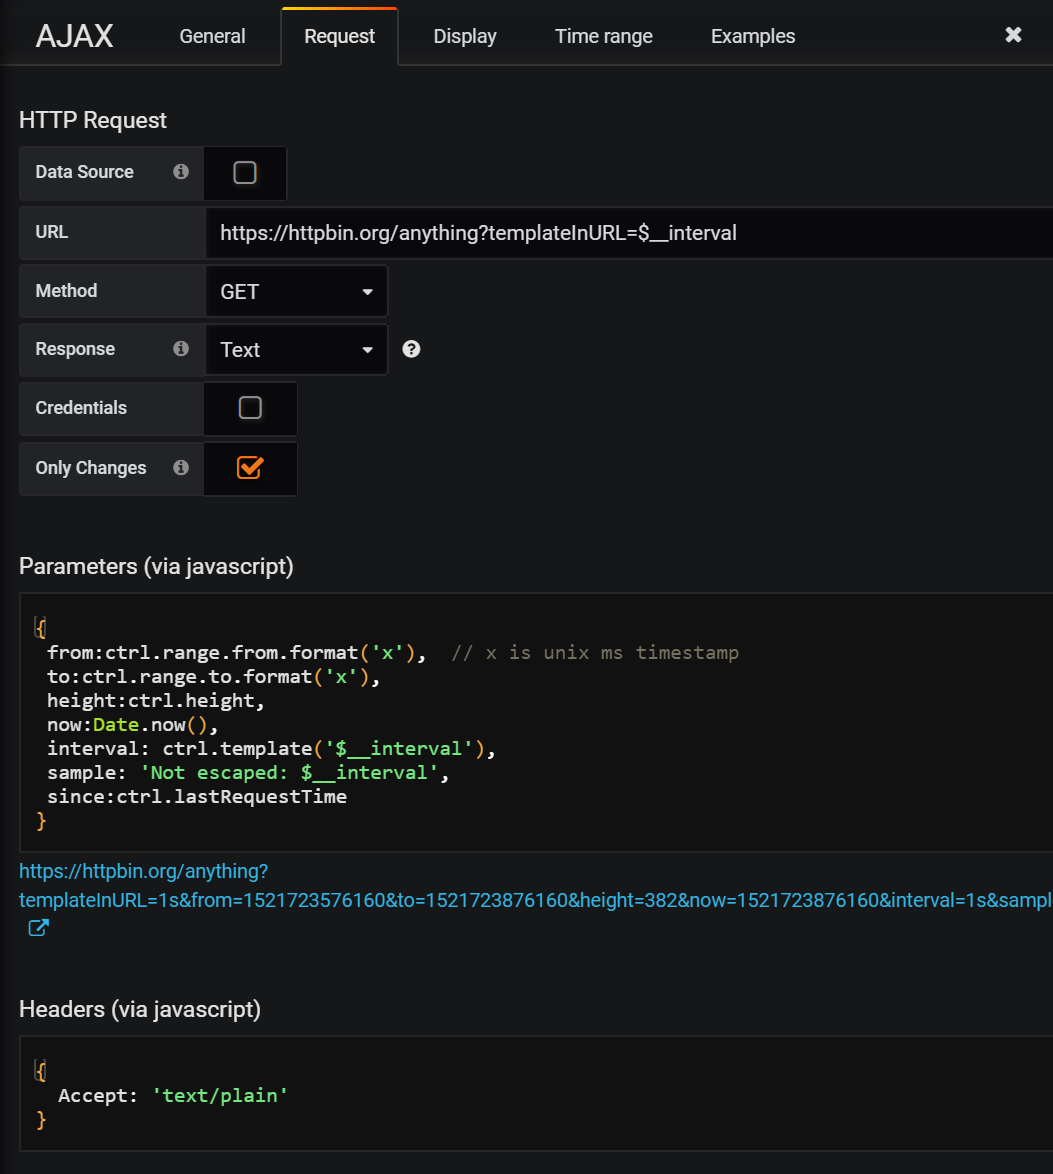
In previous versions of Grafana, there is a display of a sample URL that Ajax panel requests. But in Grafana 7.0, the URL is not displayed to see how it is formed to query the data source. This helps us a lot while testing variables.

image

Passing panel width in request

Great plugin!

However, is it possible somehow to pass the Grafana panel width in the request args the same fashion that height is supported?

I tried using { height:ctrl.height, width:ctrl.width } in the Parameters (via javascript) section, but width in query string is empty.

e.g:
"GET /panels/chart/6?height=355&width= HTTP/1.1" 200

I am trying to return a plot in an iframe so this is really important in this case.

I'll appreciate any workaround / nasty hack / guidance just to get this working.

Thanks
David

Delayed variables update

Hi!
I have a problem with using variables in my GET request. My url looks like this:
http://example.com?var1=$var
Now, whenever I change the dashboard variable, it does not automatically gets inserted into the URL. Not even refresh works. When I change the variable to some other value, the old value gets inserted instead. The only way to force the correct substitution is by manually clicking "apply timerange" in time picker.

What might be the problem? I am using Grafana 7.5.4, but had the same problem on 7.1.*

Change iFrame refresh Interval?

Using an iframe to display Images works great because of the { __now:Date.now(), } which makes the browser not use the cache of the image. But I can't seem to figure out how to change the value of the $__interval | 20s. Is there a way to do it?

display of local hmtl

Hi there,

All I want to do is display a local .html file in my grafana dashboard.
If I copy the html files content into the Text-Panel manually and set it on display mode HTML it works fine. But the html will be generated automatically every day. So i want to automate that process.

I tried every for me conceivable way to do it, but I can't get it working...

The file is stored in /usr/share/grafana/public/img/test.html

As the file can not be attatched as html, I saved it as a txt file.
test.txt

Any idea on how to get the file displayed?

Thanks a lot!!
Have a great one!

Ajax panel is loaded with right scroll after updating Grafana

After updating Grafana to latest version 6.3.5 the Iframe panel always load with right scroll bar and the content is not shown completely.

When editing or resizing the panel the complete content is shown and scroll bar is not shown. The issue is persisting on Google Chrome, IE and Edge.

Love the Ajax panel hope you can fix the issue..

image

Pass dashboard variables through as javascript parameters

Hi,

I am using the AJAX panel to draw custom graphs with plotly.js and it works great.

I’m trying to pass through a dashboard variable to the endpoint as a URL query. It works great if I set it manually in the ‘Parameters (via javascript)’ box but when I try to set it to the variable from the dashboard in the $MyVar format it errors with ‘$MyVar is not defined’.

image
image.png
731×350 13.2 KB

image
Am I doing something wrong or does the AJAX panel not have the access to pass through dashboard level configured variables? I’m pretty sure some of the global variables work here.

Im running Grafana v5.3.4 (69630b9) and AJAX plugin version 0.0.5

Thanks to ryantxu for the awesome plugin!

Thanks
Brett

New render option - safe HTML

Hi,
I have certain specific datasources and I need to load some metrics from these datasources to Grafana. So I created simple app, which creates HTML snippet with desired content, which is then loaded to Grafana by this plugin. I also add inline styles to my template. My app creates HTML snippet similar to

<div style="color: #d8d9da; height: 100%;">
<div style="display: flex; align-items: center; height: 100%;font-size: 2.5rem;color:#299c46">
    <div style="flex-grow: 1; text-align: center;">
        <div style="font-weight: 500; margin: 4px;">0</div>
        <div style="font-weight: 500;"></div>
    </div>
</div>
</div>

But result in Grafana after rendering is

<div>
<div>
    <div>
        <div>0</div>
        <div></div>
    </div>
</div>
</div>

I believe the reason for this is Angular SCE feature, which is used when rendering content as HTML. It would be nice if inline styles remain in HTML, because snippet mentioned above is useless without colors (green - ok, red - failure).

Panels not updating

I have an AJAX Panel reading from an API, configured to get the results as JSON and display using angular templates.

Everything works when I'm editing the panel, but after I close and reopen the dashboard the panel is empty. It remains empty even when I refresh the dashboard.

If I edit the panel again, and change anything on the Request tab, nothing happens and the panel remains empty.

If I change anything on the display tab the panel is shown correctly, but only for a single refresh. After I close the dashboard same problem happens again.

Using plugin 0.0.5 and Grafana 5.4.0. Panel JSON below:

{
  "gridPos": {
    "h": 6,
    "w": 7,
    "x": 0,
    "y": 0
  },
  "header_js": "{}",
  "id": 2,
  "links": [],
  "method": "GET",
  "mode": "template",
  "params_js": "",
  "responseType": "json",
  "showTime": false,
  "showTimeFormat": "LTS",
  "showTimePrefix": null,
  "showTimeValue": "request",
  "skipSameURL": false,
  "template": "<h4>Repository</h4>\n<p>{{ response.snapshots[0].repository }}</p>\n\n<h4>Snapshot</h4>\n<p>{{ response.snapshots[0].snapshot }}</p>\n\n<h4>Progress</h4>\n<p><progress  value=\"{{ response.snapshots[0].stats.processed.size_in_bytes }}\" \n              max=\"{{ response.snapshots[0].stats.total.size_in_bytes }}\"\n              style=\"width: 400px;\"\n              ></progress> </p>\n",
  "templateResponse": true,
  "title": "Snapshot Progress",
  "type": "ryantxu-ajax-panel",
  "url": "http://XXXXXXXXX",
  "withCredentials": false
}

Get image from camera - "data": null

Versions:

dismiss@mss-grafana01:~/tmp$ sudo grafana-cli -v
Grafana cli version 5.2.1

dismiss@mss-grafana01:~/tmp$ sudo grafana-cli plugins ls
installed plugins:
grafana-clock-panel @ 0.1.0 
grafana-piechart-panel @ 1.3.3 
grafana-worldmap-panel @ 0.0.13 
ryantxu-ajax-panel @ 0.0.5 

What i get with curl on same host:

dismiss@mss-grafana01:~/tmp$ curl -vs http://172.21.27.50/GetImage.cgi?CH=0 --output ./img05.jpeg
*   Trying 172.21.27.50...
* TCP_NODELAY set
* Connected to 172.21.27.50 (172.21.27.50) port 80 (#0)
> GET /GetImage.cgi?CH=0 HTTP/1.1
> Host: 172.21.27.50
> User-Agent: curl/7.58.0
> Accept: */*
> 
* HTTP 1.0, assume close after body
< HTTP/1.0 200 Ok
< Server: httpd
< Date: Thu, 26 Jul 2018 07:22:53 GMT
< Cache-Control: no-cache
< Pragma: no-cache
< Expires: 0
< Connection: close
< Content-Type: image/jpeg
< 
{ [1277 bytes data]
* Closing connection 0

In browser:
image

In Grafana (used Image Sending "Accept" header example):

image

Tried Blob/Array buffer response but still got blank screen.

And if i switch to Display tab and select Preformatted text i got more details on error:

<h1>Error</h1><pre>{
 "err": {
  "data": null,
  "status": -1,
  "config": {
   "method": "GET",
   "transformRequest": [
    null
   ],
   "transformResponse": [
    null
   ],
   "jsonpCallbackParam": "callback",
   "responseType": "arraybuffer",
   "url": "http://172.21.27.50/GetImage.cgi?CH=0",
   "params": {},
   "headers": {
    "Accept": "image/jpeg"
   },
   "cache": false,
   "withCredentials": false,
   "retry": 0
  },
  "statusText": "",
  "xhrStatus": "error"
 },
 "cancelled": true
}</pre>

What I'm doing wrong?

The plugin is unsigned

Grafana Labs can’t guarantee the integrity of this unsigned plugin Is it possible for the plugin to be signed?

Avoid scrolling of iframe panel

Hi,

thanks for the nice plugin!

I have a small issue with including iframes:
It happens that the panel is vertically scrollable, even when the content fits the panel size (also in the "Image in IFrame" example). This hinders scrolling of the whole dashboard, if the panel has focus.

The plugin sets "scrollable" constantly to true. Would it be possible to make this setting an option in the configuration page to avoid this behaviour?

(Grafana 6.0.1)

2019-03-20_09h32_08

CORS support

Is there a way to add CORS support to the GET requests? Other than using a proxy. I am using a node.js proxy to enrich the GET request with the CORS headers and this works. But I was wondering if there is an official way to do this.

Usage for datasource option

Hi, very useful plugin.
I am trying to figure out what is the use of datasource option for authentication.
Can you provide any usage examples?

Thanks,

Consuming the result data

Is it possible to consume the API result to display the info in another panel, for example? I'm retrieving system status from my external source and I would like to display with a table or gauge panel.

This is my api response (JSON Tree)

5:Object
ProbeGuid:"0262384a8dc149fdd45f24b1857bb2a5"
ErrorLevel:"NoError"
LastCheck:"2021-02-24T12:31:39"
CheckPointID:122
ErrorDescription:"OK"
Uptime:100
ErrorCode:0

thank you

Support empty text response

Hello,

my "Text" panel loads an URL that either returns text or an empty response (empty string).

Today, I updated to the current version of Grafana and this plugin and in case I get an empty string as response, the panel shows [object Object] via the "Direkt HTML" mode.

Then I switched to "Angular Template" and saw that the response variable is an object with {"data":"","status":200, ...}.

I changed the template to use response.data and it looked fine (empty panel), but now those panels who should contain text are empty too. It turned out that the response variable for those panels contain the text returned by the URL and therefore there is no response.data.

Conclusion:

Empty response: response contains object
Non-empty response: response contains the text

It would be nice if it would have consistent behavior.

Iterating through response object

Hi there,

Question - are you able to iterate (loop) through the response object using the angular template? Current our data looks like
[
{ "test": 1 },
{ "test": 2 }
]
and I want to display it using a template like:

{{ response.test }}

How can we perform this function?

Provide a way to avoid URL escaping some chars

I'm trying to do a Github query search. If I use the URL directly then I can type something like:

https://api.github.com/search/issues?q=state:open

but if I want to use the parameters via Javascript options with something like:

{
   q: "state:open"
}

then the : will be URL escaped making the URL:

https://api.github.com/search/issues?q=state%3Aopen

which does not work.

Header does not parse unescaped dashboard variables

I have a dashboard variable which I refer to in the 'Headers' field:
{Authorization: "api-key $apiKey"}

But Chrome Inspector shows it passing the variable as a string, instead of parsing the value of the variable. Chrome outputs:
authorization | api-key $apiKey

I expect it to parse the variable, i.e:
authorization | api-key the-value-of-my-variable

I can see the variable exists and has the correct value (as you have handily shown a list of variables in the panel edit page).

Variables are correctly parsed for the URL. So looks as if it is specific to parsing the header.

Would be good if there was a preview of the header too.

Grafana version: 6.7.2
AJAX Panel version: 0.0.6 (latest)

Text style options

Hey,

it would be nice if we had more control over the text that is displayed. Things like font size, color and position would be enough for the start I guess. I want mine to look the same as the Singlestat panel.

Proper releases planned ?

Hello,

are there any plans to implement proper releases / versions on Github ? Appears there is only 0.0.6 on Github.com and Grafana lists 0.0.7-dev and it seems like there is a pretty decent velocity of commits between them...

Thanks !

HTML Panels not working

Is this plugin being maintained?
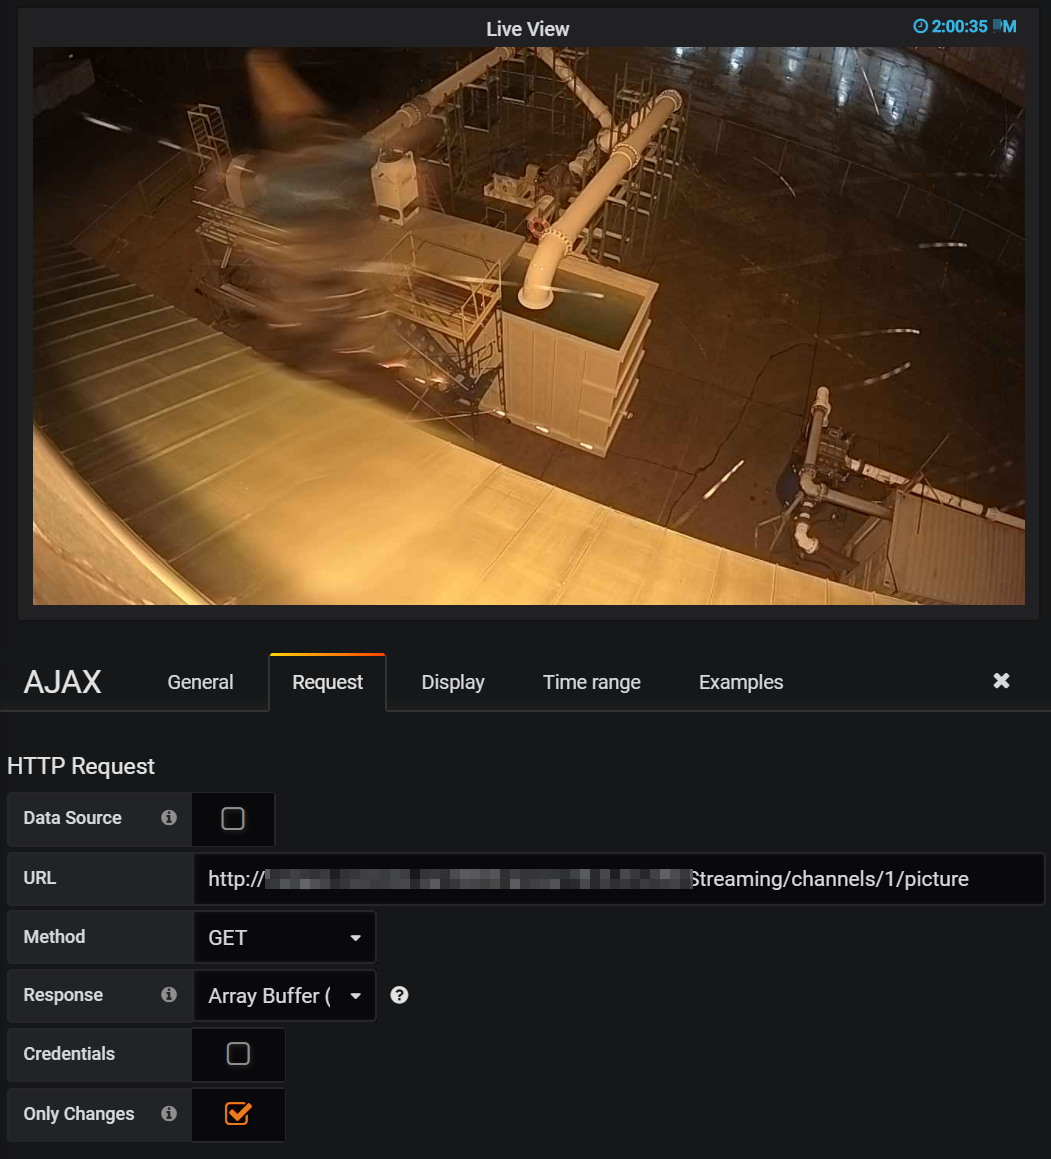
I have an extremely simple example where I want an external image to refresh (similar to the Webcam example)
I'm using Grafana 7.0.1, and the plugin no longer seems to work, there are many different console errors.
I'm not sure if Issue #60 is the cause of the underlying issue, but I am also getting that error.

Add Dashboard Variables to the scope of Angular Template

As a User i want to add the Dashboard Variables inside the Angular Template.
I Want to define a Variable for a Dashboard to use it as Template and will create a Panel which then uses this variable for the Rest Call and Angular Template to show the user the Variable in a special way

Panel does not load when suddenly in view, not scrolled into

The panel does not receive load event, when suddenly is displayed, but not scrolled into view - say panel on page bottom of a large dashboard, and the user presses End key or PgDn. I figured it has to do with grafana's isInView parameter, which only fires when the panel is scrolled into view or it is half in-view, but not fully. It might be a grafana-side fix, but since @ryantxu did the lazy loading part there, I figured I'd post it here.

Here the AJAX panel is on the top left. When the user navigates to the view, it does not load, after a few up and down scroll events, it does.
ajax-load

Help with Bearer Token format

I am trying to use the Ajax component to call out to an API but am having issues with getting the header right for Bearer Token Auth. It should return a number but all I get is the full url as below.

Settings:
Source: HTTP
URL: https://myservice.com/service/core/v2/Users?count=true
Method: GET
Response: JSON
Credentials: Off
Only Changes: On
Parameters: None (left blank)
Headers:
“Authorization”: “Bearer xxxxxxxxxxx”
Display Mode: Direct HTML

This is the output ->
{“err”:{“data”:null,“status”:-1,“config”:{“method”:“GET”,“transformRequest”:[null],“transformResponse”:[null],“jsonpCallbackParam”:“callback”,“responseType”:“json”,“url”:“https://myservice.com/service/core/v2/Users?count=true",“params”:{},“headers”:{“Authorization”:"Bearer xxxxxxxxxx”,“Accept”:“application/json, text/plain, /”},“cache”:false,“withCredentials”:false,“retry”:0},“statusText”:"",“xhrStatus”:“error”},“cancelled”:true}

Prevent iframe refresh

Hello,

Thank you for this precious plugin. I'll deal with json data later. For now I could'nt find a way to prevent grafana from refreshing the ajax/iframe panel. It makes my ajax panel unusable as is. How do you deal with this?

printer2_2018-08-27_11h25_05

Problems with Grafana 5.1

We updated Grafana to 5.1 recently and had problems using a simple text query. I have no clue why it's not working. I tried to clean my browser caches, etc. but with no luck. We did a revert to Grafana 5.0.4 and it worked again.

Did you have the chance to have a look at Grafana 5.1?

Thanks. And also thank you for the plugin. 👍

Reload on Timepicker change in Grafana 7.0

Hi team,

The Ajax panel doesn't reload on Timepicker change. Like for example if the user selects the Last 1 hour and then selects last 24 hours, the data/panel does reload with respect to the time change in the Grafana panel in the 7.0 version.

Is there a workaround solution for this?

Regards,
Rama.

Getting the current Grafana user

I am getting the current username like this:

ctrl.$scope.$$childTail.$root.$$childTail.$$prevSibling.$$prevSibling.$$prevSibling.ctrl.searchSrv.backendSrv.contextSrv.user.login

This would return admin since I'm logged in as admin.

Is there any simpler way?

Request rotating

Hi,

is it possible to change the request url on every interval, so you can rotate cameras without rotate the entire dashboard?

Or it is possible to add an counter via javascript so we can manipulate the response on server side?

best regards and a happy new year!

Inline styling

Hi, I've used the panel to return the HTML below but the styling of the table doesn't render in the panel. Does the panel support this type of styling?

0
ON

Error Handling for 404 Responses

Again - thanks for this plugin.

I wanted to know if you had any examples on how to perform some error handling using the Ajax template. Whenever I hit a bad entry, the api sometimes returns a 404.

``
Sorry about the incomplete subject. Should be Error Handling the response object

e.g.
{ "data": null, "status": 404, "config": { "method": "GET", "transformRequest": [ null ], "transformResponse": [ null ], "jsonpCallbackParam": "callback", "responseType": "json", "url": "api/datasources/proxy/90/clients/win2012r2-674fb.dev.workspace.cloud.td.com", "params": { }, "headers": { "Accept": "application/json", "X-Grafana-Org-Id": 4 }, "cache": false, "withCredentials": false, "retry": 0 }, "statusText": "Not Found", "xhrStatus": "complete" }

Feature request: Send query result as POST body (or some other way) to HTTP endpoint

If a query is configured, you can't send that data to the configured HTTP endpoint. This feature request asks for the possibility to do just that. The endpoint can then, for example, return a custom visualization without having to do any querying of its own and can be implemented stateless, making it a nice target for say an AWS serverless function. It would easily expand Grafana's visualization abilities without having to implement an entirely new panel.

Recommend Projects

  • React photo React

    A declarative, efficient, and flexible JavaScript library for building user interfaces.

  • Vue.js photo Vue.js

    🖖 Vue.js is a progressive, incrementally-adoptable JavaScript framework for building UI on the web.

  • Typescript photo Typescript

    TypeScript is a superset of JavaScript that compiles to clean JavaScript output.

  • TensorFlow photo TensorFlow

    An Open Source Machine Learning Framework for Everyone

  • Django photo Django

    The Web framework for perfectionists with deadlines.

  • D3 photo D3

    Bring data to life with SVG, Canvas and HTML. 📊📈🎉

Recommend Topics

  • javascript

    JavaScript (JS) is a lightweight interpreted programming language with first-class functions.

  • web

    Some thing interesting about web. New door for the world.

  • server

    A server is a program made to process requests and deliver data to clients.

  • Machine learning

    Machine learning is a way of modeling and interpreting data that allows a piece of software to respond intelligently.

  • Game

    Some thing interesting about game, make everyone happy.

Recommend Org

  • Facebook photo Facebook

    We are working to build community through open source technology. NB: members must have two-factor auth.

  • Microsoft photo Microsoft

    Open source projects and samples from Microsoft.

  • Google photo Google

    Google ❤️ Open Source for everyone.

  • D3 photo D3

    Data-Driven Documents codes.