- More flexible configuration script.
- Use the yaml file that meets matplotlib requirements to control the drawing format.
- Replace the json with a more flexible configuration format, such as yaml or toml.
- Add test scripts.
- Add more detailed comments.
- Optimize the code for exporting evaluation results.
- Implement code to export results to XLSX files.
- Optimize the code for exporting to XLSX files.
- Consider if using a text format like CSV would be better? It can be opened as a text file and also organized using Excel.
- Replace
os.pathwithpathlib.Path. - Improve the code for grouping data, supporting tasks like CoSOD, Video Binary Segmentation, etc.
- Support concurrency strategy to speed up computation. Retained support for multi-threading, removed the previous multi-process code.
- Currently, due to the use of multi-threading, there is an issue with extra log information being written, which needs more optimization.
- Separate USVOS code into another repository PyDavis16EvalToolbox.
- Use more rapid and accurate metric code PySODMetrics as the evaluation benchmark.
Tip
- Some methods provide result names that do not match the original dataset's ground truth names.
- [Note] (2021-11-18) Currently, support is provided for both
prefixandsuffixnames, so users generally do not need to change the names themselves. - [Optional] The provided script tools/rename.py can be used to rename files in bulk. Please use it carefully to avoid data overwriting.
- [Optional] Other tools, such as
renameon Linux, andMicrosoft PowerToyson Windows.
- [Note] (2021-11-18) Currently, support is provided for both
- Benefiting from PySODMetrics, it supports a richer set of metrics. For more details, see
utils/recorders/metric_recorder.py.- Supports evaluating grayscale images, such as predictions from saliency object detection (SOD) and camouflaged object detection (COD) tasks.
- MAE
- Emeasure
- Smeasure
- Weighted Fmeasure
- Maximum/Average/Adaptive Fmeasure
- Maximum/Average/Adaptive Precision
- Maximum/Average/Adaptive Recall
- Maximum/Average/Adaptive IoU
- Maximum/Average/Adaptive Dice
- Maximum/Average/Adaptive Specificity
- Maximum/Average/Adaptive BER
- Fmeasure-Threshold Curve (run
eval.pywith the metricfmeasure) - Emeasure-Threshold Curve (run
eval.pywith the metricem) - Precision-Recall Curve (run
eval.pywith the metricsprecisionandrecall, this is different from previous versions as the calculation ofprecisionandrecallhas been separated fromfmeasure)
- Supports evaluating binary images, such as common binary segmentation tasks.
- Binary Fmeasure
- Binary Precision
- Binary Recall
- Binary IoU
- Binary Dice
- Binary Specificity
- Binary BER
- Supports evaluating grayscale images, such as predictions from saliency object detection (SOD) and camouflaged object detection (COD) tasks.
- Richer functions.
- Supports evaluating models according to the configuration.
- Supports drawing
PR curves,F-measure curvesandE-measure curvesbased on configuration and evaluation results. - Supports exporting results to TXT files.
- Supports exporting results to XLSX files (re-supported on January 4, 2021).
- Supports exporting LaTeX table code from generated
.npyfiles, and marks the top three methods with different colors. - … :>.
Install the required libraries: pip install -r requirements.txt
The metric evaluation is based on my another project: PySODMetrics. Bug reports are welcome!
This project relies on json files to store data. Examples for dataset and method configurations are provided in ./examples: config_dataset_json_example.json and config_method_json_example.json. You can directly modify them for subsequent steps.
Note
- Please note that since this project relies on OpenCV to read images, ensure that the path strings do not contain non-ASCII characters.
- Make sure that the name of the dataset in the dataset configuration file matches the name of the dataset in the method configuration file. After preparing the json files, it is recommended to use the provided
tools/check_path.pyto check if the path information in the json files is correct.
More Details on Configuration
Example 1: Dataset Configuration
Note, "image" is not necessary here. The actual evaluation only reads "mask".
{
    "LFSD": {
        "image": {
            "path": "Path_Of_RGBDSOD_Datasets/LFSD/Image",
            "prefix": "some_gt_prefix",
            "suffix": ".jpg"
        },
        "mask": {
            "path": "Path_Of_RGBDSOD_Datasets/LFSD/Mask",
            "prefix": "some_gt_prefix",
            "suffix": ".png"
        }
    }
}
Example 2: Method Configuration
{
    "Method1": {
        "PASCAL-S": {
            "path": "Path_Of_Method1/PASCAL-S",
            "prefix": "some_method_prefix",
            "suffix": ".png"
        },
        "ECSSD": {
            "path": "Path_Of_Method1/ECSSD",
            "prefix": "some_method_prefix",
            "suffix": ".png"
        },
        "HKU-IS": {
            "path": "Path_Of_Method1/HKU-IS",
            "prefix": "some_method_prefix",
            "suffix": ".png"
        },
        "DUT-OMRON": {
            "path": "Path_Of_Method1/DUT-OMRON",
            "prefix": "some_method_prefix",
            "suffix": ".png"
        },
        "DUTS-TE": {
            "path": "Path_Of_Method1/DUTS-TE",
            "suffix": ".png"
        }
    }
}
Here, path represents the directory where image data is stored. prefix and suffix refer to the prefix and suffix outside the common part in the names of the predicted images and the actual ground truth images.
During the evaluation process, the matching of method predictions and dataset ground truths is based on the shared part of the file names. Their naming patterns are preset as [prefix]+[shared-string]+[suffix]. For example, if there are predicted images like method1_00001.jpg, method1_00002.jpg, method1_00003.jpg and ground truth images gt_00001.png, gt_00002.png, gt_00003.png, then we can configure it as follows:
Example 3: Dataset Configuration
{
    "dataset1": {
        "mask": {
            "path": "path/Mask",
            "prefix": "gt_",
            "suffix": ".png"
        }
    }
}
Example 4: Method Configuration
{
    "method1": {
        "dataset1": {
            "path": "path/dataset1",
            "prefix": "method1_",
            "suffix": ".jpg"
        }
    }
}- Once all the previous steps are correctly completed, you can begin the evaluation. For usage of the evaluation script, refer to the output of the command
python eval.py --help. - Add configuration options according to your needs and execute the command. If there are no exceptions, it will generate result files with the specified filename.
- If not all files are specified, it will directly output the results, as detailed in the help information of
eval.py. - If
--curves-npyis specified, the metrics information related to drawing will be saved in the corresponding.npyfile.
- If not all files are specified, it will directly output the results, as detailed in the help information of
- [Optional] You can use
tools/converter.pyto directly export the LaTeX table code from the generated npy files.
You can use plot.py to read the .npy file to organize and draw PR, F-measure, and E-measure curves for specified methods and datasets as needed. The usage of this script can be seen in the output of python plot.py --help. Add configuration items as per your requirement and execute the command.
The most basic instruction is to specify the values in the figure.figsize item in the configuration file according to the number of subplots reasonably.
Here I'll use the RGB SOD configuration in my local configs folder as an example (necessary modifications should be made according to the actual situation).
# Check Configuration Files
python tools/check_path.py --method-jsons configs/methods/rgb-sod/rgb_sod_methods.json --dataset-jsons configs/datasets/rgb_sod.json
# After ensuring there's nothing unreasonable in the output information, you can begin the evaluation with the following commands:
# --dataset-json: Set `configs/datasets/rgb_sod.json` as dataset configuration file
# --method-json: Set `configs/methods/rgb-sod/rgb_sod_methods.json` as method configuration file
# --metric-npy: Set `output/rgb_sod/metrics.npy` to store the metrics information in npy format
# --curves-npy: Set `output/rgb_sod/curves.npy` to store the curves information in npy format
# --record-txt: Set `output/rgb_sod/results.txt` to store the results information in text format
# --record-xlsx: Set `output/rgb_sod/results.xlsx` to store the results information in Excel format
# --metric-names: Specify `fmeasure em precision recall` as the metrics to be calculated
# --include-methods: Specify the methods from `configs/methods/rgb-sod/rgb_sod_methods.json` to be evaluated
# --include-datasets: Specify the datasets from `configs/datasets/rgb_sod.json` to be evaluated
python eval.py --dataset-json configs/datasets/rgb_sod.json --method-json configs/methods/rgb-sod/rgb_sod_methods.json --metric-npy output/rgb_sod/metrics.npy --curves-npy output/rgb_sod/curves.npy --record-txt output/rgb_sod/results.txt --record-xlsx output/rgb_sod/results.xlsx --metric-names sm wfm mae fmeasure em precision recall --include-methods MINet_R50_2020 GateNet_2020 --include-datasets PASCAL-S ECSSD
# Once you've obtained the curve data file, which in this case is the 'output/rgb_sod/curves.npy' file, you can start drawing the plot.
# For a simple example, after executing the command below, the result will be saved as 'output/rgb_sod/simple_curve_pr.pdf':
# --style-cfg: Specify the style configuration file `examples/single_row_style.yml`,Since there are only a few subplots, you can directly use a single-row configuration.
# --num-rows: The number of subplots in the figure.
# --curves-npys: Use the curve data file `output/rgb_sod/curves.npy` to draw the plot.
# --mode: Use `pr` to draw the `pr` curve, `em` to draw the `E-measure` curve, and `fm` to draw the `F-measure` curve.
# --save-name: Just provide the image save path without the file extension; the code will append the file extension as specified by the `savefig.format` in the `--style-cfg` you designated earlier.
# --alias-yaml: A yaml file that specifies the method and dataset aliases to be used in the plot.
python plot.py --style-cfg examples/single_row_style.yml --num-rows 1 --curves-npys output/rgb_sod/curves.npy --mode pr --save-name output/rgb_sod/simple_curve_pr --alias-yaml configs/rgb_aliases.yaml
# More complex examples, after executing the command below, the result will be saved as 'output/rgb_sod/complex_curve_pr.pdf'.
# --style-cfg: Specify the style configuration file `examples/single_row_style.yml`,Since there are only a few subplots, you can directly use a single-row configuration.
# --num-rows: The number of subplots in the figure.
# --curves-npys: Use the curve data file `output/rgb_sod/curves.npy` to draw the plot.
# --our-methods: The specified method, `MINet_R50_2020`, is highlighted with a bold red solid line in the plot.
# --num-col-legend: The number of columns in the legend.
# --mode: Use `pr` to draw the `pr` curve, `em` to draw the `E-measure` curve, and `fm` to draw the `F-measure` curve.
# --separated-legend: Draw a shared single legend.
# --sharey: Share the y-axis, which will only display the scale value on the first graph in each row.
# --save-name: Just provide the image save path without the file extension; the code will append the file extension as specified by the `savefig.format` in the `--style-cfg` you designated earlier.
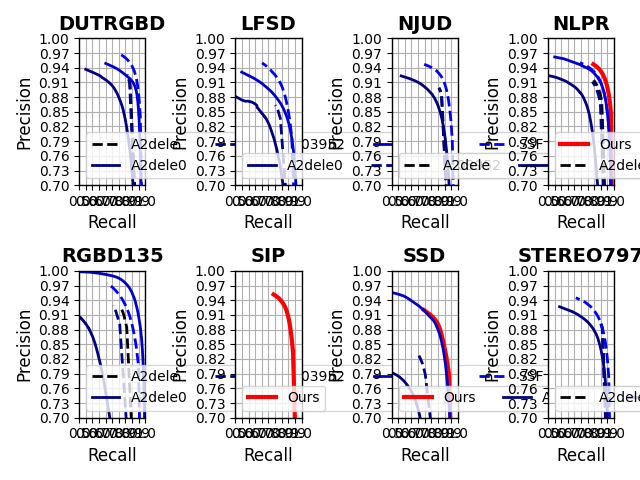
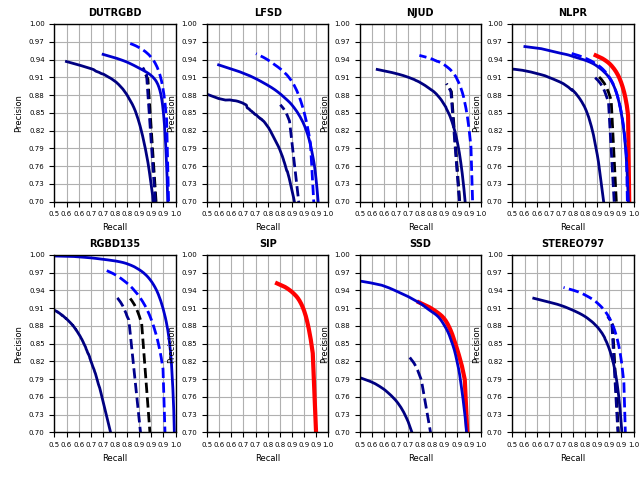
python plot.py --style-cfg examples/single_row_style.yml --num-rows 1 --curves-npys output/rgb_sod/curves.npy --our-methods MINet_R50_2020 --num-col-legend 1 --mode pr --separated-legend --sharey --save-name output/rgb_sod/complex_curve_prPrecision-Recall Curve:

F-measure Curve:

E-measure Curve:

openpyxllibrary: https://www.cnblogs.com/programmer-tlh/p/10461353.htmlremodule: https://www.cnblogs.com/shenjianping/p/11647473.html
@inproceedings{Fmeasure,
    title={Frequency-tuned salient region detection},
    author={Achanta, Radhakrishna and Hemami, Sheila and Estrada, Francisco and S{\"u}sstrunk, Sabine},
    booktitle=CVPR,
    number={CONF},
    pages={1597--1604},
    year={2009}
}

@inproceedings{MAE,
    title={Saliency filters: Contrast based filtering for salient region detection},
    author={Perazzi, Federico and Kr{\"a}henb{\"u}hl, Philipp and Pritch, Yael and Hornung, Alexander},
    booktitle=CVPR,
    pages={733--740},
    year={2012}
}

@inproceedings{Smeasure,
    title={Structure-measure: A new way to eval foreground maps},
    author={Fan, Deng-Ping and Cheng, Ming-Ming and Liu, Yun and Li, Tao and Borji, Ali},
    booktitle=ICCV,
    pages={4548--4557},
    year={2017}
}

@inproceedings{Emeasure,
    title="Enhanced-alignment Measure for Binary Foreground Map Evaluation",
    author="Deng-Ping {Fan} and Cheng {Gong} and Yang {Cao} and Bo {Ren} and Ming-Ming {Cheng} and Ali {Borji}",
    booktitle=IJCAI,
    pages="698--704",
    year={2018}
}

@inproceedings{wFmeasure,
  title={How to eval foreground maps?},
  author={Margolin, Ran and Zelnik-Manor, Lihi and Tal, Ayellet},
  booktitle=CVPR,
  pages={248--255},
  year={2014}
}
![dependabot[bot] avatar](https://avatars.githubusercontent.com/in/29110?v=4 "dependabot[bot]")