The QlikView SVGreader Extension is meant to provide the ability to visualize data on an image or map using color and shading, similar to a choropleth map. Also, there is the option to have a pop up containing data appear when hovering your mouse over a given region.
An SVG image is basically an XML document which contains data telling the internet browser how to draw an image. The different shapes that the SVG draws can be separated out in the XML and thus manipulated and colored however necessary. This extension takes advantage of this technology by allowing the QVW to target and color the different shapes by identifying the ID of the SVG element.
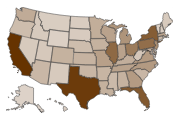
For example, a map of US states will have a shape for the state of Pennsylvania. This state is represented in the SVG image as some code with an ID of "PA". By targeting this ID of "PA" the extension is able to then color this state.A very useful (and free) tool for identifying and manipulating SVG IDs is Inkscape. It can also be used to draw SVGs.
The extension itself is pre-packaged with 34+ maps of various countries and their different regions, as well as a world map and maps of Europe and Africa. In the same package in which you found this document, there should also be a Maps Info.xlsx Excel file listing the maps, their SVG names, and how their regions are identified.
Once a map is chosen and loaded in the extension, the data in the QVW will need to somehow link to the region ID on the SVG. Typically the regions are identified by ISO code. The reason for this is because it is a globally standard code for identifying regions, and it eliminates the possibility for confusion over the naming, spelling, etc. of the different regions. Loading these ISO codes should be fairly easy, and the data can be scraped from sites like Wikipedia without much difficulty.
You can also create custom SVGs of just about anything, even a snail:
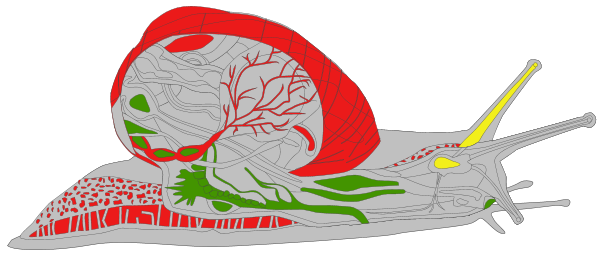
If you create your own custom SVG maps, please contribute them to Qlik Branch
Latest Updates & Ideas
I've fixed some issues people were having (hopefully) with the maps loading strangely. If not, please let me know.
Also, I've added the idea of a "Base" or "Cold" color. This can be used to blend two colors instead of simply shading one color between itself and white. For example, this image shows Swedish provinces with a color expression of green and a Base color of red.

There are several ways that this extension could be improved:
-
Detecting the browser so the extension can avoid using Raphael to draw the SVG. If the browser is compatible with SVGs, it could simply be embedded in as an image with no drawing needed. This would speed it up significantly.
-
Improving the properties panel to make it better organized.
Installation & Use
The properties are relatively straightforward:
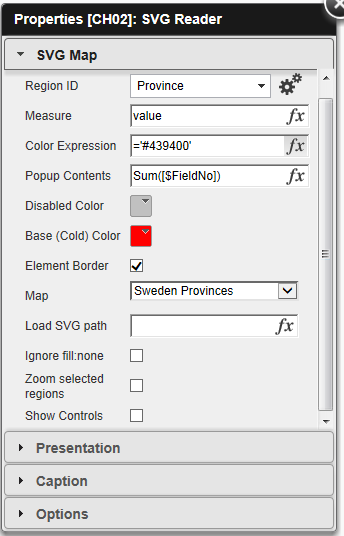
Region ID should be set to the dimension which contains values matching the IDs in the SVG. If they don't match, the extension WON'T WORK
Measure controls the shading. The higher the value, the darker the region will be colored.
Color Expression controls the color. You could use expressions to set this to a variety of colors, similar to a traffic light for example, or you could simply set it to one like this: ='#439400'
Popup Contents can be used to set the contents of the box that appears when you mouse over the regions. You can add text and append it to a measure, for example, like this: ='Sum of Sales: ' & Sum(Sales).
Disabled Color sets the color of regions that are in the SVG but have no data associated to it.
Base (Cold) Color sets the base color to use for the lower values. This can be used to blend colors. Or if you simply want to shade one color, set this to white.
Element Border chooses whether or not to show borders around the SVG elements.
Map is a dropdown which holds the default maps in it.
Load SVG path will accept custom SVGs. The easiest way to load your SVG is to put it into the extension folder, then set this property to the full svg name, like ='Sweden.svg'
Ignore fill:none is to compensate for some improperly formatted SVGs that are difficult to deal with. Basically, if your SVG isn't showing up, try checking this. Otherwise, forget it ever existed.
Zoom Selected regions will set the extension to try to zoom the window to fit only the selected regions. Warning this can cause the extension to slow down greatly if you're loading a large SVG with a lot of data.
Show Controls will add pan and zoom controls to the extension.


