Git Product home page Git Product logo

plotting-examples's Introduction

Plotting Examples

Some examples for plotting different types of data in Matlab, Python, and R

Contributors: VictoriaLynn, matthewjwoodruff, and jdherman

See example_images for the outputs from these files (PNG). Note that publication-quality figures will usually require a vector graphics format (SVG/EPS/PDF) along with some manual editing to improve font clarity, etc. The examples shown here are in unedited raster format and are only meant to be illustrative.

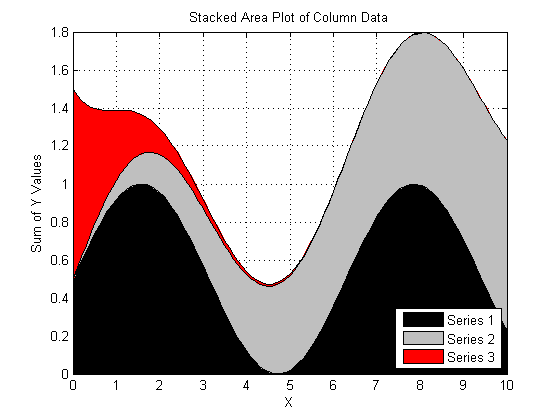
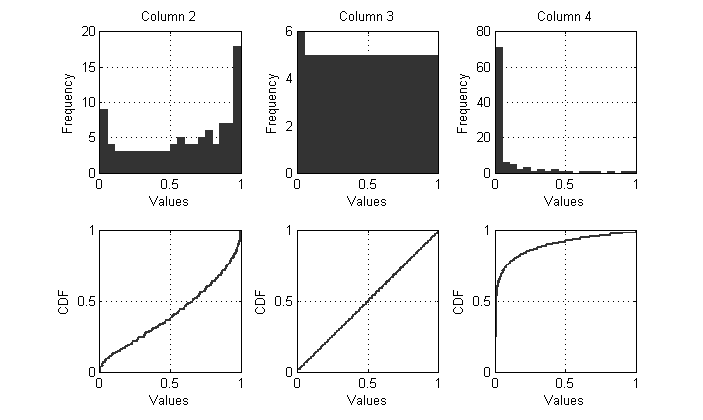
Column data

From example_data/column_data.txt. Used with:

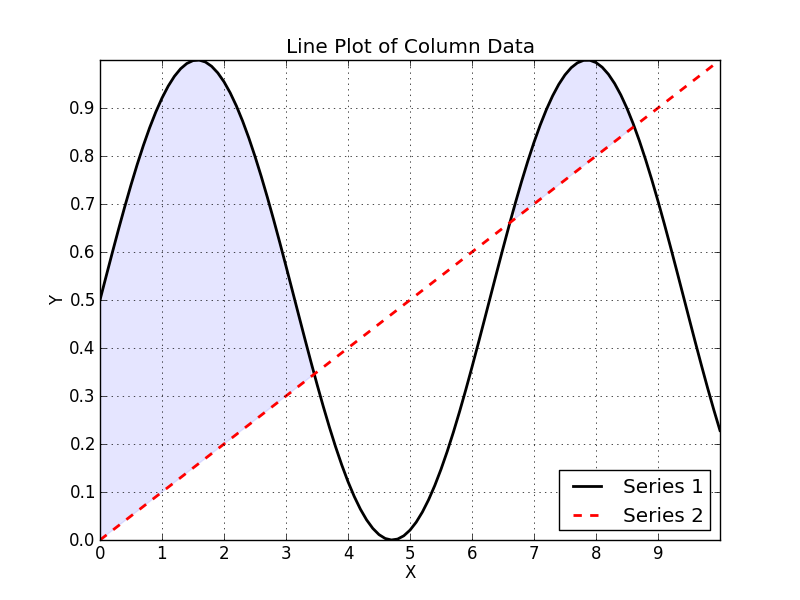
  • line_plot: Standard line plot with different formatting options

Image

  • fill_between: Same data as line_plot, with shaded fill between Series 1 and Series 2

Image

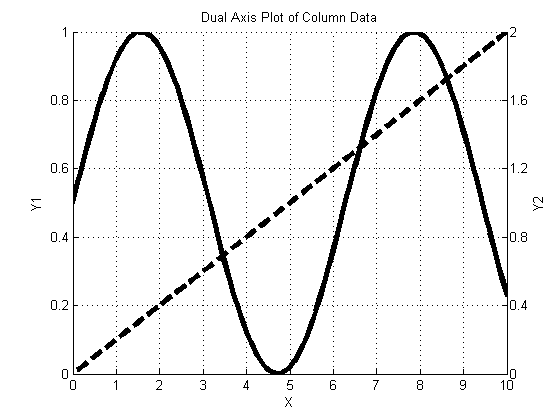
  • dual_axis: Plot column data using two different Y-axes

Image

Image

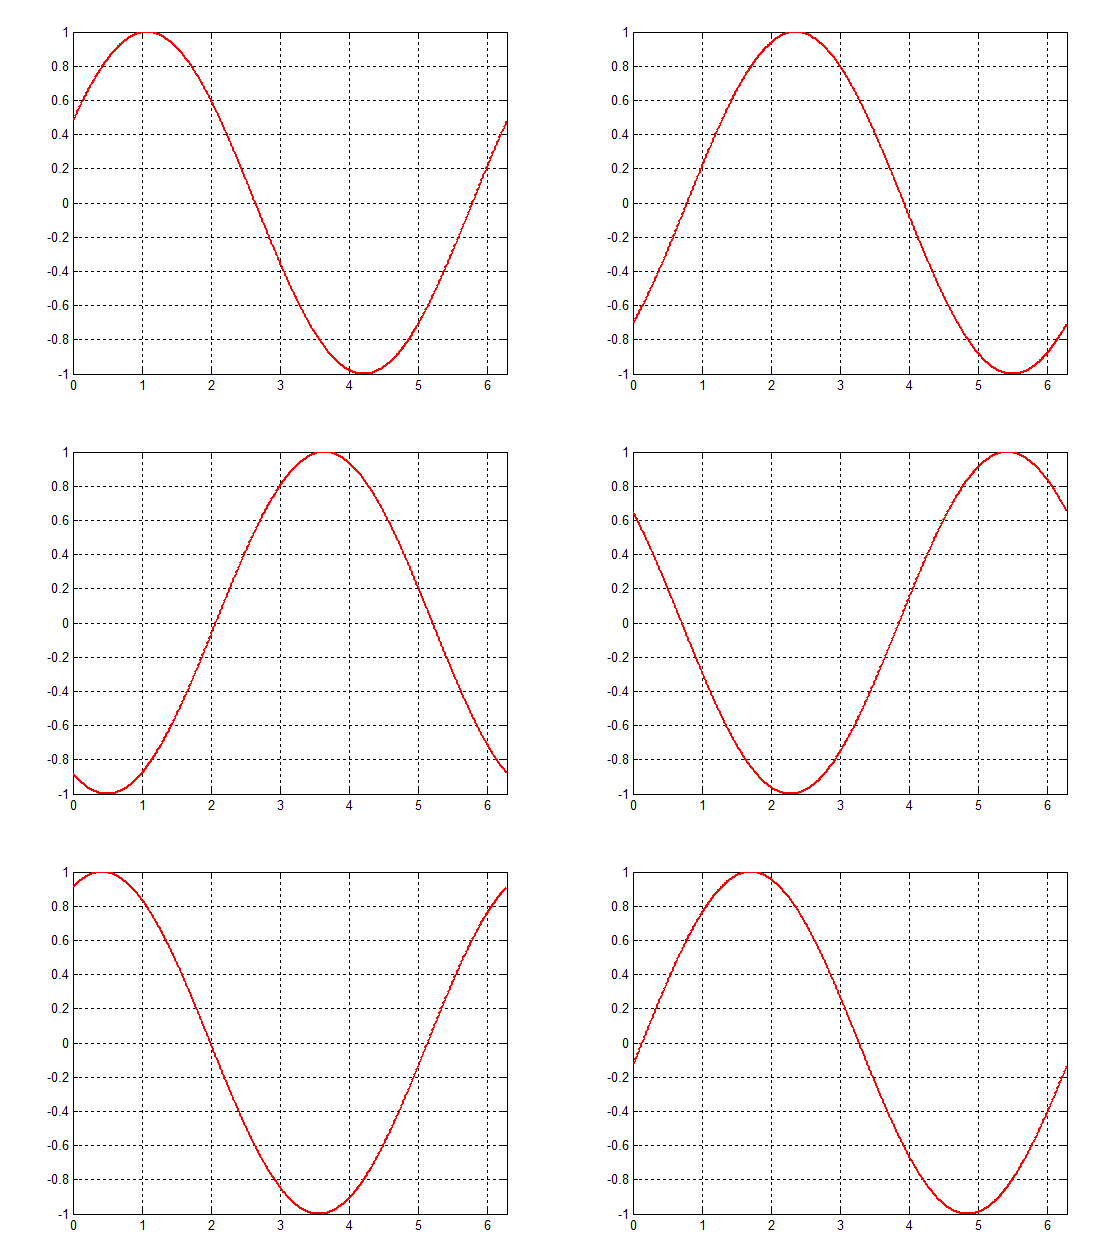
  • animated_gif: Save loop of images as a .gif animation. The Python version requires you to use imagemagick after the fact to stick the frames together: convert -delay 15 -loop 0 frame*png animation.gif.

Image

Image

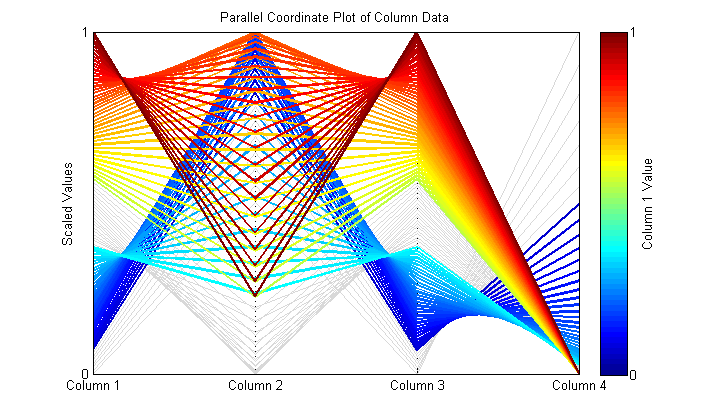
  • parallel_coordinate: Plots row entries as lines instead of columns. Options to scale all values between [0,1] and toggle solutions on/off above/below a certain threshold. (These functions are included in /util/).

Image

Gridded 2D data

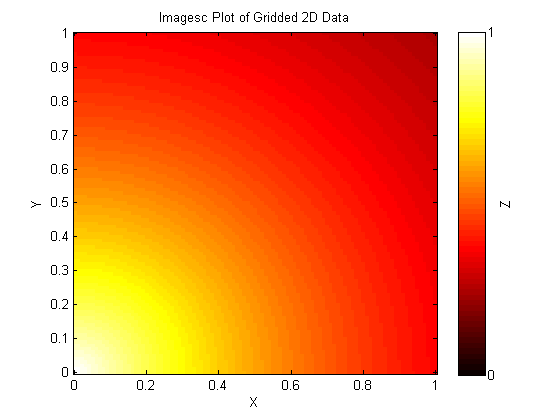
From example_data/gridded_2D.txt. Used with:

Image

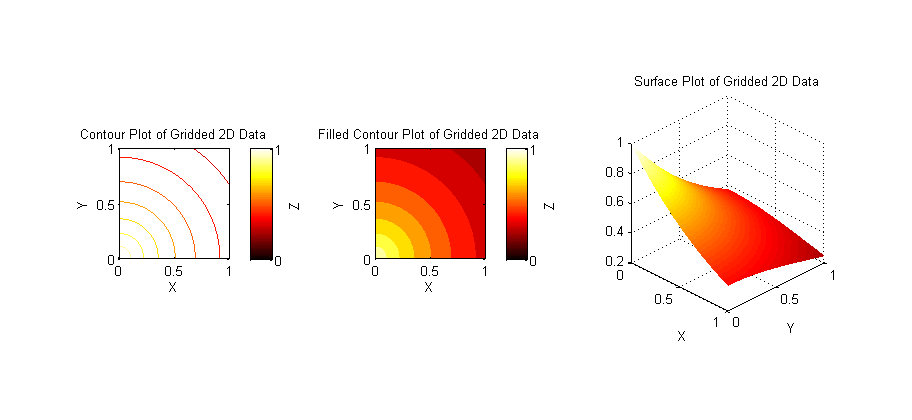
  • contour_surf: Contour, filled contour, and surface plots of meshgrid data

Image

Non-Gridded 2D data (e.g. experimental data)

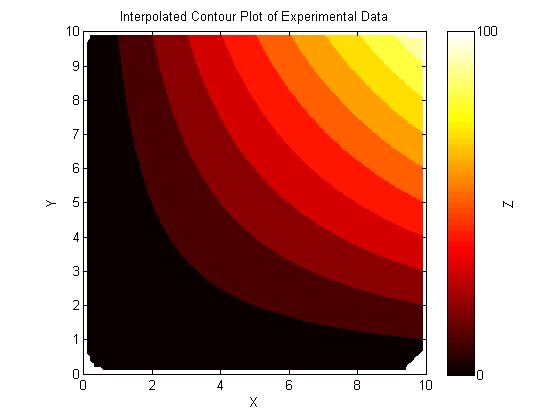
From example_data/non_gridded_2D.txt. The data file contains rows of (x,y,z) points that are not on a regular grid. Used with:

  • scatter_plot: Plot the irregularly spaced points as dots, with Z values as the color

Image

  • contourf_non_gridded: Use Matlab's built-in griddata function to interpolate the data onto a standard meshgrid, which can then be used for standard contour/mesh/surf plots, etc.

Image

3D Scatter Plot

From example_data/five_obj_data.txt. Used with:

  • 3D-scatter: Plot data in 5 dimensions using R and Python.

Image

plotting-examples's People

Contributors

matthewjwoodruff avatar jdherman avatar victorialynn avatar

Watchers

James Cloos avatar

Recommend Projects

  • React photo React

    A declarative, efficient, and flexible JavaScript library for building user interfaces.

  • Vue.js photo Vue.js

    ๐Ÿ–– Vue.js is a progressive, incrementally-adoptable JavaScript framework for building UI on the web.

  • Typescript photo Typescript

    TypeScript is a superset of JavaScript that compiles to clean JavaScript output.

  • TensorFlow photo TensorFlow

    An Open Source Machine Learning Framework for Everyone

  • Django photo Django

    The Web framework for perfectionists with deadlines.

  • D3 photo D3

    Bring data to life with SVG, Canvas and HTML. ๐Ÿ“Š๐Ÿ“ˆ๐ŸŽ‰

Recommend Topics

  • javascript

    JavaScript (JS) is a lightweight interpreted programming language with first-class functions.

  • web

    Some thing interesting about web. New door for the world.

  • server

    A server is a program made to process requests and deliver data to clients.

  • Machine learning

    Machine learning is a way of modeling and interpreting data that allows a piece of software to respond intelligently.

  • Game

    Some thing interesting about game, make everyone happy.

Recommend Org

  • Facebook photo Facebook

    We are working to build community through open source technology. NB: members must have two-factor auth.

  • Microsoft photo Microsoft

    Open source projects and samples from Microsoft.

  • Google photo Google

    Google โค๏ธ Open Source for everyone.

  • D3 photo D3

    Data-Driven Documents codes.