Git Product home page Git Product logo

plotting-examples's Introduction

Plotting Examples

Some examples for plotting different types of data in Matlab, Python, and R

Contributors: VictoriaLynn, matthewjwoodruff, and jdherman

See example_images for the outputs from these files (PNG). Note that publication-quality figures will usually require a vector graphics format (SVG/EPS/PDF) along with some manual editing to improve font clarity, etc. The examples shown here are in unedited raster format and are only meant to be illustrative.

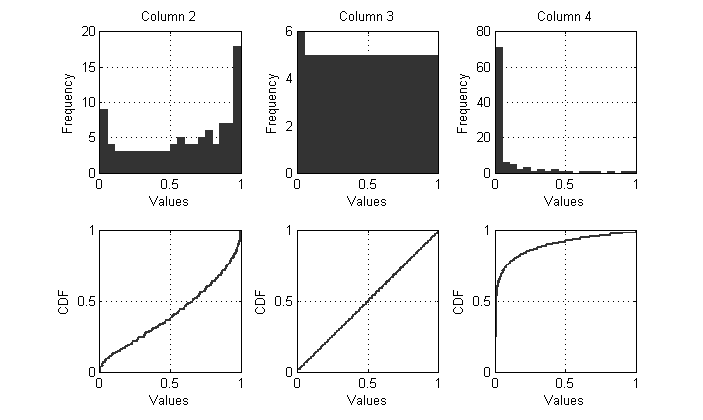
Column data

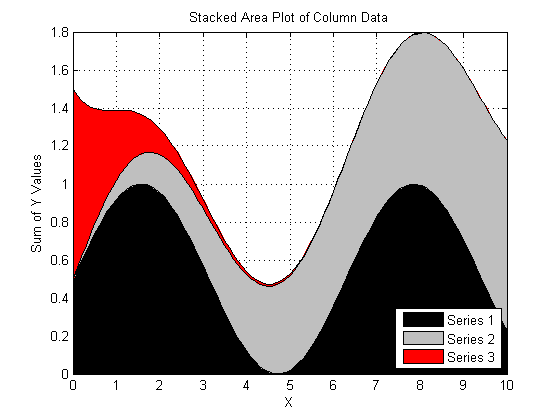
From example_data/column_data.txt. Used with:

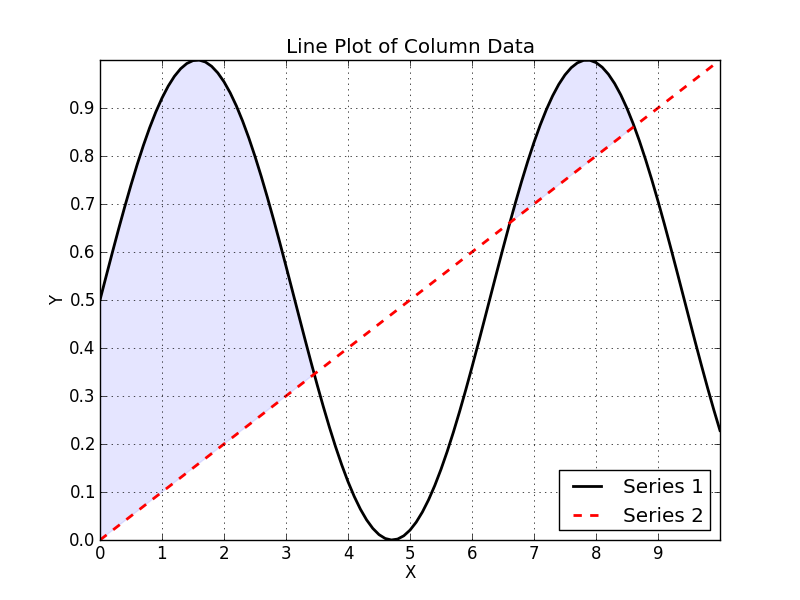
  • line_plot: Standard line plot with different formatting options

Image

  • fill_between: Same data as line_plot, with shaded fill between Series 1 and Series 2

Image

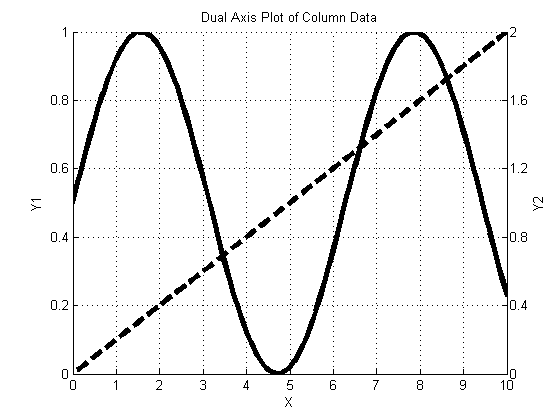
  • dual_axis: Plot column data using two different Y-axes

Image

Image

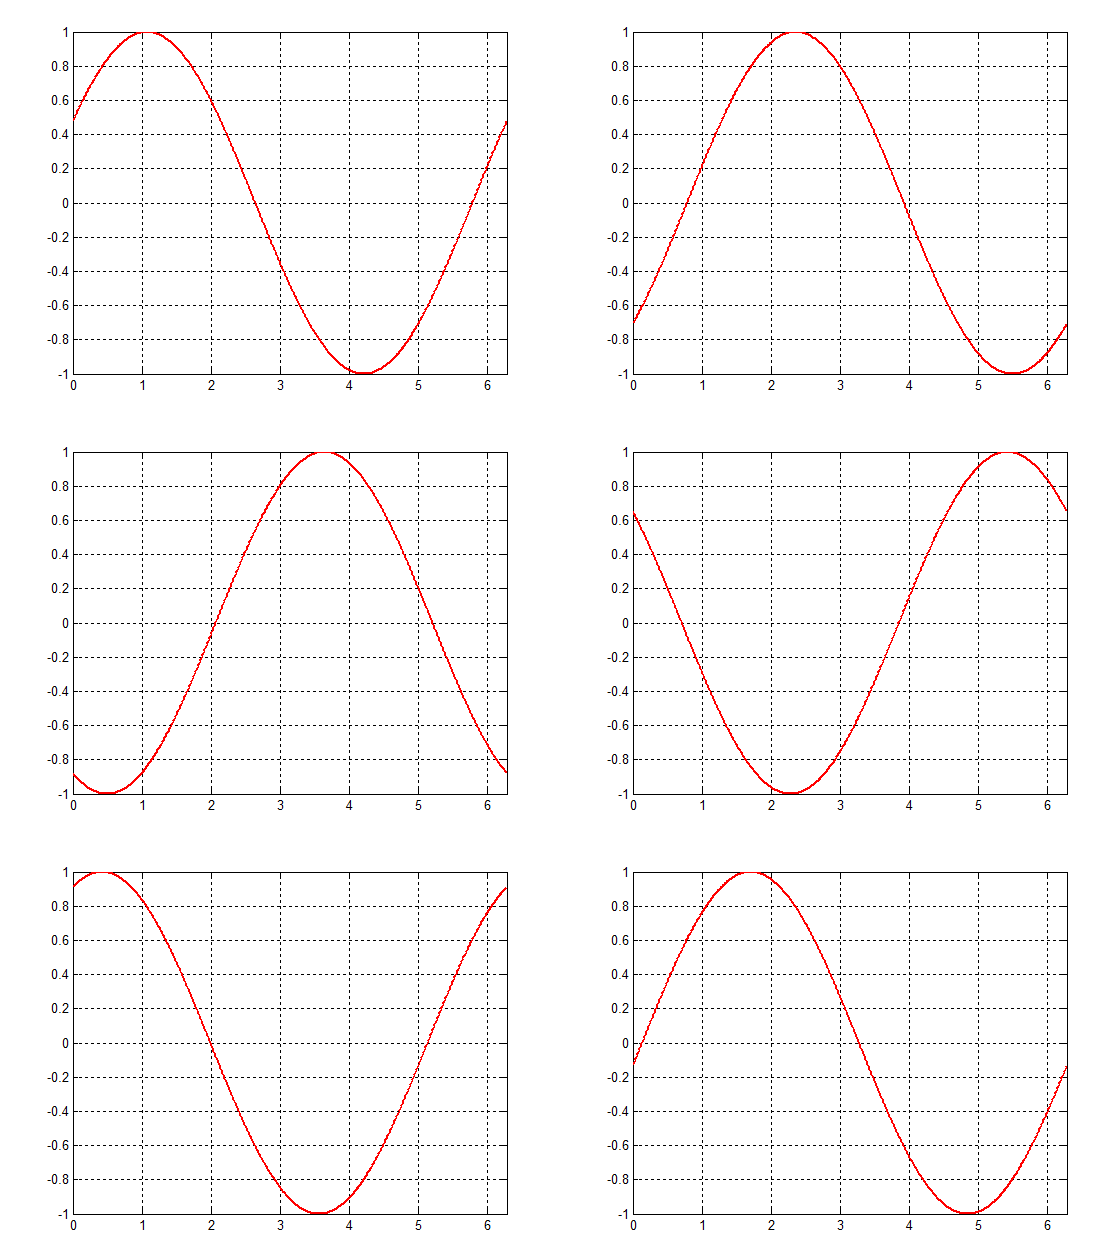
  • animated_gif: Save loop of images as a .gif animation. The Python version requires you to use imagemagick after the fact to stick the frames together: convert -delay 15 -loop 0 frame*png animation.gif.

Image

Image

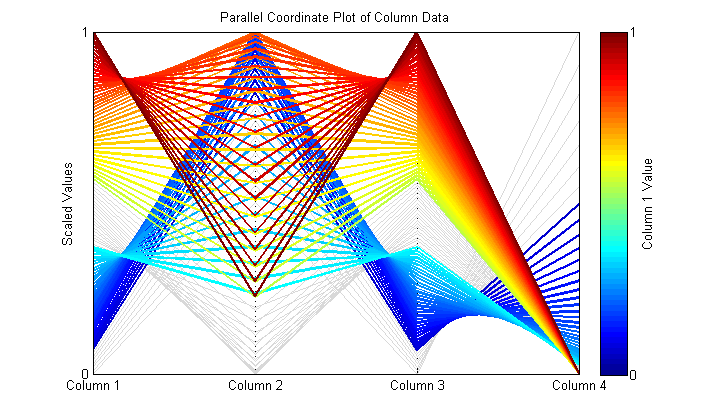
  • parallel_coordinate: Plots row entries as lines instead of columns. Options to scale all values between [0,1] and toggle solutions on/off above/below a certain threshold. (These functions are included in /util/).

Image

Gridded 2D data

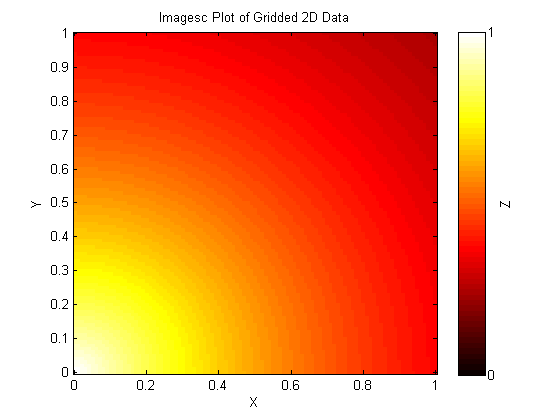
From example_data/gridded_2D.txt. Used with:

Image

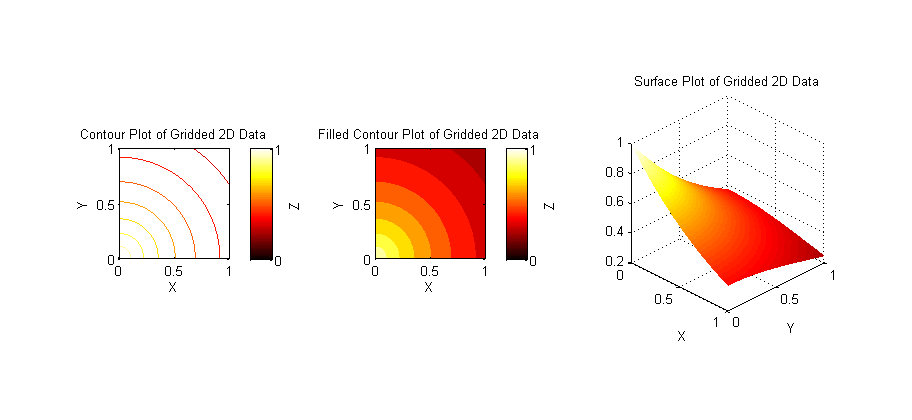
  • contour_surf: Contour, filled contour, and surface plots of meshgrid data

Image

Non-Gridded 2D data (e.g. experimental data)

From example_data/non_gridded_2D.txt. The data file contains rows of (x,y,z) points that are not on a regular grid. Used with:

  • scatter_plot: Plot the irregularly spaced points as dots, with Z values as the color

Image

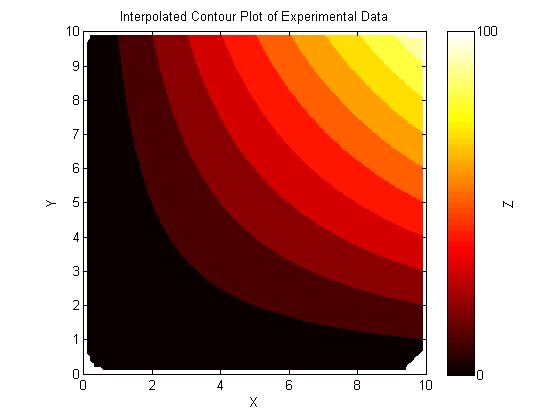
  • contourf_non_gridded: Use Matlab's built-in griddata function to interpolate the data onto a standard meshgrid, which can then be used for standard contour/mesh/surf plots, etc.

Image

3D Scatter Plot

From example_data/five_obj_data.txt. Used with:

  • 3D-scatter: Plot data in 5 dimensions using R and Python.

Image

plotting-examples's People

Contributors

jdherman avatar matthewjwoodruff avatar victorialynn avatar

Stargazers

 avatar  avatar  avatar  avatar  avatar  avatar  avatar  avatar  avatar  avatar  avatar  avatar  avatar  avatar  avatar  avatar  avatar  avatar  avatar  avatar  avatar  avatar  avatar  avatar  avatar  avatar  avatar  avatar  avatar  avatar

Watchers

 avatar  avatar  avatar  avatar  avatar  avatar  avatar  avatar

Recommend Projects

  • React photo React

    A declarative, efficient, and flexible JavaScript library for building user interfaces.

  • Vue.js photo Vue.js

    ๐Ÿ–– Vue.js is a progressive, incrementally-adoptable JavaScript framework for building UI on the web.

  • Typescript photo Typescript

    TypeScript is a superset of JavaScript that compiles to clean JavaScript output.

  • TensorFlow photo TensorFlow

    An Open Source Machine Learning Framework for Everyone

  • Django photo Django

    The Web framework for perfectionists with deadlines.

  • D3 photo D3

    Bring data to life with SVG, Canvas and HTML. ๐Ÿ“Š๐Ÿ“ˆ๐ŸŽ‰

Recommend Topics

  • javascript

    JavaScript (JS) is a lightweight interpreted programming language with first-class functions.

  • web

    Some thing interesting about web. New door for the world.

  • server

    A server is a program made to process requests and deliver data to clients.

  • Machine learning

    Machine learning is a way of modeling and interpreting data that allows a piece of software to respond intelligently.

  • Game

    Some thing interesting about game, make everyone happy.

Recommend Org

  • Facebook photo Facebook

    We are working to build community through open source technology. NB: members must have two-factor auth.

  • Microsoft photo Microsoft

    Open source projects and samples from Microsoft.

  • Google photo Google

    Google โค๏ธ Open Source for everyone.

  • D3 photo D3

    Data-Driven Documents codes.