Git Product home page Git Product logo

docker-grafana-graphite's Introduction

StatsD + Graphite + Grafana 4 + Kamon Dashboards

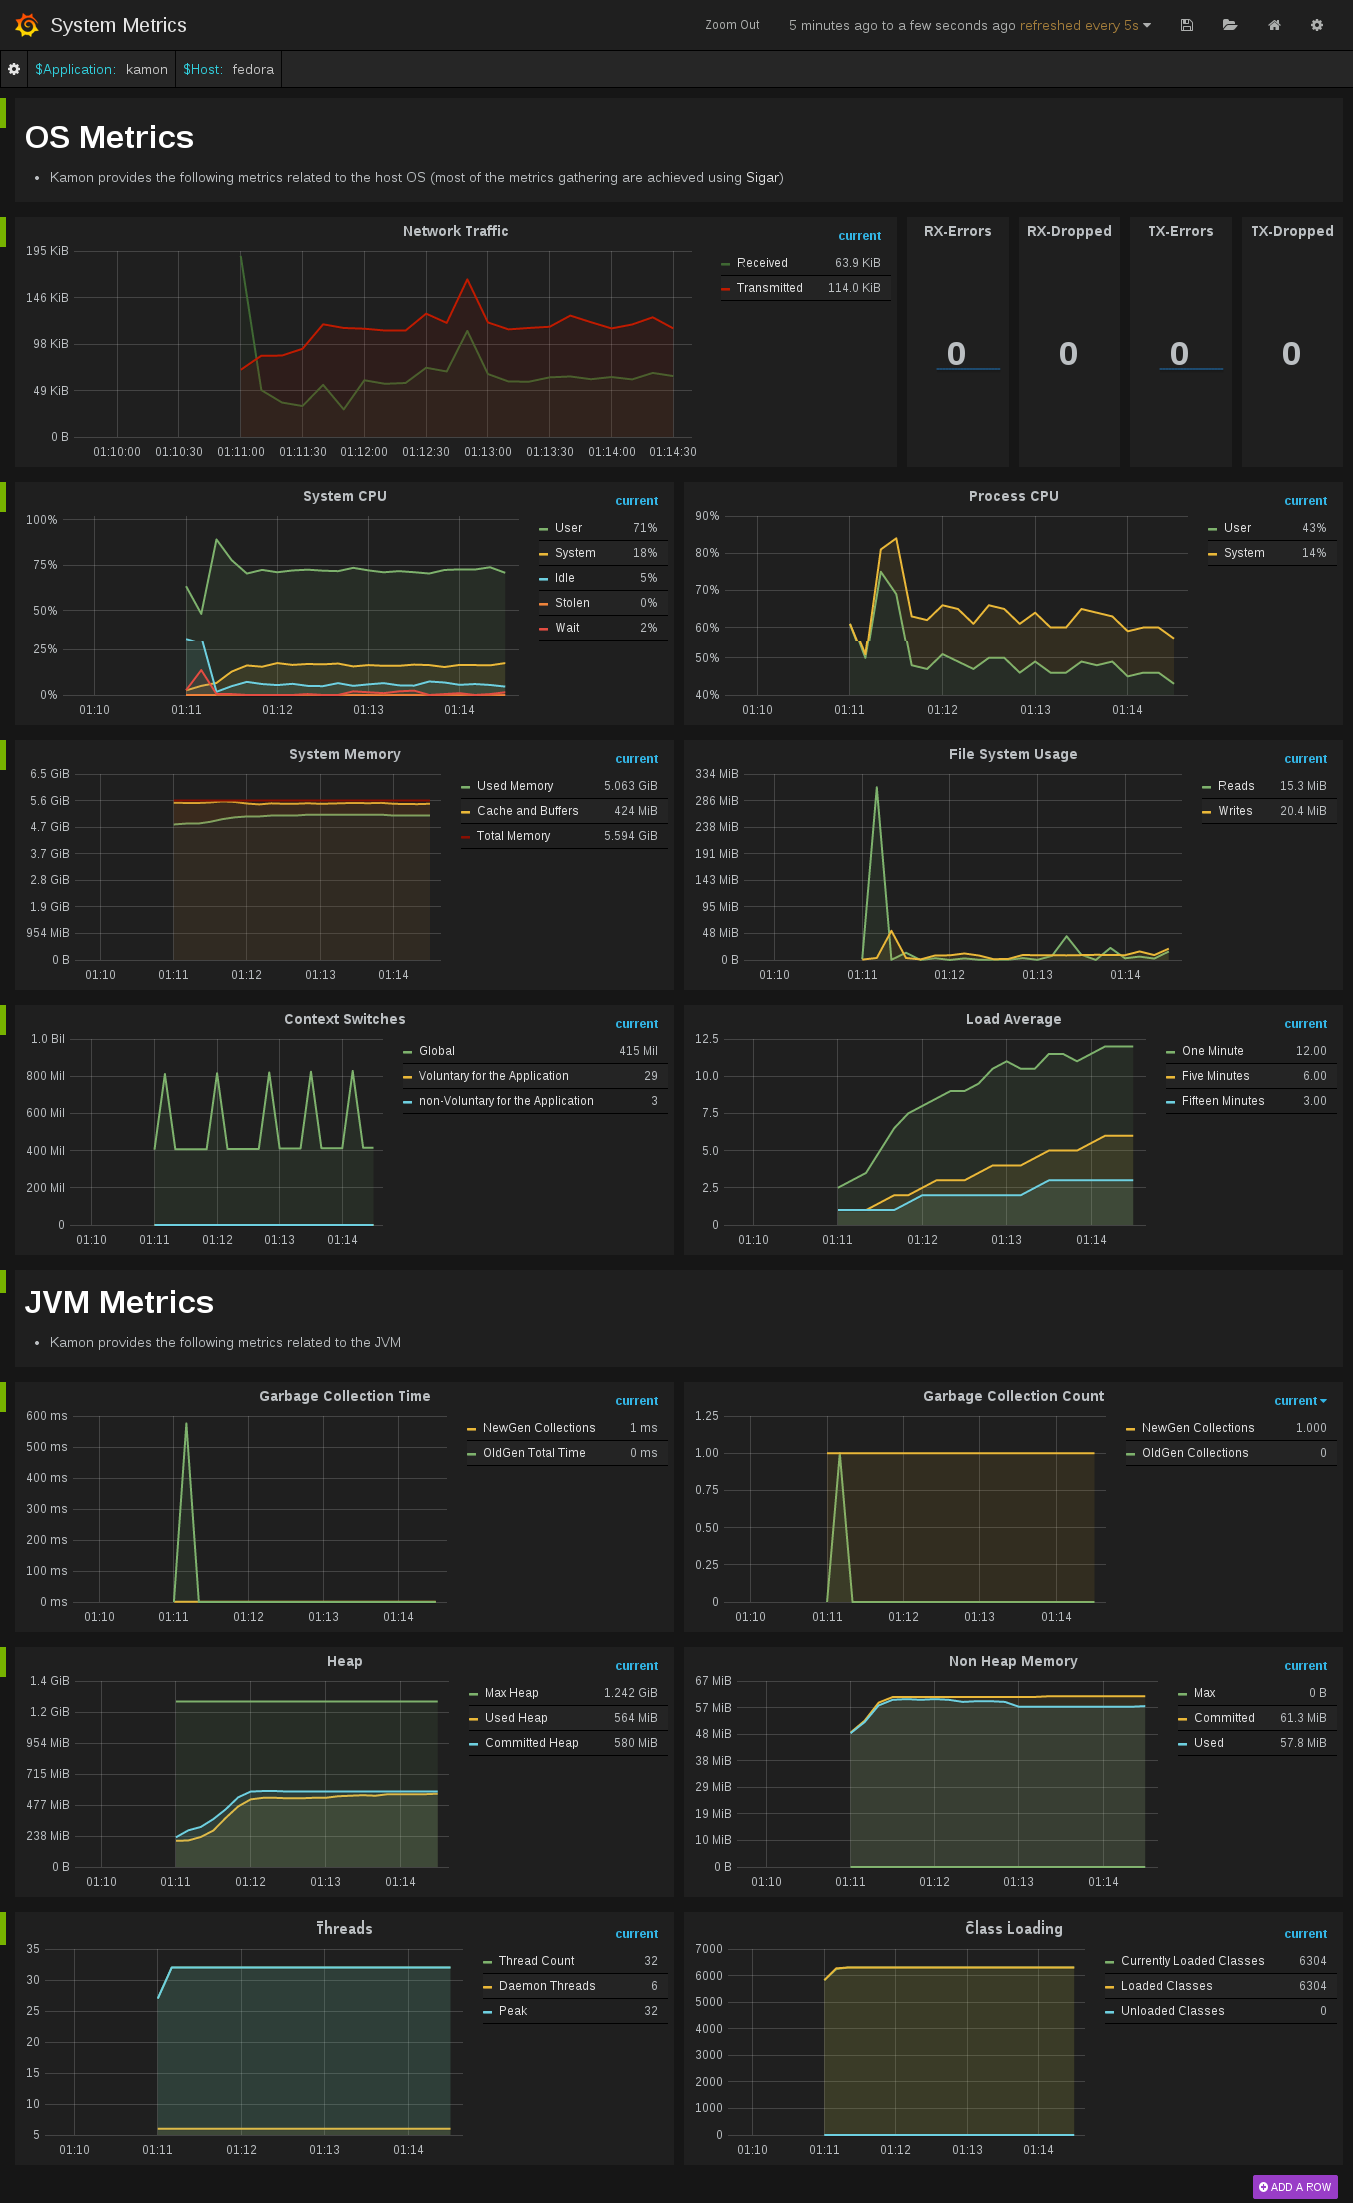
This image contains a sensible default configuration of StatsD, Graphite and Grafana, and comes bundled with a example dashboard that gives you the basic metrics currently collected by Kamon for both Actors and Traces. There are two ways for using this image:

Using the Docker Index

This image is published under Kamon's repository on the Docker Hub and all you need as a prerequisite is having docker, docker-compose, and make installed on your machine. The container exposes the following ports:

  • 80: the Grafana web interface.
  • 81: the Graphite web port
  • 2003: the Graphite data port
  • 8125: the StatsD port.
  • 8126: the StatsD administrative port.

To start a container with this image you just need to run the following command:

$ make up

To stop the container

$ make down

To run container's shell

$ make shell

To view the container log

$ make tail

If you already have services running on your host that are using any of these ports, you may wish to map the container ports to whatever you want by changing left side number in the --publish parameters, or the 'ports' parameters in 'docker-compose.yml'. You can omit ports you do not plan to use. Find more details about mapping ports in the Docker documentation on Binding container ports to the host and Legacy container links.

Building the image yourself

The Dockerfile and supporting configuration files are available in our Github repository. This comes specially handy if you want to change any of the StatsD, Graphite or Grafana settings, or simply if you want to know how the image was built.

Using the Dashboards

Once your container is running all you need to do is:

  • open your browser pointing to http://localhost:80 (or another port if you changed it)
    • Docker with VirtualBox on macOS: use docker-machine ip instead of localhost
  • login with the default username (admin) and password (admin)
  • open existing dashboard (or create a new one) and select 'Local Graphite' datasource
  • play with the dashboard at your wish...

Persisted Data

When running make up, directories are created on your host and mounted into the Docker container, allowing graphite and grafana to persist data and settings between runs of the container.

Now go explore!

We hope that you have a lot of fun with this image and that it serves it's purpose of making your life easier. This should give you an idea of how the dashboard looks like when receiving data from one of our toy applications:

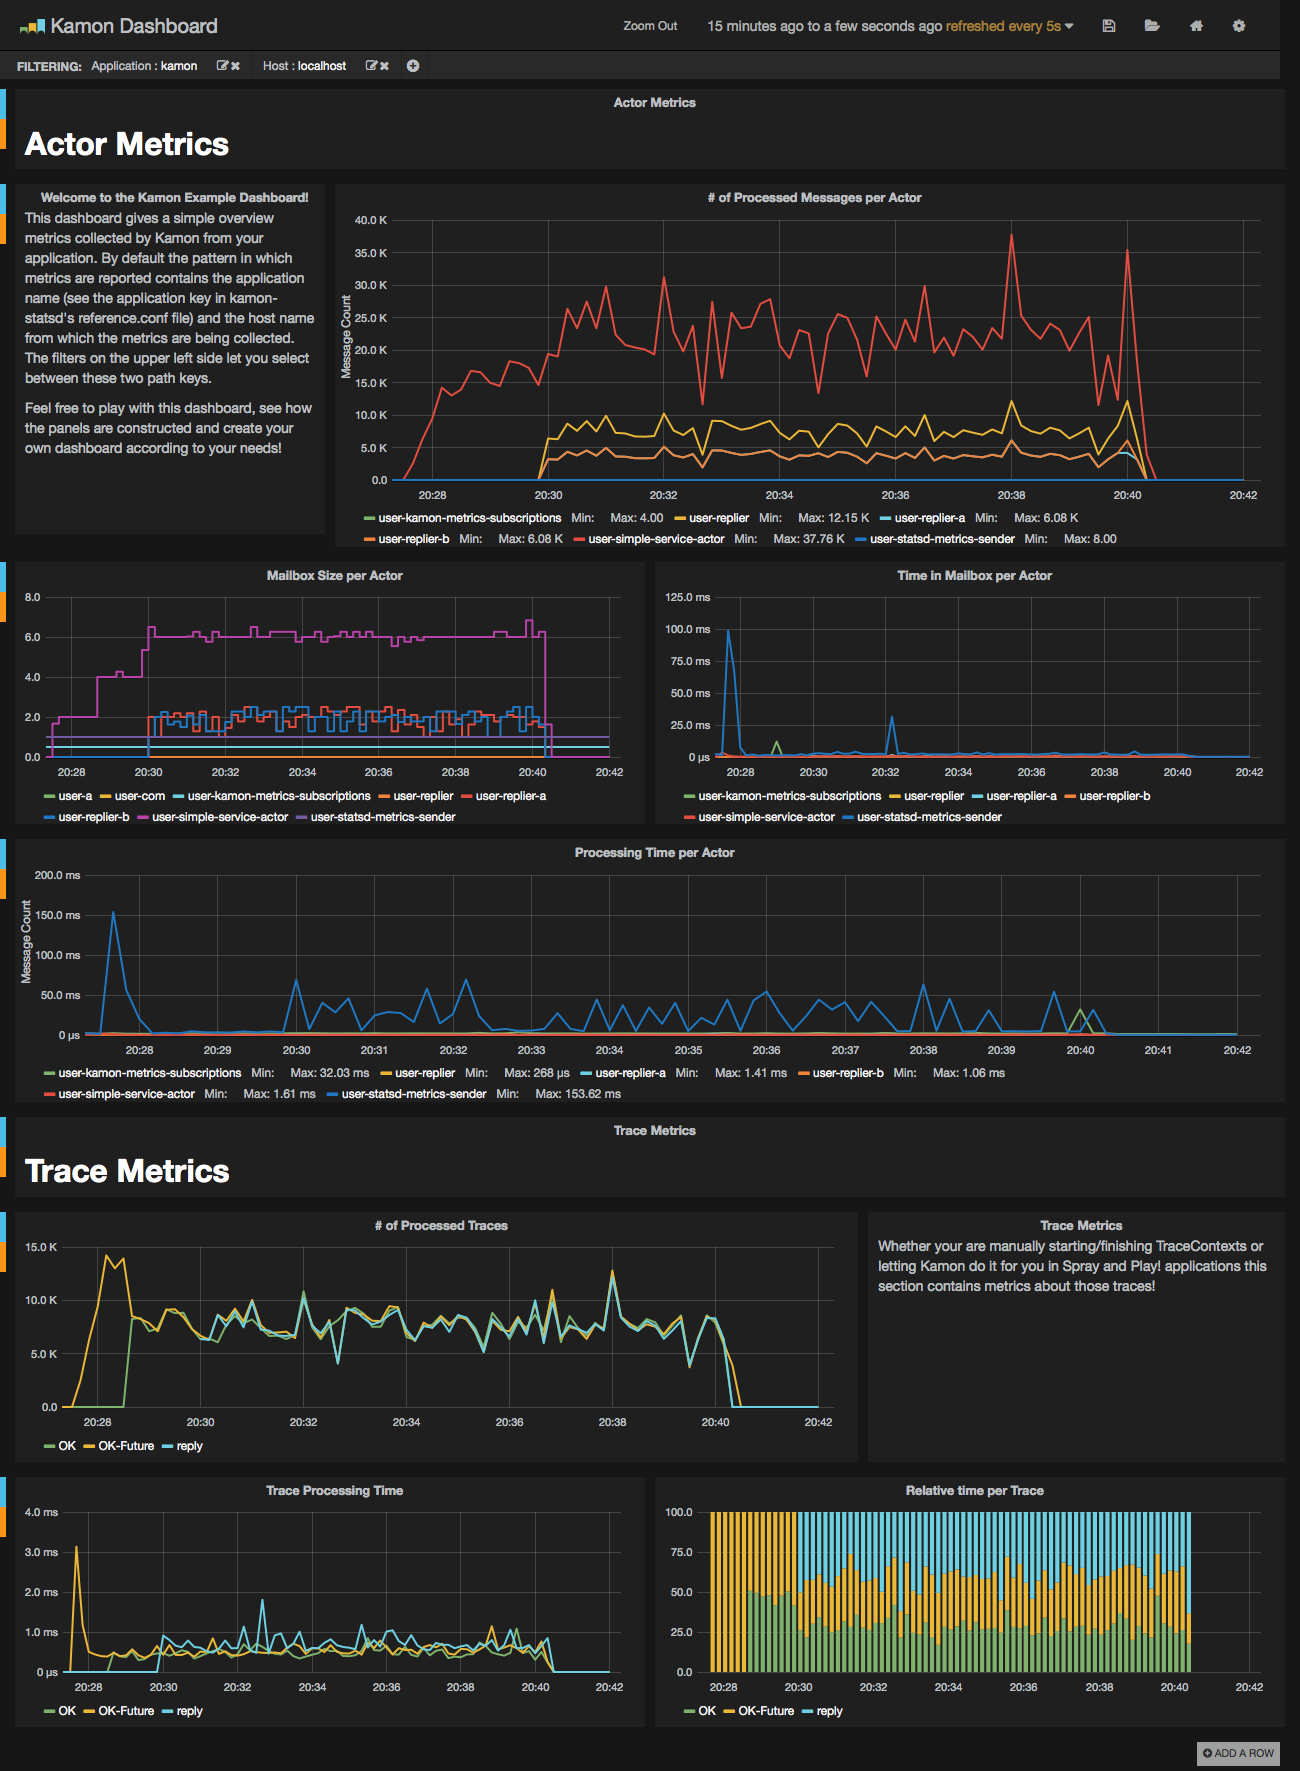
Kamon Dashboard System Metrics Dashboard

docker-grafana-graphite's People

Contributors

aguglie avatar akauppi avatar bainss avatar celliott avatar craigjbass avatar cript0nauta avatar dpsoft avatar elfolink avatar hos7ein avatar ivantopo avatar jarek-przygodzki avatar jozic avatar jsha avatar jtjeferreira avatar kakiezhang avatar mmojana avatar muuki88 avatar nickebbitt avatar sitin avatar theanti9 avatar wido avatar

Stargazers

 avatar  avatar  avatar  avatar  avatar  avatar  avatar  avatar  avatar  avatar  avatar  avatar  avatar  avatar  avatar  avatar  avatar  avatar  avatar  avatar  avatar  avatar  avatar  avatar  avatar  avatar  avatar  avatar  avatar  avatar  avatar  avatar  avatar  avatar  avatar  avatar  avatar  avatar  avatar  avatar  avatar  avatar  avatar  avatar  avatar  avatar  avatar  avatar  avatar  avatar  avatar  avatar  avatar  avatar  avatar  avatar  avatar  avatar  avatar  avatar  avatar  avatar  avatar  avatar  avatar  avatar  avatar  avatar  avatar  avatar  avatar  avatar  avatar  avatar  avatar  avatar  avatar  avatar  avatar  avatar  avatar  avatar  avatar  avatar  avatar  avatar  avatar  avatar  avatar  avatar  avatar  avatar  avatar  avatar  avatar  avatar  avatar  avatar  avatar  avatar

Watchers

 avatar  avatar  avatar  avatar  avatar  avatar  avatar  avatar  avatar  avatar  avatar  avatar  avatar  avatar  avatar  avatar  avatar  avatar  avatar  avatar  avatar  avatar  avatar  avatar  avatar  avatar  avatar  avatar  avatar  avatar  avatar  avatar  avatar  avatar  avatar  avatar  avatar  avatar  avatar  avatar  avatar  avatar  avatar  avatar  avatar  avatar  avatar  avatar  avatar  avatar  avatar  avatar  avatar  avatar  avatar  avatar  avatar  avatar  avatar

docker-grafana-graphite's Issues

logs not coming in kamon console runnin in docker when using Akka with Play 2.3.7

I have configured my play application with kamon docker monitoring tool to view actors i have used in my app. and this is a java application which uses akka aktors.
Is it possible to monitor my actors (since this is not a scala application)

** I have used exact configurations mentioned in kamon sbt project setup
http://mukis.de/pages/monitoring-akka-with-kamon/

can some one please help me to get this working
Thank you

From Cassandra: "Unable to report to Graphite" "Connection refused", UDP vs. TCP ?

Hi,

I'm able to send metrics from Kamon to Graphite with success, but not from Cassandra
(cassandra -f -Dcassandra.metricsReporterConfigFile=metrics-reporter-config-graphite.yaml):

WARN  14:15:05 Unable to report to Graphite
java.net.ConnectException: Connection refused
    at java.net.PlainSocketImpl.socketConnect(Native Method) ~[na:1.8.0_60]
    at java.net.AbstractPlainSocketImpl.doConnect(AbstractPlainSocketImpl.java:350) ~[na:1.8.0_60]
    at java.net.AbstractPlainSocketImpl.connectToAddress(AbstractPlainSocketImpl.java:206) ~[na:1.8.0_60]
    at java.net.AbstractPlainSocketImpl.connect(AbstractPlainSocketImpl.java:188) ~[na:1.8.0_60]
    at java.net.SocksSocketImpl.connect(SocksSocketImpl.java:392) ~[na:1.8.0_60]
    at java.net.Socket.connect(Socket.java:589) ~[na:1.8.0_60]
    at java.net.Socket.connect(Socket.java:538) ~[na:1.8.0_60]
    at java.net.Socket.<init>(Socket.java:434) ~[na:1.8.0_60]
    at java.net.Socket.<init>(Socket.java:244) ~[na:1.8.0_60]

I'm following those instructions: Pluggable metrics reporting in Cassandra

Versions used:

  • Cassandra: 2.2.5
  • metrics-graphite (deployed in cassandra/lib): metrics-graphite-3.1.2.jar
  • docker-grafana-graphite: master branch, at date March 17, 2016

Configuration of the metrics-reporter-config-graphite.yaml file:

graphite:
  -
    period: 60
    timeunit: 'SECONDS'
    hosts:
     - host: '192.168.99.100'
       port: 8125

What I did notice (using Wireshark) is that the protocol used by Kamon is UDP, the configuration of the 8125 port opened by Docker is also UDP while Cassandra is sending TCP packets...

Any help?
Thanks in advance.

Cannot see Docker dashboard after installing docker-grafana-graphite

Can't see Docker dashboard. In the list I see only System-Metrics and Welcome dashboards =/

dashboard-loader.log:

Pinging grafana login page...
Got status code 502 from login page
Pinging grafana login page...
Got status code 502 from login page
Pinging grafana login page...
Got status code 200 from login page
Logged in
Adding/updating the [Docker] dashboard.
Adding/updating the [Kamon Dashboard] dashboard.
When adding/updating the [Docker] dashboard, I got a 404: {"message":"Dashboard not found","status":"not-found"}`
Added the [Kamon Dashboard] dashboard.
Checking existence of dashboard with slug kamon-dashboard
The dashboard with slug kamon-dashboard exists
Dashboard file welcome.json has been loaded with slug kamon-dashboard

Can't get stats from outside of the EC2

The image runs just great and the deployment is very easy.
But I couldn't succeed to get stats from outside of the EC2 I'm running the docker's on.
I tried to reconfigure statsd graphiteHost to 0.0.0.0 but it didn't help.
All the ports are open as they should, and the stats are working just fine when they arrive from the same EC2.
Any idea what could be wrong?
Thanks.

Nginx conf override

Think I can override the nginx config by mounting a local one to the correct path? I've tried but it hasn't quite worked.

I only ask because i'd like to basic auth the dashboard.

Document how to store data outside of container

Thanks for putting together this image. I may have missed it, but I didn't see any discussion of how to ensure that your data can survive container restarts. This appears to work for me, but I may be missing some paths where data is stored:

docker run -v /data/graphite/whisper:/opt/graphite/storage/whisper -v /data/graphite/elasticsearch:/var/lib/elasticsearch -p 8000:80 -p 2003:2003 kamon/grafana_graphite

If you'd like I could fork and update the README, but I wanted to check to see if I'm doing this incorrectly first.

Unable to build container

Hi, I get this error when trying to build a docker container from source.

Creating fuse device...
mknod: 'fuse-': Operation not permitted
makedev fuse c 10 229 root root 0660: failed
chown: cannot access '/dev/fuse': No such file or directory
dpkg: error processing package fuse (--configure):
subprocess installed post-installation script returned error exit status 1
Processing triggers for libc-bin (2.19-0ubuntu6.5) ...
Errors were encountered while processing:
fuse
E: Sub-process /usr/bin/dpkg returned an error code (1)

Issue on AWS

works great locally but on AWS seems to have path issues. anyone knows how to fix this? my port 80 is taken but even port 81 isn't loading up.

Cannot access web UI

Hello, guys,

I run docker on Windows (boot2docker) and image seems to be started fine:

docker@boot2docker:~$ docker run -p 80:80 -p 8125:8125/udp -p 8126:8126 -p 81:81
 --name kamon-grafana-dashboard kamon/grafana_graphite
/usr/lib/python2.7/dist-packages/supervisor/options.py:295: UserWarning: Supervi
sord is running as root and it is searching for its configuration file in defaul
t locations (including its current working directory); you probably want to spec
ify a "-c" argument specifying an absolute path to a configuration file for impr
oved security.
  'Supervisord is running as root and it is searching '
2015-01-25 20:48:12,826 CRIT Supervisor running as root (no user in config file)

2015-01-25 20:48:12,826 WARN Included extra file "/etc/supervisor/conf.d/supervi
sord.conf" during parsing
2015-01-25 20:48:12,849 INFO RPC interface 'supervisor' initialized
2015-01-25 20:48:12,849 CRIT Server 'unix_http_server' running without any HTTP
authentication checking
2015-01-25 20:48:12,849 INFO supervisord started with pid 1
2015-01-25 20:48:13,853 INFO spawned: 'nginx' with pid 9
2015-01-25 20:48:13,855 INFO spawned: 'carbon-cache' with pid 10
2015-01-25 20:48:13,857 INFO spawned: 'elasticsearch' with pid 11
2015-01-25 20:48:13,860 INFO spawned: 'graphite-webapp' with pid 12
2015-01-25 20:48:13,862 INFO spawned: 'statsd' with pid 13
2015-01-25 20:48:15,754 INFO success: nginx entered RUNNING state, process has s
tayed up for > than 1 seconds (startsecs)
2015-01-25 20:48:15,754 INFO success: carbon-cache entered RUNNING state, proces
s has stayed up for > than 1 seconds (startsecs)
2015-01-25 20:48:15,754 INFO success: elasticsearch entered RUNNING state, proce
ss has stayed up for > than 1 seconds (startsecs)
2015-01-25 20:48:15,755 INFO success: graphite-webapp entered RUNNING state, pro
cess has stayed up for > than 1 seconds (startsecs)
2015-01-25 20:48:15,755 INFO success: statsd entered RUNNING state, process has
stayed up for > than 1 seconds (startsecs)

But when I go to 127.0.0.1 I see nothing (as it was claimed in README of this project). Can you please assist me in any way?

Thanks in advance and sorry in case of newbie question :)

Upgrade to Graphite 0.9.x

I would suggest using Graphite 0.9.x branch instead of 0.9.12 release. The 0.9.12 release and version tag of Graphite-web is missing the crucial maxDataPoints json api feature (graphite-project/graphite-web#170) This feature was implemented in March 2013 but not merged into 0.9.x branch until after the 0.9.12 version tag.

Without this feature Grafana is really slow when viewing graphs for long time ranges due to the fact that Graphite will return a humongous number of datapoints when viewing time ranges above a couple of days (depending on lowest metric resolution).

Fail to start: iptables: No chain/target/match by that name

root@apphost:~# docker run -d -p 80:80 -p 8125:8125/udp -p 8126:8126 --name kamon-grafana-dashboard kamon/grafana_graphite
Unable to find image 'kamon/grafana_graphite:latest' locally
latest: Pulling from kamon/grafana_graphite
d634beec75db: Pull complete 
35eae5c246a3: Pull complete 
d9729904347f: Pull complete 
a8bcfcde57f4: Pull complete 
4dcf98753255: Pull complete 
24be64ab3f73: Pull complete 
e7a93de6e46a: Pull complete 
37e96c254b3d: Pull complete 
080de43ecad0: Pull complete 
a4c024f73855: Pull complete 
bcab9b3b983d: Pull complete 
7277a3521dc6: Pull complete 
d99f905573f1: Pull complete 
f12dd4c2be75: Pull complete 
99cb0a86f78c: Pull complete 
c4ac53869fd7: Pull complete 
70b50dae2ff1: Pull complete 
33a5062826da: Pull complete 
55cad7e12fd1: Pull complete 
279b008ffe29: Pull complete 
95bf7fcf7b34: Pull complete 
6fe3c79de97b: Pull complete 
d660cac23e35: Pull complete 
d7167f8670b2: Pull complete 
20f6c5154b17: Pull complete 
494ca031bd6b: Pull complete 
7055b77947fc: Pull complete 
5cca6766e489: Pull complete 
86e9018efc40: Pull complete 
8bd653f830cc: Pull complete 
6b668957b7af: Pull complete 
398b0e6934e5: Pull complete 
32b98046278e: Pull complete 
245bd0b01948: Pull complete 
c0fda9611690: Pull complete 
837c0eff52b8: Pull complete 
de624ff20367: Pull complete 
4f0a88a41b5f: Pull complete 
57152bb37784: Pull complete 
bc4722280e7b: Pull complete 
1827211736eb: Pull complete 
561bd1e60c06: Pull complete 
Digest: sha256:86395d16a34ebcecb98f24446f95c7eeb28386ad1587c200ca91202d981717ef
Status: Downloaded newer image for kamon/grafana_graphite:latest
be924fd02ca8102b31d4a0d0973e461ee35eeec93b38ca252508f300198c7935
Error response from daemon: Cannot start container be924fd02ca8102b31d4a0d0973e461ee35eeec93b38ca252508f300198c7935: failed to create endpoint kamon-grafana-dashboard on network bridge: iptables failed: iptables --wait -t nat -A DOCKER -p tcp -d 0/0 --dport 8126 -j DNAT --to-destination 172.17.0.3:8126 ! -i docker0: iptables: No chain/target/match by that name.
 (exit status 1)
root@apphost:~# 

problem building container

When I try and build the container, it hangs during the initial installation of the packages. I have been able to replicate this by running the commands manually in a container. I'm using boot2docker on a Mac with VirtualBox.

Here is where it hangs...

Setting up libgnome2-common (2.32.1-4ubuntu1) ...
Setting up libgnome2-0:amd64 (2.32.1-4ubuntu1) ...
Setting up ca-certificates-java (20130815ubuntu1) ...

Before that I also get a number of errors including

Setting up openjdk-7-jre:amd64 (7u91-2.6.3-0ubuntu0.14.04.1) ...
update-alternatives: using /usr/lib/jvm/java-7-openjdk-amd64/jre/bin/policytool to provide /usr/bin/policytool (policytool) in auto mode
Setting up libatk-wrapper-java (0.30.4-4) ...
Setting up gconf-service-backend (3.2.6-0ubuntu2) ...
Setting up gconf2 (3.2.6-0ubuntu2) ...
update-alternatives: using /usr/bin/gconftool-2 to provide /usr/bin/gconftool (gconftool) in auto mode

(gconftool-2:8906): GConf-WARNING **: Client failed to connect to the D-BUS daemon:
Unable to autolaunch a dbus-daemon without a $DISPLAY for X11

and

Setting up dbus (1.6.18-0ubuntu4.3) ...
invoke-rc.d: policy-rc.d denied execution of start.

thanks in advance

apt-get error running ./build

There is an error when attempting to build the master branch:

Sending build context to Docker daemon 285.7 kB Step 1 : FROM ubuntu:14.04 ---> 90d5884b1ee0 Step 2 : ENV DEBIAN_FRONTEND noninteractive ---> Using cache ---> ef4d39442d50 Step 3 : RUN apt-get -y install software-properties-common ---> Running in 39724b803a54 Reading package lists... Building dependency tree... Reading state information... E: Unable to locate package software-properties-common The command '/bin/sh -c apt-get -y install software-properties-common' returned a non-zero code: 100

It is caused by this line in the Dockerfile:
apt-get -y install software-properties-common
being called before:
apt-get -y update

I'd make a pull request but its such a trivial fix I imagine it would be easier for someone more involved in the project to edit it.

Cheers

Grafana Question: Graphing a trace does not seem to work

I've been experimenting with Kamon and this docker image - which I'm really enjoying - for the last week, but I can't seem to get my traces to graph "correctly."

I have a simple Akka application with two actors: A and B, where A sends a message to B, B responds after a random wait period, and then A finishes the TraceContext.

In Grafana I have a graph with the query stats | timers | kamon | my_machine | trace | ping-pong | elapsed-time | mean_50. I expect the graph to show the average time for a trace to complete - much like the graphs in your Readme - but I end up with an ever-increasing line which seems to show the total time the application has run for (e.g. the app has run for 10 minutes and so the trace time is 10 minutes)

Have I set-up my trace incorrectly? Is my query wrong? Is this a bug or are my expectations incorrect?

case object Ping
case object Pong

class Pinger(ponger: ActorRef) extends Actor {

  import context.system

  override def preStart(): Unit = {
    super.preStart()
    for (i <- 1 to 5000) {
      TraceRecorder.withNewTraceContext("ping-pong") {
        ponger ! Ping
      }
    }
  }

  def receive: Receive = {
    case Pong => TraceRecorder.finish()
  }
}

class Ponger extends Actor {
  def receive: Receive = {
    case Ping =>
      Thread.sleep((150 + (Math.random() * 200)).toLong)
      sender() ! Pong
  }
}

ping-pong-trace

I've been stuck on this for a couple days now. Any and all help is appreciated.

EDIT: As always, right after I ask a question a possible solution pops into my head. I added logging to see what the current context is when I receive a Ping and a Pong. It seems I always see the DefaultTraceContext.

case Pong =>
  log.info(s"Received Pong for context ${TraceRecorder.currentContext}")
case Ping =>
  log.info(s"Received Ping with ${TraceRecorder.currentContext}")
[info] [INFO] [02/13/2015 11:12:40.176] [kamon-test-akka.actor.default-dispatcher-10] [akka://kamon-test/user/ponger] Received Ping with kamon.trace.DefaultTraceContext@d781369
[info] [INFO] [02/13/2015 11:12:40.176] [kamon-test-akka.actor.default-dispatcher-6] [akka://kamon-test/user/pinger] Received Pong for context kamon.trace.DefaultTraceContext@d781369

It appears this problem is not related to grafana and instead is a problem with my tracing. I'm not sure what I have done that is different from Kamon's documentation but I'll dig a little deeper.

Unable to see the stats beyond 7 days

I have the latest docker installed and running for more than a month now but i am not able to see the graphs beyond 7 days. Is it normal or do i need to change something in config files to see graphs for more days?

Hostname auto-detection not implemented in Kamon Dashboard

Steps to reproduce:
Log into dashboard, by default see "hostname".
Switch to System Metrics, then see my computer name.

The workaround is to copy the computer name exactly as it is shown in the System Metrics dashboard and paste it in over "localhost" in the Kamon Dashboard.

Run is failing on Ubuntu 14.04

I tried the following:

sudo docker.io pull kamon/grafana_graphite
sudo docker.io run kamon/grafana_graphite

I got this output

2014-04-26 20:40:46,718 CRIT Supervisor running as root (no user in config file)
2014-04-26 20:40:46,718 WARN Included extra file "/etc/supervisor/conf.d/supervisord.conf" during parsing
2014-04-26 20:40:46,734 INFO RPC interface 'supervisor' initialized
2014-04-26 20:40:46,734 WARN cElementTree not installed, using slower XML parser for XML-RPC
2014-04-26 20:40:46,734 CRIT Server 'unix_http_server' running without any HTTP authentication checking
2014-04-26 20:40:46,735 INFO supervisord started with pid 1
2014-04-26 20:40:47,736 INFO spawned: 'nginx' with pid 7
2014-04-26 20:40:47,737 INFO spawned: 'carbon-cache' with pid 8 
2014-04-26 20:40:47,738 INFO spawned: 'elasticsearch' with pid 9
2014-04-26 20:40:47,740 INFO spawned: 'graphite-webapp' with pid 10
2014-04-26 20:40:47,741 INFO spawned: 'statsd' with pid 11
2014-04-26 20:40:47,751 INFO exited: elasticsearch (exit status 127; not expected)
2014-04-26 20:40:48,904 INFO success: nginx entered RUNNING state, process has stayed up for > than 1 seconds (startsecs)
2014-04-26 20:40:48,904 INFO success: carbon-cache entered RUNNING state, process has stayed up for > than 1 seconds (startsecs)
2014-04-26 20:40:48,905 INFO spawned: 'elasticsearch' with pid 25
2014-04-26 20:40:48,905 INFO success: graphite-webapp entered RUNNING state, process has stayed up for > than 1 seconds (startsecs)
2014-04-26 20:40:48,905 INFO success: statsd entered RUNNING state, process has stayed up for > than 1 seconds (startsecs)
2014-04-26 20:40:48,909 INFO exited: elasticsearch (exit status 127; not expected)
2014-04-26 20:40:50,913 INFO spawned: 'elasticsearch' with pid 26
2014-04-26 20:40:50,919 INFO exited: elasticsearch (exit status 127; not expected)
2014-04-26 20:40:53,924 INFO spawned: 'elasticsearch' with pid 27
2014-04-26 20:40:53,930 INFO exited: elasticsearch (exit status 127; not expected)
2014-04-26 20:40:54,932 INFO gave up: elasticsearch entered FATAL state, too many start retries too quickly

How can I fix this?

Proper way to send data to graphite

Hi, I started the container and the dashboard is running on http://192.168.99.100 (port 80).

I am trying to create a new dashboard and feed data to it but getting stuck as I am new to graphite and graphana. Can you please help.

This is what I did so far.

  1. Created a new datasource with URL http://localhost:8000 (Type grahite).
  2. Created a new dashboard with query metric carbon (is it the correct thing to do ?)
  3. Tried posting some data using the below commands but not seeing any data points on the dashboard.
    echo "test.bash.stats 42 date +%s" | nc 192.168.99.100 8000
    echo "test.bash.stats 42 date +%s" | nc 192.168.99.100 8125

Can you please help me with the proper way to setup dashboard and feed data to it.

Thanks in advance.

Unable to push stats

I installed statsd python wrapper from here: https://pypi.python.org/pypi/statsd/2.1.2 and tried the following:

>>> import statsd
>>> c = statsd.StatsClient('localhost', 8125)
>>> c.incr('prashanth.test', 100)

In Grafana dashboard I tried to look for the metric but it wasn't showing up. I asked Docker to dump logs from the container and see this:

2014-05-01 12:30:04,083 CRIT Supervisor running as root (no user in config file)
2014-05-01 12:30:04,083 WARN Included extra file "/etc/supervisor/conf.d/supervisord.conf" during parsing
2014-05-01 12:30:04,099 INFO RPC interface 'supervisor' initialized
2014-05-01 12:30:04,099 CRIT Server 'unix_http_server' running without any HTTP authentication checking
2014-05-01 12:30:04,099 INFO supervisord started with pid 1
2014-05-01 12:30:05,101 INFO spawned: 'nginx' with pid 8
2014-05-01 12:30:05,102 INFO spawned: 'carbon-cache' with pid 9
2014-05-01 12:30:05,103 INFO spawned: 'elasticsearch' with pid 10
2014-05-01 12:30:05,104 INFO spawned: 'graphite-webapp' with pid 11
2014-05-01 12:30:05,105 INFO spawned: 'statsd' with pid 12
2014-05-01 12:30:05,310 INFO exited: carbon-cache (exit status 1; not expected)
2014-05-01 12:30:06,541 INFO success: nginx entered RUNNING state, process has stayed up for > than 1 seconds (startsecs)
2014-05-01 12:30:06,542 INFO spawned: 'carbon-cache' with pid 58
2014-05-01 12:30:06,542 INFO success: elasticsearch entered RUNNING state, process has stayed up for > than 1 seconds (startsecs)
2014-05-01 12:30:06,542 INFO success: graphite-webapp entered RUNNING state, process has stayed up for > than 1 seconds (startsecs)
2014-05-01 12:30:06,542 INFO success: statsd entered RUNNING state, process has stayed up for > than 1 seconds (startsecs)
2014-05-01 12:30:06,664 INFO exited: carbon-cache (exit status 1; not expected)
2014-05-01 12:30:09,191 INFO spawned: 'carbon-cache' with pid 100
2014-05-01 12:30:09,302 INFO exited: carbon-cache (exit status 1; not expected)
2014-05-01 12:30:13,195 INFO spawned: 'carbon-cache' with pid 133
2014-05-01 12:30:13,307 INFO exited: carbon-cache (exit status 1; not expected)
2014-05-01 12:30:14,308 INFO gave up: carbon-cache entered FATAL state, too many start retries too quickly

Here is what Docker reports for the "top" command

CONTAINER ID        IMAGE                        COMMAND                CREATED             STATUS              PORTS                                                                NAMES
a6659900b509        kamon/grafana_graphite:1.0   /usr/bin/supervisord   2 days ago          Up 26 minutes       0.0.0.0:81->80/tcp, 0.0.0.0:8125->8125/udp, 0.0.0.0:8126->8126/tcp   kamon-grafana-dashboard   
prashanth@almatrix1:~$ sudo docker.io top a6659900b509
UID                 PID                 PPID                C                   STIME               TTY                 TIME                CMD
root                13726               2007                0                   12:30               ?                   00:00:00            /usr/bin/python /usr/bin/supervisord
root                13771               13726               0                   12:30               ?                   00:00:00            nginx: master process /usr/sbin/nginx
sshd                13773               13726               0                   12:30               ?                   00:00:09            /usr/lib/jvm/java-7-openjdk-amd64//bin/java -Xms256m -Xmx1g -Xss256k -Djava.awt.headless=true -XX:+UseParNewGC -XX:+UseConcMarkSweepGC -XX:CMSInitiatingOccupancyFraction=75 -XX:+UseCMSInitiatingOccupancyOnly -XX:+HeapDumpOnOutOfMemoryError -Delasticsearch -Des.foreground=yes -Des.path.home=/usr/share/elasticsearch -cp :/usr/share/elasticsearch/lib/elasticsearch-1.1.1.jar:/usr/share/elasticsearch/lib/*:/usr/share/elasticsearch/lib/sigar/* -Des.default.config=/etc/elasticsearch/elasticsearch.yml -Des.default.path.home=/usr/share/elasticsearch -Des.default.path.logs=/var/log/elasticsearch -Des.default.path.data=/var/lib/elasticsearch -Des.default.path.work=/tmp/elasticsearch -Des.default.path.conf=/etc/elasticsearch org.elasticsearch.bootstrap.Elasticsearch
root                13774               13726               0                   12:30               ?                   00:00:00            /usr/bin/python /usr/bin/gunicorn_django -b127.0.0.1:8000 -w2 graphite/settings.py
root                13775               13726               0                   12:30               ?                   00:00:00            statsd /src/statsd/config.js
www-data            13776               13771               0                   12:30               ?                   00:00:00            nginx: worker process
root                13816               13774               0                   12:30               ?                   00:00:00            /usr/bin/python /usr/bin/gunicorn_django -b127.0.0.1:8000 -w2 graphite/settings.py
root                13817               13774               0                   12:30               ?                   00:00:00            /usr/bin/python /usr/bin/gunicorn_django -b127.0.0.1:8000 -w2 graphite/settings.py

Does this mean that the Carbon process did indeed fail to start? How can I fix this?

Update to grafana 1.9.0

The image still contains v1.7.0 with some patches. I have some issues with the grafana web ui, so maybe you could update to v1.9.0?

Security: Processes are running as root

Right now processes are running as root on the root-system, see the following line for example:

root      2015  1920  0 09:21 ?        00:00:00 /opt/grafana/bin/grafana-server
root      2016  1920  0 09:21 ?        00:00:00 statsd                                                  
root      2017  1920  0 09:21 ?        00:00:00 /usr/bin/python /usr/bin/gunicorn_django -b127.0.0.1:8000 -w2 graphite/settings.py

As long as the user namespace is not available, it is insecure to run the processes as root. Is there a reason that they run as root?

What is the datasource url?

I am new to this.

I started the docker container following the tutorial, everything is good, I can see the testing data graphs.
But when I try to setup a new datasource, I am not sure what is the url, cannot find any document on it.
In the using-the-dashboards part, it uses http://localhost:8000, which does not work in my setup.

The system is on EC2 instance, the security group is only exposing port 80 to public, and 8125 to internal IP. Also I am not exposing the graphite ui port 81, since grafana ui on port 80 has the auth, but graphite ui does not have any auth.

Also if I want to expose the graphite ui port, how do I setup the basic auth?

High disk usage

Hello,

I am running the docker image on a digitalocean droplet. However after some time(5-10 minutes) disk usage becomes this: /dev/vda1 30G 30G 0 100% /

I had the same issue on my laptop with the docker version 1.4.1 which makes me think there's a problem with the image.

Docker version is Docker version 1.0.1, build 990021a

These two directory shares most of the disk by the way: /var/lib/docker/aufs/diff and /var/lib/docker/aufs/mnt

Any thoughts on what might be the problem?

installing grafana-upgrade-1.9 branch

I did upgrade my docker to 1.5 on ubuntu 14.04.1 then

git clone -b grafana-upgrade-1.9.1 --single-branch https://github.com/kamon-io/docker-grafana-graphite.git
cd docker-grafana-graphite
sudo ./build
sudo ./start

however I see only a system-metrics appearing... no kamon dashboard...
when I tried http://localhost/#/dashboard/db/welcome it says Dashboard Not Found!

http://localhost/elasticsearch/grafana-dash/dashboard/welcome

{
  "_index": "grafana-dash",
  "_type": "dashboard",
  "_id": "welcome",
  "found": false
}

Production usage: memory usage under load

In a simple load test, I saw graphite (carbon_cache) python process memory usage is rapidly eating memory (a few GBs in 5 minutes) and system went to heavy swapping until it was totally thumb

  1. I've submitted this to graphite issue list, however can it be related to the docker image settings?
  2. Any real experiences of this under heavy load?
  3. Could influxDB image act better in production?

and thank you for your really nice work ๐Ÿ‘

Possible start up problem

I've been seeing a problem with the carbon cache when I launch this container. The logs (below) show that it has tried to start a few times then given up. But looking at the running processes I see that it is up.

I can get things working again by stopping then starting the cache using

/opt/graphite/bin/carbon-cache.py stop
/opt/graphite/bin/carbon-cache.py start

Perhaps the problem could be fixed by having the process wait a little longer between each retry?

Due to the fact that the carbon-cache is running but not functioning this leaves the dashboard looking like everything is fine but in fact receives no data.

LOGS

2015-10-14 18:24:03,817 INFO spawned: 'carbon-cache' with pid 40
2015-10-14 18:24:03,820 INFO success: dashboard-loader entered RUNNING state, process has stayed up for > than 1 seconds (startsecs)
2015-10-14 18:24:03,943 INFO exited: carbon-cache (exit status 1; not expected)
2015-10-14 18:24:05,948 INFO spawned: 'carbon-cache' with pid 43
2015-10-14 18:24:06,085 INFO exited: carbon-cache (exit status 1; not expected)
2015-10-14 18:24:09,091 INFO spawned: 'carbon-cache' with pid 51
2015-10-14 18:24:09,212 INFO exited: carbon-cache (exit status 1; not expected)
2015-10-14 18:24:10,213 INFO gave up: carbon-cache entered FATAL state, too many start retries too quickly
2015-10-15 18:41:12,571 INFO exited: statsd (exit status 0; expected)

graphite error

hi
after build image and run by this way :

`mkdir kamon-grafana-service
cd kamon-grafana-service
mkdir -p data/whisper
mkdir -p data/elasticsearch
mkdir -p data/grafana
mkdir -p log/graphite
mkdir -p log/elasticsearch
chmod -R 777 *

docker run
--detach
--publish=80:80
--publish=81:81
--publish=8125:8125/udp
--publish=8126:8126
--name kamon-grafana-dashboard
--volume=$(pwd)/data/whisper:/opt/graphite/storage/whisper
--volume=$(pwd)/data/elasticsearch:/var/lib/elasticsearch
--volume=$(pwd)/data/grafana:/opt/grafana/data
--volume=$(pwd)/log/graphite:/opt/graphite/storage/log
--volume=$(pwd)/log/elasticsearch:/var/log/elasticsearch
kamon/grafana_graphite`

This message is displayed by graphite :

Traceback (most recent call last):
File "/usr/local/lib/python2.7/dist-packages/django/core/handlers/base.py", line 103, in get_response
resolver_match = resolver.resolve(request.path_info)
File "/usr/local/lib/python2.7/dist-packages/django/core/urlresolvers.py", line 321, in resolve
sub_match = pattern.resolve(new_path)
File "/usr/local/lib/python2.7/dist-packages/django/core/urlresolvers.py", line 223, in resolve
return ResolverMatch(self.callback, args, kwargs, self.name)
File "/usr/local/lib/python2.7/dist-packages/django/core/urlresolvers.py", line 230, in callback
self._callback = get_callable(self._callback_str)
File "/usr/local/lib/python2.7/dist-packages/django/utils/functional.py", line 29, in wrapper
result = func(*args)
File "/usr/local/lib/python2.7/dist-packages/django/core/urlresolvers.py", line 97, in get_callable
mod = import_module(mod_name)
File "/usr/local/lib/python2.7/dist-packages/django/utils/importlib.py", line 35, in import_module
import(name)
File "/opt/graphite/webapp/graphite/browser/views.py", line 22, in
from graphite.util import getProfile, getProfileByUsername, defaultUser, json
File "/opt/graphite/webapp/graphite/util.py", line 36, in
from graphite.logger import log
File "/opt/graphite/webapp/graphite/logger.py", line 84, in
log = GraphiteLogger() # import-shared logger instance
File "/opt/graphite/webapp/graphite/logger.py", line 40, in init
self.infoHandler = Rotater(self.infoLogFile,when="midnight",backupCount=1)
File "/usr/lib/python2.7/logging/handlers.py", line 171, in init
BaseRotatingHandler.init(self, filename, 'a', encoding, delay)
File "/usr/lib/python2.7/logging/handlers.py", line 64, in init
logging.FileHandler.init(self, filename, mode, encoding, delay)
File "/usr/lib/python2.7/logging/init.py", line 903, in init
StreamHandler.init(self, self._open())
File "/usr/lib/python2.7/logging/init.py", line 928, in _open
stream = open(self.baseFilename, self.mode)
IOError: [Errno 2] No such file or directory: '/opt/graphite/storage/log/webapp/info.log'

now after create webapp dir,this problem is solved!
With this situation Is it correct Image and configuretion?

tnx

boot2docker (windows vm) has issues when trying to run

I'm guessing because boot2docker is incredibly lightweight it doesn't have all the volumes?

docker@boot2docker:$ docker run -d -v /etc/localtime:/etc/localtime:ro -p 80:80 -p 8125:8125/udp -p 8126:8126 --name kamon-grafana-dashboard kamon/grafana_graphite
a4d3e7677c8337f3b56f2c1970e7745adcbcc4334445a976d45c64b00aa7160e
2014/09/05 18:22:31 Error response from daemon: Cannot start container a4d3e7677c8337f3b56f2c1970e7745adcbcc4334445a976d45c64b00aa7160e: setup mount namespace bind mounts mounting /etc/localtime into /mnt/sda1/var/lib/docker/aufs/mnt/a4d3e7677c8337f3b56f2c1970e7745adcbcc4334445a976d45c64b00aa7160e/etc/localtime not a directory
docker@boot2docker:
$

when I delete the -v flag and the volumes I can run. I'm going to skim the docs and see what that does and find out how to remedy on boot2docker (sorry, I'm linux weak)

Provision dashboards?

I'm using Ansible to start up this container, and I'm trying to provision it with a few pre-built dashboards.
Mounting these JSON files under /src/dashboards doesn't seem to work - I only see the default ones. Is there anything else I need to do to have these dashboards automatically be available every time this container is launched?

Instructions to run docker image do not work on OSX

I am trying to follow the instructions to run the docker image from the Kamon.io site.

When I run the following command from the documentation:
docker run -d -v /etc/localtime:/etc/localtime:ro -p 80:80 -p 8125:8125/udp -p 8126:8126 --name kamon-grafana-dashboard kamon/grafana_graphite

I receive an error message:
Cannot start container 8143f54b606cd6bd9928ca05fdd47df3a05575ab396c290cc41a00dedede752a: setup mount namespace mounting /etc/localtime into /mnt/sda1/var/lib/docker/aufs/mnt/8143f54b606cd6bd9928ca05fdd47df3a05575ab396c290cc41a00dedede752a/etc/localtime not a directory

Noob question: Storing metrics outside a container

Hello- I'm relatively new to Graphite/Carbon and Docker, and was trying to figure out via the configuration files...

Where do I configure the destination file system for storing collected metrics? If I had SAN space mounted outside the container, where do I account for piping the metrics off that that mount?

I apologize for the simplicity of this, I just have yet to find anything documented how to keep data resident outside of the Docker container.

Thanks!

Network blackhole

The start script uses 'docker kill' - which is quite fast and untidy at the same time.
I was forwarding additional stats to this container via statsd, and it took me a few days to figure out why the clients stop sending data after I restart this container.

'docker kill' will cause the bound ports not to be closed properly, and that might (and have) cause the restart go unnoticed by the clients, which will continue to send data that ends up being discarded.
Switching to 'docker stop' solves the issue.

gauges are not supported in statsd current version

Are gauges supported in the current statsd version embedded in this image?
I tried to use them but I think the data is not being recorded.
Gauges were added to the statsd server in commit 0ed78be.
Do you know if this version of statsd supports them?
If not, how can I update the current version of statsd?
Thanks!

Disk Usage

I'm getting the following error after running for a few days:

Traceback (most recent call last):
  File "/usr/lib/python2.7/dist-packages/supervisor/loggers.py", line 84, in emit
    self.flush()
  File "/usr/lib/python2.7/dist-packages/supervisor/loggers.py", line 64, in flush
    self.stream.flush()
IOError: [Errno 28] No space left on device

My HDD is around 500GB and only around 13GB is being used, so... I'm not sure why it says its running out of space. Any ideas?

XmlHttpRequest to "http://grafanarel.s3.amazonaws.com/latest.json" fails

I'm using the container via https://registry.hub.docker.com/u/kamon/grafana_graphite/ and when I try to set up a new dashboard, I can not get metrics. My google chrome reports the following error in the developer console:

XMLHttpRequest cannot load http://grafanarel.s3.amazonaws.com/latest.json. No 'Access-Control-Allow-Origin' header is present on the requested resource. Origin 'http://localhost' is therefore not allowed access. (index):1
Failed to load resource: the server responded with a status of 404 (Not Found) 

When I try to open XXX I get this error

{"error":"IndexMissingException[[grafana-dash] missing]","status":404}

Editing the dashboard always hangs with this messages when trying to configure metrics:

Load metrics keys into elastic search
Work in progress...

Building the container myself using the latest Grafana does not fix the issue. Any ideas what I am missing?

Grafana not showing data beyond 7 days

Hi Guys
I have this docker-grafana-graphite setup which has been working pretty well , however i have a bigger problem. My metric data can't live beyond 7 days. I can only see data of last 7 days.

image

I am aware of retention policy in graphite and i have tuned that as per my needs, but still graphite data is not getting stored for long term.

[root@monitoring-server ~]# docker exec -it 11e1290bd77c /bin/bash
root@11e1290bd77c:/# find . -name storage-schemas.conf
./opt/graphite/conf/storage-schemas.conf
root@11e1290bd77c:/# cat /opt/graphite/conf/storage-schemas.conf
[default]
pattern = .*
retentions = 10s:120d,60s:120d,120s:1095d
root@11e1290bd77c:/#

As you can see retention is properly set in the container graphite configuration file but still it cannot preserve data beyond 7 days.

Issue with Docker Image from Docker Registry

Hi all,

I was playing with this Docker Image and it is awesome. However I did notice an issue. When I use the image from the registry, I'm not being able to push the stats. However, when I build the container manually from the repo it works. Is it possible that the docker registry image is not up to date?

Gracias !

Grafana 2 Usage

I built an image from the latest master branch, and started the container, however I'm pretty newbie to the new structure and grafana 2.x
I didn't see queries and metrics to build my own panels, Should I define graphite as a Datasource in grafana? If yes, then shouldn't we open graphite's port also?

I cannot see the dashboard after installing docker-grafana-graphite

Hello guys,

I am new in docker and grafana. We downloaded the repository in a VM behind a proxy (in enterprise cloud). We modified the dockerfile adding the proxies and finally we ran the docker there, apparently it is working fine, we can verify it checking the docker and its logs as below:

"docker ps"
[email protected]:~/docker-grafana-graphite$ docker ps
CONTAINER ID IMAGE COMMAND CREATED STATUS PORTS NAMES
9f6359cd7e36 kamon/grafana_graphite:latest "/usr/bin/supervisor 2 days ago Up 2 days 0.0.0.0:80->80/tcp, 0.0.0.0:8125->8125/udp, 0.0.0.0:8126->8126/tcp kamon-grafana-dashboard

"docker logs 9f6359cd7e36"
[email protected]:~/docker-grafana-graphite$ docker logs 9f6359cd7e36
/usr/lib/python2.7/dist-packages/supervisor/options.py:295: UserWarning: Supervisord is running as root and it is searching for its configuration file in default locaions (including its current working directory); you probably want to specify a "-c" argument specifying an absolute path to a configuration file for improved security
'Supervisord is running as root and it is searching '
2014-09-26 21:33:31,124 CRIT Supervisor running as root (no user in config file)
2014-09-26 21:33:31,125 WARN Included extra file "/etc/supervisor/conf.d/supervisord.conf" during parsing
2014-09-26 21:33:31,202 INFO RPC interface 'supervisor' initialized
2014-09-26 21:33:31,203 CRIT Server 'unix_http_server' running without any HTTP authentication checking
2014-09-26 21:33:31,203 INFO supervisord started with pid 1
2014-09-26 21:33:32,220 INFO spawned: 'nginx' with pid 16
2014-09-26 21:33:32,301 INFO spawned: 'carbon-cache' with pid 17
2014-09-26 21:33:32,304 INFO spawned: 'elasticsearch' with pid 18
2014-09-26 21:33:32,305 INFO spawned: 'graphite-webapp' with pid 19
2014-09-26 21:33:32,324 INFO spawned: 'statsd' with pid 20
2014-09-26 21:33:33,255 INFO success: nginx entered RUNNING state, process has stayed up for > than 1 seconds (startsecs)
2014-09-26 21:33:33,255 INFO success: carbon-cache entered RUNNING state, process has stayed up for > than 1 seconds (startsecs)
2014-09-26 21:33:33,368 INFO success: elasticsearch entered RUNNING state, process has stayed up for > than 1 seconds (startsecs)
2014-09-26 21:33:33,368 INFO success: graphite-webapp entered RUNNING state, process has stayed up for > than 1 seconds (startsecs)
2014-09-26 21:33:33,368 INFO success: statsd entered RUNNING state, process has stayed up for > than 1 seconds (startsecs)

The thing is when we tried to see the dashboard in a browser (doing http://10.64.153.54/#/dashboard), I mean from another VM addressing the first VM using the IP we have the message "This webpage is not available".
Do we miss something? do we need to open a port being behind a proxy?
could you please advise we are lost :(

Thanks in advance

Grafana dashboard is running very slow and gets stuck

My grafana dashboard is running very slow and gets stuck occasionally.
I'm running it on AWS t2.large and the CPU usage is 100%.

I guess the default configurations are not suitable for this load.
This is what I see from top when refreshing the dashboard.
gunicorn_django is eating my CPU every time I try to refresh/ zoom in/ zoom out etc.
Any ideas what I can do to solve it?
Should I increase the worker_processes in the nginx.conf? (it's set to 1)

top - 10:51:09 up 3 days, 1:07, 1 user, load average: 2.06, 1.07, 0.50
Tasks: 125 total, 3 running, 122 sleeping, 0 stopped, 0 zombie
%Cpu(s):100.0 us, 0.0 sy, 0.0 ni, 0.0 id, 0.0 wa, 0.0 hi, 0.0 si, 0.0 st
KiB Mem: 8175600 total, 4283872 used, 3891728 free, 257232 buffers
KiB Swap: 0 total, 0 used, 0 free. 3301996 cached Mem

PID USER PR NI VIRT RES SHR S %CPU %MEM TIME+ COMMAND
18908 root 20 0 141860 58648 3880 R 99.9 0.7 0:05.45 gunicorn_django
18911 root 20 0 140840 58172 3916 R 99.9 0.7 0:04.42 gunicorn_django

graphite web ui

i cant access graphite web ui even when i change the ports.
how can i configure the image so that i can still view the graphite web ui ??
i wish to view the graphite web ui in order to connect it to syren

thnx :)

Recommend Projects

  • React photo React

    A declarative, efficient, and flexible JavaScript library for building user interfaces.

  • Vue.js photo Vue.js

    ๐Ÿ–– Vue.js is a progressive, incrementally-adoptable JavaScript framework for building UI on the web.

  • Typescript photo Typescript

    TypeScript is a superset of JavaScript that compiles to clean JavaScript output.

  • TensorFlow photo TensorFlow

    An Open Source Machine Learning Framework for Everyone

  • Django photo Django

    The Web framework for perfectionists with deadlines.

  • D3 photo D3

    Bring data to life with SVG, Canvas and HTML. ๐Ÿ“Š๐Ÿ“ˆ๐ŸŽ‰

Recommend Topics

  • javascript

    JavaScript (JS) is a lightweight interpreted programming language with first-class functions.

  • web

    Some thing interesting about web. New door for the world.

  • server

    A server is a program made to process requests and deliver data to clients.

  • Machine learning

    Machine learning is a way of modeling and interpreting data that allows a piece of software to respond intelligently.

  • Game

    Some thing interesting about game, make everyone happy.

Recommend Org

  • Facebook photo Facebook

    We are working to build community through open source technology. NB: members must have two-factor auth.

  • Microsoft photo Microsoft

    Open source projects and samples from Microsoft.

  • Google photo Google

    Google โค๏ธ Open Source for everyone.

  • D3 photo D3

    Data-Driven Documents codes.