Git Product home page Git Product logo

remotedebug's Introduction

RemoteDebug Library

A library for Arduino to debug projects over WiFi, with web app or telnet client, with Print commands like Serial Monitor.

logo

arduino-library-badge GitHub release Codacy Badge platform badge GitHub
contributions welcome GitHub issues star this repo

remotedebugapp

A library to remotely debug over a WiFi connection by telnet or web browser

RemoteDebug setup a TCP/IP server, that you connect to debugging, as an alternative to the serial connection

Contents

About

By default the Arduino only has as debug possibility via the Serial port. This has a few disadvantages:

  • requires a physical cable to the Arduino device (if the device is far away or in a remote location this is not easy)
  • debugging multiple Arduinos at the same time requires many serial ports and a lot of cables

With the ESP8266 (NodeMCU) or ESP32 we now have network connectivity (WiFi) which can be used for streaming debugging information in real-time.

This library is good for IoT projects, home automation, mobile robots (can debug it in moviment with a cable ?) or another WiFi projects.

In fact, this library was born of a need to debug an IoT project of home automation. In this project there was a central module and three auxiliary modules, and these were far from each other. One was hard to reach, under the roof of the house. To debug this project, accompanying the exchange of messages in realtime, is impossible to do with traditional way, by USB cable.

The MiP_ESP8266_Library and my ESP32 WiFi robot are example of projects that uses RemoteDebug. See it in: MiP_ESP8266_Library and ESPlorer_v1

RemoteDebug is improved with client buffering (is last send is <= 10ms), to avoid mysterious delays of WiFi networking on ESP32 and ESP8266 boards

Note: If your project not use WiFi, you can use my another library, the SerialDebug library, this library works with any Arduino board.

Note II: RemoteDebug library is now only to Espressif boards, as ESP32 and ESP8266, If need for another WiFi boards, please add an issue about this and we will see if it is possible made the port for your board.

How it looks

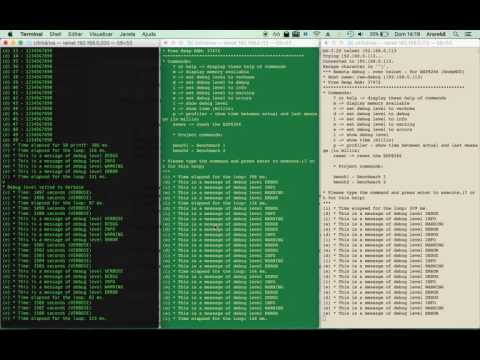
Image: In RemoteDebugApp (web app)

webapp

Image: In telnet client

remotedebug_v2

Youtube (RemoteDebug v2):

youtube1

Youtube (3 telnet connections with RemoteDebug) v1:

youtube2

Github

Contribute to this library development by creating an account on GitHub.

Please give a star, if you find this library useful, this help an another people, discover it too.

Please add an issue for problems or suggestion.

News

  • RemoteDebugApp Beta

    • Now have another repository, RemoteDebugApp It is for local copy of web app in internet. It is updated with lastest version of web app, after it is publised in web server: http://joaolopesf.net/remotedebugapp. Download it, for use when internet is offline. As it is a local copy, the app will check for new versions periodically.

    • An HTML5 web app to use for debugging in web browser, instead telnet client, that uses web socket to comunicate.

    • Now RemoteDebug v3 have a web socket server too, to support the RemoteDebugApp connection.

    • RemoteDebugApp is in beta, if you have any problems or suggestions, please add issue about this.

    • The telnet connection remains, to any want this, or to internet offline uses.

  • Version 2.1.1

    • Now RemoteDebug have a code converter, for help you to convert your codes: to do it, please access the RemoteDebugConverter
  • Version 2.0.0

    • Now RemoteDebug can have the same simple software debugger, that SerialDebug library have. This is done, installing another library, the RemoteDebugger The RemoteDebugger act as an add on to RemoteDebug. To support this addon, the changes in RemoteDebug, is minimum, just a few callbacks It is done to no add extra overhead to projects that no need an debugger. To more informations please access the RemoteDebugger github repository.

    • Now RemoteDebug have a new color system, using more colors, as done in SerialDebugApp

    Note: due the RemoteDebug library, is migrate to Arduino 1.5 format, with folder "src", please delete and reinstall the library to avoid duplication of RemoteDebug sources files.

  • Version 1.5.*

    In 1.5.0 version, we have debug* and rdebug* macros (see below), that put automatically, the name of function that called, and core id (core id is only for ESP32)

Benefits

SerialDebug is better than Arduino default debugging by Serial.print commands:

This is more optimized

Being or not debugging via USB cable, the Serial.print command allways is processed, waste CPU time on microcontroller. In other words, the debug commands are processed, with someone connected in the serial or not.

With RemoteDebug, all debug output is processed only if exists anyone debugging via telnet or web app connection.

And with the debug levels of resource, the volume displayed of messages are reduced for higher levels. For example, only process all messages, if the level is the lowest, the verbose,

RemoteDebug is otimized to reduce overheads, in CPU and memory and include client buffering feature.

Have debug levels

During the development, we can put a lot of debug messages...

But with RemoteDebug, we can put a level in each one.

For all messages (except levels always (debugA) or error (debugE), the message only is processed and showed, if debug level is equal or higher than it level

RemoteDebug have 6 debug levels, in order of priority:

Alway showed:

Error: Critical errors

Always: Important messages

Another levels (showed if level is equal or higher that actual one):

Warning: Error conditions but not critical

Info: Information messages

Debug: Extra information

Verbose: More information than the usual

So We can change the level to verbose, to see all messages. Or to debug to see only debug or higher level, etc.

Is very good to reduce a quantity of messages that a project can generate, to help debugging.

It is easy to migrate

RemoteDebug have a converter to help migrate your Arduino codes, from Serial.prints to this library.

RemoteDebugConverter

Even if you want to do this manually, it's very simple. Please see topic Using above.

Have auto function name and simple profiler

A simple debug:

debugV("* Run time: %02u:%02u:%02u (VERBOSE)", mRunHours, mRunMinutes, mRunSeconds);

Can generate this output in serial monitor:

    (V p:3065 loop C1) * Run time: 00:41:23 (VERBOSE)

    Where:  V: is the level
            p: is a profiler time, elased, between this and previous debug
            loop: is a function name, that executed this debug
            C1: is a core that executed this debug (and a function of this) (only for ESP32)
            The remaining is the message formatted (printf)

For ESP32, the core id in each debug is very good to optimizer multicore programming.

Have commands to execute from telnet or web app

For example:

  • Show help (?)

  • Change the level of debug (v,d,i,w,e), to show less or more messages.

  • See memory (m)

  • Reset the board (reset)

    See about RemoteDebug commands below.

    You can add your own commands, see the examples please

    If your project have RemoteDebugger installed, have a new commands, e.g. call a function, see/change variables, ...

Have a simple software debugger

Now RemoteDebug (version >= 2.0.0), have an simple software debuggger, based in codes of SerialDebug library.

This is another library, that act as an addon to RemoteDebug.

Please acess the RemoteDebugger repository to more informations: RemoteDebugger

Ready for production (release compiler)

For release your device, just uncomment DEBUG_DISABLED in your project
Done this, and no more debug processing.
And better for DEBUG_DISABLED, __RemoteDebug__ have ZERO overhead,
due is nothing of this is compiled.

Web app

As SerialDebug, now RemoteDebug (v3) have an app,the RemoteDebugApp, to debug in web browser.

This app is an HTM5 web app, with websocket to comunicate to Arduino board.
For it, RemoteDebug v3 have a web socket server (can be disabled). It used a local copy of arduinoWebSockets library, due it not in Arduino Library manager.

As a large web page on web server, the solution for Arduino is save it in a storage, like SPIFFS. But not have automatically updates new version in data saved this way, this SPIFFS data is good for a project but not for a library.

Due it, this app not is stored and served by board, instead the app is in web: http://joaolopesf.net/remotedebugapp Note: this not uses SSL (https), due web server socket on Arduino, not supports SSL (wss). But after page load, all traffic is in local network, no data is exposed on internet.

The RemoteDebugApp is a modern HTML5 and needs a modern browsers to work. Internet Explorer 11 and Safari 10 are an examples that not supported. But you can use anothers, as Chrome, Edge, Firefox.

The web app is in beta, please add an issue, for problems or suggestions.

Now have another repository, RemoteDebugApp It is for local copy of web app in internet. It is updated with lastest version of web app, after it is publised in web server: http://joaolopesf.net/remotedebugapp. Download it, for use when internet is offline. As it is a local copy, the app will check for new versions periodically, for you can download a new version.

The telnet remains work, for when want this, or for fails on web app.

Telnet

Telnet is a standard way of remotely connecting to a server and is supported on all operating systems (Windows, Mac, Linux...).

MacOSx and Linux have a native telnet client.

For Windows, a typical telnet client is the Putty: putty .

Have a good tool for mobiles: the Fing, please find it in your mobile store. Its show all devices in local network (WiFi), show ports opened and can execute the telnet client too (external App)

RemoteDebug sets-up a telnet server which is listening to any telnet client that wants to connect. After connection, logging is streamed to the telnet client.

RemoteDebug is very simple to use, after a few lines of initialization code, you can use the well-known "print" commands to stream your logging to the remote client.

Debug levels

RemoteDebug supports the filtering of logging based on debug levels:

Only show for it actual debug level:

  • Verbose
  • Debug
  • Info
  • Warnings

Note: These levels are in the order of most-logging -> least-logging.

Or for always show (not depends of actual debug level):

  • Any
  • Errors

Note: All debugs is processed and showed only if have a client connection.

The telnet client or web app can set the debug level by typing a few simple commands.

Profiler

RemoteDebug includes a simple profiler. It can be enabled by the connected client (telnet or web app) or the Arduino code itself.

When enabled, it shows the time between 2 debug statements, using different colors depending on the elapsed time.

A typical example would be to insert logging just before and after a function after which you can see how much the is spent in the function.

Lightweight

RemoteDebug is designed to give minimal overhead (connected or not) and only process debugs,if there is a client (telnet or web app) connected.

Custom commands

RemoteDebug supports custom commands that can be entered in the client (telnet or web app). These trigger the execution of a custom function in the Arduino code. For example this can be used to send back a status on request of the client.

DISCLAIMER

The current version of RemoteDebug does not yet include any encrypted authentication, only plain text and is intended only for development, not use in production/release.

Future versions, if is possible, will include a secure way for authentication and further testing to support production environments.

Wishlist

- An app to RemoteDebug like SerialDebug have.
- Http page to begin/stop the telnet server or websocket server.
- Authentication as telnet support (kerberos, etc.) to support production environment

Install

Just download or clone this repository.

Or for Arduino IDE, you can use the library manager to install and update the library.

For install help, please click on this: arduino-library-badge

For another IDE, or not using the library manager of Arduino IDE, I suggest you use a Github Desktop app to clone,it help to keep updated.

Please open the projects in example folder, to see it working.

Usage

includes

#include "RemoteDebug.h"  //https://github.com/JoaoLopesF/RemoteDebug

instance

RemoteDebug Debug;

setup

In the setup function after WiFi initialization

// Initialize the server (telnet or web socket) of RemoteDebug

Debug.begin(HOST_NAME);

// OR

Debug.begin(HOST_NAME, startingDebugLevel);

// Options

Debug.setResetCmdEnabled(true); // Enable the reset command

// Debug.showProfiler(true); // To show profiler - time between messages of Debug

Note: to enable the debugger, by RemoteDebugger, please acess this github repository: RemoteDebugger

In the tail of loop function

// Remote debug over WiFi

Debug.handle();

// Or

debugHandle(); // Equal to SerialDebug

In any place of you code:

#ifndef DEBUG_DISABLED
if (Debug.isActive(Debug.<level>)) {
    Debug.printf("bla bla bla: %d %s", number, str); // OR
    Debug.printf("bla bla bla: %d %s", number, str.c_str()); // Note: if type is String need c_str() // OR
    Debug.println("bla bla bla 2 ln");
    Debug.printf("float: %f\n", value); // Not works in ESP8266 :-(
    // Note: to show floats with printf (ESP8266 only),
    // you can use my ArduinoUtil library -> https://github.com/JoaoLopesF/ArduinoUtil
    Debug.printf("float: %s\n", Util.formatFloat(value, 0, 5).c_str());
}
#endif

Note: Using isActive, you need surround the code by DEBUG_DISABLE precompile condition, to avoid compile it for production/release

Or short way (equal to SerialDebug) (prefered if only one debug at time):

debugA("This is a any (always showed) - var %d", var);
debugV("This is a verbose - var %d", var);
debugD("This is a debug - var %d", var);
debugI("This is a information - var %d", var);
debugW("This is a warning - var %d", var);
debugE("This is a error - var %d", var);

debugV("This is a println");

Or if your project uses several Serial.print commands to generate a single debug message for example:

Serial.print("a = ");
Serial.print(a);
Serial.print(" b = ");
Serial.print(b);
Serial.print(" c = ");
Serial.println(c);

can be use rdebug* macros:

rdebugV("a = ");
rdebugV(a);
rdebugV(" b = ");
rdebugV(b);
rdebugV(" c = ");
rdebugVln(c);

Note: in future, I suggest that you migrate this to a single debug command:

debugV(a = %d b = %d c = %d", a, b, c);

An example of use debug levels: (supposing the data is a lot of characters)

if (Debug.isActive(Debug.VERBOSE)) { // Debug message long
    Debug.printf("routine: data received: %s\n", data.c_str()); // Note: if type is String need c_str()
} else if (Debug.isActive(Debug.DEBUG)) { // Debug message short
    Debug.printf("routine: data received: %s ...\n", data.substring(0, 20).c_str()); // %.20s not working :-|
}

Starting at version 1.5.0, debug macros (debug* and rdebug*), automatically put the name of function that called the macro, and core id (core id only for ESP32).

So:

void foo() {

    uint8_t var = 1;
    debugV("this is a debug - var %u", var);
}
It will show in client (telnet or web app):

    (V p:^0000ms) (foo)(C1) this is a debug - var 1

Where:

    V -> verbose
    p -> profiler time
    (foo) -> this is a function name that calls the debug macro
    (C1) -> It is running it Core 1 (only for ESP32)

An example of use debug with serial enabled

Useful to see messages if setup or
in cause the ESP8266/ESP32 is rebooting (client connection stop before received all messages)
Only for this purposes I suggest it
// Setup after Debug.begin

Debug.setSerialEnabled(true); // All messages too send to serial too, and can be see in serial monitor

For reduce overheads RemoteDebug is disconnect the client (telnet or web app), if it not active.

- Please press enter or any key if you need keep the connection
- The default is 5 minutes (You can change it in RemoteDebug.h)  
- You can use mDNS to register each node with different name, it helps to connect without know the IP.

Please not forget to use if clause with Debug.isActive (if not using debug macros)

---> This is very important to reduce overheads and work of debug levels

Please see the samples, basic or advanced, to learn how to use

In advanced sample, I used WifiManager library, ArduinoOTA and mDNS, please see it.

Releases

3.0.5 - 2019-03-23

- Ajustment on debugA macro, thanks @jetpax and @cmidgley to add this issue.

3.0.4 - 2019-03-19

- All public configurations (#defines) have moved to RemoteDebugCfg.h, to facilitate changes for anybody.
- Changed examples, with warnings on change any #define in project,
  with workarounds if it not work. (thanks to @22MarioZ for added this issue)

3.0.3 - 2019-03-18

- Adjustments if web socket is disabled

3.0.2 - 2019-03-16

- Adjustments in examples, added one for debugger

3.0.1 - 2019-03-13

- Adjustments in silente mode
- Commands from RemoteDebugApp now is treated
- Adjusts to RemoteDebugger support connection by web sockets

3.0.0 - 2019-03-10

- If not disabled, add a web socket server to comunicate with RemoteDebugApp (HTML5 web app)
- The standard telnet still working, to debug with internet offline
- Ajustment on debugA macro, thanks @jetpax to add this issue

2.1.2 - 2019-03-08

- Add empty rprint* macros, if debug is disabled

2.1.1 - 2019-03-06

- Create option DEBUG_DISABLE_AUTO_FUNC
- Create macros to be used for code converter: rprint and rprintln
  RemoteDebug now have an code converters to help migrate codes

2.1.0 - 2019-03-04

- Create precompiler DEBUG_DISABLED to compile for production/release,
  equal that have in SerialDebug
- Adjustments in examples

2.0.1 - 2019-03-01

- Adjustments for the debugger: it still disable until dbg command, equal to SerialDebug
- The callback will to be called before print debug messages now
- And only if debugger is enabled in RemoteDebugger (command dbg)
-  Changed handle debugger logic

2.0.0 - 2019-02-28

- Added support to RemoteDebug addon library: the RemoteDebugger, an simple software debugger, based on SerialDebug
- New color system

1.5.9 - 2019-02-18

- Bug -> sometimes the command is process twice
- Workaround -> check time

1.5.8 - 2019-02-08

- New macros to compatibility with SerialDebug (can use RemoteDebug or SerialDebug) thanks to @phrxmd

1.5.7 - 2018-11-03

- Fixed bug for MAX_TIME_INACTIVE, thanks to @achuchev to add this issue

1.5.6 - 2018-10-19

- Adjustments based on pull request from @jeroenst (to allow serial output with telnet password and setPassword method)

1.5.5 - 2018-10-19

- Serial output is now not allowed if telnet password is enabled
- Few adjustments

1.5.4 - 2018-10-05

- Few adjustment in write logic

1.5.3 - 2018-09-04

- Serial output adjustments (due bug in password logic)

1.5.2

- Correct rdebug macro (thanks @stritti)

1.5.1 - 2018-08-28

- New silent mode (command s)

1.5.0 - 2018-08=26

- Auto function name and ESP32 core id for rdebug* macros
- begin method have a option for port number
- Few adjustments
- Added new rdebug?ln to put auto new line

1.4.0 - 2018-08-18

- Simple text password request feature (disabled by default)

    Notes:
      It is very simple feature, only text, no cryptography,
      and the password is echoed in screen (I not discovery yet how disable it)

      telnet use advanced authentication (kerberos, etc.)
      Such as now RemoteDebug is not for production (releases),
      this kind of authentication will not be done now.

1.3.1 - 2018-08-18

- Adjustments in precompiler macros

1.3.0 - 2018-08-17

- Bug in write with latest ESP8266 SDK
- Port number can be modified in project Arduino (.ino file)
-  Few adjustments as ESP32 includes

1.2.2

- Adjustments, as avoid ESP32 include errors
- Telnet port of server can be modified by project
  Just put it in your .ino, before the include:

1.2.0

- Shortcuts and client buffering to avoid mysterious delay of ESP networking

1.1.0

- Adjustments and now runs in Esp32 too.

1.0.0

- Adjustments and improvements from Beta versions.

  New features:

    - Filter
    - Colors
    - Support to Windows telnet client

0.9

- First Beta

Known issues

- Sometimes (rarely) the connection over telnet becomes very slow.
  Especially right after uploading firmware.
  Reset command in telnet connection or turn off/on can be resolve it.
  But I need find why it occurs

Thanks

First thanks a lot for Igrr for bring to us the Arduino ESP8266 and to Espressif to Arduino ESP32

Thanks to Links2004 for a good web server socket, used for web app connection.

For the logo: thanks to a freepik and pngtree sites for free icons that have in logo

Resources:

  - Example of TelnetServer code in http://www.rudiswiki.de/wiki9/WiFiTelnetServer
  - arduinoWebSockets library in https://github.com/Links2004/arduinoWebSockets

End of README

Hit counter on this file, starting at 2019-03-03: HitCount

remotedebug's People

Contributors

bphermansson avatar codacy-badger avatar cubox avatar dtila avatar jmrichard avatar joaolopesf avatar lpmi-13 avatar per1234 avatar potatox avatar

Stargazers

 avatar  avatar  avatar  avatar  avatar  avatar  avatar  avatar  avatar  avatar  avatar  avatar  avatar  avatar  avatar  avatar  avatar  avatar  avatar  avatar  avatar  avatar  avatar  avatar  avatar  avatar  avatar  avatar  avatar  avatar  avatar  avatar  avatar  avatar  avatar  avatar  avatar  avatar  avatar  avatar  avatar  avatar  avatar  avatar  avatar  avatar  avatar  avatar  avatar  avatar  avatar  avatar  avatar  avatar  avatar  avatar  avatar  avatar  avatar  avatar  avatar  avatar  avatar  avatar  avatar  avatar  avatar  avatar  avatar  avatar  avatar  avatar  avatar  avatar  avatar  avatar  avatar  avatar  avatar  avatar  avatar  avatar  avatar  avatar  avatar  avatar  avatar  avatar  avatar  avatar  avatar  avatar  avatar  avatar  avatar  avatar  avatar  avatar  avatar  avatar

Watchers

 avatar  avatar  avatar  avatar  avatar  avatar  avatar  avatar  avatar  avatar  avatar  avatar  avatar  avatar  avatar  avatar  avatar  avatar  avatar  avatar  avatar  avatar  avatar  avatar  avatar  avatar  avatar  avatar  avatar  avatar  avatar  avatar  avatar  avatar  avatar  avatar  avatar  avatar  avatar  avatar

remotedebug's Issues

Question: Can you only get debug message in Loop()?

I would like to be able to get some debug message in the void setup() funtion and even before. Is there any way to do that? I looks like you have to wait for Debug.handle() to run in the void loop() function before any Debug.printf() lines will get executed.

So happy to at least get some Loop() debug with OTA updates.

no display using debugA

First, thanks for a wonderful utility

I found debugA doesn't display

changed line 247 of RemoteDebug.h from

#define debugA(fmt, ...) rdebugVln(fmt, ##__VA_ARGS__)

to

#define debugA(fmt, ...) rdebugAln(fmt, ##__VA_ARGS__)

and seems to work

Feature request: password

Although it can be sniffed by wireshark, a password before entering the debug telnet connection would be nice to prevent unwanted users to open the debug console. The chance that it will be sniffed is pretty low on home lan environments.

Guidance using across multiple cpp files

Sorry for opening an issue for a question - not sure how else to ask.
I have a project where the functionality is split across several cpp files (and an .ino file shell that calls functions from them). They are full of serial debug statements which I would like to replace with your library. (I imagine not a unique scenario)

Could you provide some basic guidance for this scenario and where to do the includes and where to declare the object - I generally work with single file ino files so am not having much luck - all my attempts result in compiler errors. I believe it requires some combination of includes and extern declaration but can't get it working.

(Minor Issue) Serial output always starts with [0m

Describe the bug
When serial output is enabled each line is started with [0m (shown on arduino serial monitor)

To Reproduce
Steps to reproduce the behavior:

  1. Install Arduino
  2. Upload a sketch containing remote debug with serial output enabled
  3. Look in the serial monitor

Expected behavior
A line on the serial monitor should not start with [0m

Screenshots
If applicable, add screenshots to help explain your problem.

Arduino Information:

  • OS: Linux Mint
  • IDE Arduino
  • IDE Version 1.8.9
  • Board ESP32

Additional context
Add any other context about the problem here.

debug messages repeated and ANSI escape showing

I'm seeing what looks like a buffer overflow when sending debug messages, that displays the ANSI escape message )see image)

I don't see them ever when RemoteDebug sends 'Project commands", eg u command in image,
but as you can see when debugI for example sends data from my program, sometimes the previous response is repeated with part of the ANSI escape sequence missing and hence appears as text.

image

namespace breaks macros?

Describe the bug
When inside a namespace, I can't use the debugI, debugV ... shorthands.

Code Example

This prints out the same thing, once via tha long form and once with the debugI macro.

namespace Example {
	void test(const char * prefix) {
		#ifndef DEBUG_DISABLED
		if (Debug.isActive(Debug.INFO)) {
			Debug.printf(prefix, "hi");
		}
		#endif
		debugI(prefix, "hi");
	}
};

Now call Example::testWorks("this says %s");.

Expected behavior
Both ways of printing a debug line should work.

Current behaviour

Here's the compiler output:

some-file: In function 'void Example::test(const char*)':
some-file:29:10: error: expected ')' before 'prefix'
   debugI(prefix, "hi");
          ^

src/RemoteDebug.h:146:84: note: in definition of macro 'rdebugI'
   #define rdebugI(fmt, ...) if (Debug.isActive(Debug.INFO))   Debug.printf("(%s) " fmt, __func__, ##__VA_ARGS__)
                                                                                    ^

src/RemoteDebug.h:195:26: note: in expansion of macro 'rdebugIln'
 #define debugI(fmt, ...) rdebugIln(fmt, ##__VA_ARGS__)
                          ^

some-file:29:3: note: in expansion of macro 'debugI'
   debugI(prefix, "hi");
   ^

Arduino Information:

  • OS: Windows
  • IDE: Arduino IDE
  • IDE Version: 1.8.9
  • Board: ESP8266

Changing MAX_TIME_INACTIVE

The session is automatically closed after 10 minutes and this a problem when debugging.

It should be nice to be able to redefine MAX_TIME_INACTIVE without editing RemoteDebugCfg.h

// Maximum time for inactivity (em milliseconds)
// Default: 10 minutes
// Comment it if you not want this
// Can be by project, just define it before include this file
#ifndef MAX_TIME_INACTIVE // To be added
#define MAX_TIME_INACTIVE 600000
#endif // to be added

Serial output not working

When using this code:
Debug.setSerialEnabled(true);
Debug.begin(esp_hostname);
Debug.setResetCmdEnabled(true);
Debug.setCallBackProjectCmds(&processCmdRemoteDebug);
DEBUG("\n");
DEBUG("ESP8266 started...\n");
Serial.println("\n\nHello\n");
Debug.printf("Hello2\n");

The ESP8266 started (and everyting with the debug macro after this code) is not printed when using the DEBUG macro.
The Hello and Hello2 are printed.

What's wrong?

How to use in included files

C++ newb here. Could you please suggest or show small example of how to use logger if code consists of 3 files:

  • main.cpp
  • lib.cpp
  • lib.h

If i import RemoteDebug in lib.cpp, how do i use it later in main.cpp ? In my case there are way more files that needs access to that logger, but because debugV or other methods requires Debug variable i'm not sure how to use it.

Break execution until connected

Would it be possible to add a function which will pause the execution of all code until someone connects to the debugger?

It would be useful in situations where, for example, you have some code that is executed during setup, before you have the chance to connect.

Interface consistency with SerialDebug

This looks very nifty!

What I find inconvenient, however, is that the library uses a different interface than your own SerialDebug library. There we have DebugV(), printlnD(), debugHandle() etc., here we have Debug.printf(), rprintlnD(), Debug.handle() etc.. Because of this inconsistency neither library is a drop-in replacement for the other and you have to keep modifying your code if you want to change the debugging target.

Personally I think I prefer the way it is done here (through a Debug object and macros that refer to it). But I think either way would be fine, as long as they're consistent.

Way of setting Telnet port

Hi there, and thanx for this nice addition. Worx like a charm.
For reasons of obfuscating, I want to set the Telnet port to something other than 23. I designed a solution for this, see included files. I also changed the word 'setted' into 'set' in several places, hope you don't mind.
Keep up the good work!
PjotrekSE

RemoteDebug.cpp.txt
RemoteDebug.h.txt

Short way debugging

Hey, short way debugging without any paramter doenst work. The docu says rdebugV("text") but this is wrong...

A couple suggestions

After a little more understanding of your code I see the custom callback function that will easily accomplish what I was trying to do with this suggestion in a much better way.

Thank you again...

First, thank you for a great troubleshooting tool!

A have two suggestions. The "m" command only shows the free heap memory which is certainly useful. I have added the flash chip size, sketch size and free sketch space.

//Added the following lines to get more info; 
telnetClient.print("* Flash Chip Size: "); 
telnetClient.println(ESP.getFlashChipSize()); 
telnetClient.print("* Sketch Size: "); 
telnetClient.println(ESP.getSketchSize()); 
telnetClient.print("* Free Sketch Space: "); 
telnetClient.println(ESP.getFreeSketchSpace());

This could arguably be included in the second but I like them separate.

The second suggestion is to add a flag to enable some output configured in the user's sketch triggered by a command. The existing mechanisms are great for periodic diagnostic messages. I often find the desire for diagnostic information on command.

Added to RemoteDebug.h in the public section:

 boolean userInfo;

Added to RemoteDebug.cpp:

help.concat("    u -> trigger user info\r\n");

and

       } else if (_command == "u") {
	// Set flag to enable output of user configured data
	// User must set the flag false
	userInfo = true;
	telnetClient.printf("* User info triggered:\r\n");

Then the user can add something like this to the loop section:

if(Debug.userInfo) {
	// Add code here to output disgnostic information
	INFO("User Info Flag detected\n");
	Debug.userInfo = false;  // Set the flag false to prevent repeating the information
}

Thank you for your great work and consideration of these suggestions.

John

No debug messages displayed when using esp8266 boards package 2.4.2

I just upgraded my @esp8266 core package to 2.4.2 and found that debug messages of any level no longer display to telnet.

The introductory help message displays and responses to input commands still display too but no messages from my sketches are displayed. This affects the example sketches included in the RemoteDebug library too. For example, the code:

      DEBUG_V("* This is a message of debug level VERBOSE\n");
      DEBUG_D("* This is a message of debug level DEBUG\n");
      DEBUG_I("* This is a message of debug level INFO\n");
      DEBUG_W("* This is a message of debug level WARNING\n");
      DEBUG_E("* This is a message of debug level ERROR\n");

will not display to telnet. I tested this by editing the example code with my access point ssid and password only, no other changes and doing a compile on first the 2.4.1 version of esp8266 core then with the 2.4.2 core. While both versions compile with no errors at all, debug messages are displayed with version 2.4.1 but not with 2.4.2.

RemoteDebug_Advanced example, little error

processCmdRemoteDebug doest work properly, in line 288
if (Debug.getLastCommand() = "bench1") {
should be "==" instead of "="?

also Debug.ative, ative is typo with active?
The library is amazing! Thank you

Provide license information with library

This is a very nice library. I cannot find any license information supplied in the repository. Can you please include the license that you are releasing this code under? Thanks.

ESP watchdog reset when telnet client connected to RemoteDebug

Describe the bug
When a client connects to the remote debug telnet port after about 20 seconds the esp becomes unresponsive and the watchdog kicks in...

To Reproduce
Steps to reproduce the behavior:

Install Arduino
Upload a sketch containing remote debug ( github.com/jeroenst/espMQTT )
Connect to the telnet port
Wait for esp to hang and watchdog to kick in

Expected behavior
Esp should not hang

Screenshots

ets Jan 8 2013,rst cause:4, boot mode:(3,6)

wdt reset
load 0x4010f000, len 1384, room 16
tail 8
chksum 0x2d
csum 0x2d
v8b899c12
~ld
(setup)

Arduino Information:

OS: Linux Mint 19.1 Tessa
IDE Arduino
IDE Version 1.8.9
Board ESP8266
Additional context
Add any other context about the problem here.

Update to Usage section

It may be useful to other readers if you added this to the "Usage" section of the readme"

RemoteDebug Debug;

The "basic" example was not very basic to me, so I followed the Usage section thinking that would be bare minimum, but instead I got errors "Debug not declared in this scope".

I like the implementation. Simple to use.
I want to give a big thumbs up to the suggestion in #18. That would be a big help too.

Disable WS is not working

Describe the bug
The switch #define WEBSOCKET_DISABLED true is not working. I'm trying to use RemoteDebug, but I'm not able to disable WebSocket. I need to disable websocket as I'm using it in my code.

I try also the Advance Example and the behavior is the same.

To Reproduce
Steps to reproduce the behavior:

  1. Compile the "RemoteDebug_Advanced" example with #define WEBSOCKET_DISABLED true
  2. Connect to ESP with "http://joaolopesf.net/remotedebugapp/"
  3. If the WS ic disabled I should not be able to connect with application.

Expected behavior
If the switch #define WEBSOCKET_DISABLED true is enabled, the connection with remotedebugapp should not be possible.

Arduino Information:

  • OS: MacOSX,
  • IDE: Atom + PlatformIO
  • IDE: latest
  • Board: ESP32

Getting a debug in startup

Hi,

I am trying to print some values from the startup.
I tried to do it by doing this:

  1. using your basic example
  2. right before the end of startup (below the long list of Serial.println()), I add these lines:
delay(15000);  // this gives me time to connect Putty, 
rdebugDln("startup done");
delay(1000); 
Debug.handle();
delay(5000); // instead of the  yield();

But in Putty, I dont see the startup done, I only see the debug from the loop.
In the docs you mention that Debug.handle(); should be in loop. But is there a way to also use it in startup.

Debug.ANY not implemented

In RemoteDebug_Advanced.ino there is references to Debug.ANY, however, this doesn't exist in RemoteDebug.h.

Can't compile sample for ESP32

Can't compile sample for ESP32, will give the following error:
C:\Users\Evert\Documents\Arduino\libraries\ESP8266-RemoteDebug-Telnet-master\Samples\RemoteDebug_Basic\RemoteDebug_Basic.ino:23:71: fatal error: ESP8266WiFi.h: No such file or directory

Don't get it wifi is working fine with mqtt and webserver.

Free heap decreases after connect/disconnect

I did a small test with a sample sketch:
connected to telnet: OK
quit connection: OK
connected again: OK, small decrease in free heap
quit connection OK
tried to connect again but "connection refused"

I could post my sketch if needed.

Including WebSockets files breaks projects using the library

If you try to build a project that uses the WebSockets library, the files in the RemoteDebug project cause linking errors (multiple definitions of class methods).

I'm writing a library that is using the RemoteDebug library. My library is using WebSockets natively. When building, I get a lot of these linker errors:

.pioenvs/d1_mini/libdf9/libWebSockets_ID549.a(WebSockets.cpp.o): In function `WebSockets::write(WSclient_t*, unsigned char*, unsigned int)':
WebSockets.cpp:(.text._ZN10WebSockets5writeEP10WSclient_tPhj+0x10): multiple definition of `WebSockets::write(WSclient_t*, unsigned char*, unsigned int)'
.pioenvs/d1_mini/lib5ee/libRemoteDebug_ID1266.a(WebSockets.cpp.o):WebSockets.cpp:(.text._ZN10WebSockets5writeEP10WSclient_tPhj+0x10): first defined here
.pioenvs/d1_mini/libdf9/libWebSockets_ID549.a(WebSockets.cpp.o): In function `WebSockets::sendFrame(WSclient_t*, WSopcode_t, unsigned char*, unsigned int, bool, bool)':
WebSockets.cpp:(.text._ZN10WebSockets9sendFrameEP10WSclient_t10WSopcode_tPhjbb+0x24): multiple definition of `WebSockets::sendFrame(WSclient_t*, WSopcode_t, unsigned char*, unsigned int, bool, bool)'
.pioenvs/d1_mini/lib5ee/libRemoteDebug_ID1266.a(WebSockets.cpp.o):WebSockets.cpp:(.text._ZN10WebSockets9sendFrameEP10WSclient_t10WSopcode_tPhjbb+0x24): first defined here
.pioenvs/d1_mini/libdf9/libWebSockets_ID549.a(WebSockets.cpp.o): In function `WebSockets::clientDisconnect(WSclient_t*, unsigned short, char*, unsigned int)':
WebSockets.cpp:(.text._ZN10WebSockets16clientDisconnectEP10WSclient_ttPcj+0x4): multiple definition of `WebSockets::clientDisconnect(WSclient_t*, unsigned short, char*, unsigned int)'
.pioenvs/d1_mini/lib5ee/libRemoteDebug_ID1266.a(WebSockets.cpp.o):WebSockets.cpp:(.text._ZN10WebSockets16clientDisconnectEP10WSclient_ttPcj+0x4): first defined here
.pioenvs/d1_mini/libdf9/libWebSockets_ID549.a(WebSockets.cpp.o): In function `WebSockets::handleWebsocketPayloadCb(WSclient_t*, bool, unsigned char*)':
WebSockets.cpp:(.text._ZN10WebSockets24handleWebsocketPayloadCbEP10WSclient_tbPh+0x18): multiple definition of `WebSockets::handleWebsocketPayloadCb(WSclient_t*, bool, unsigned char*)'
...

Please consider either pulling the WebSockets in as an external dependency (probably works only in PlatformIO) or renaming the WebSockets classes e.g.: WebSockets -> RDWebSockets etc.

Call remote debug with a single statement

Using if ( Debug.isActive( .. ) ) is a bit annoying if you have lots of debug messages.

Using a function like

Debug.printf( debugLevel , "Some string with some format place holders %d %s", some, variables );

code would be cleaner.

it could be implemented as

size_t RemoteDebug::printf (uint8_t debugLevel, const char* format , ...) {
    if (isActive (debugLevel)) {
        va_list argptr;
        va_start (argptr, format);
        printf (format, argptr);
        va_end (argptr);
    } 
}

Do you agree?

Redirect Serial output

I like your idea of remote debugging over telnet. But I see one problem, which is that most of existing libraries use Serial class to trace things. And this traces will not be seen in telnet connection.

Wouln't be possible to redirect Serial output to telnet? I mean implementing something to override default logic. In this way existing libraries traces could be debugged over telnet

Show debug level doesn't show debug level

See this piece of command line print I extracted. I "highlighted" some weird behaviour with two asterisk characters around the value.

> * Debug: Command recevied: l
> * Show debug level: Off
$ v
> * Debug: Command recevied: v
> * Debug level setted to Verbose
$ l
> * Debug: Command recevied: l
> * Show debug level: **On** <- Okay, it's on but I expected it show v or verbose
$ d
> * Debug: Command recevied: d
> * Debug level setted to Debug
$ l
> * Debug: Command recevied: l
> * Show debug level: **Off** <- How can it be off if I just turned it to debug?
$ d
> * Debug: Command recevied: d
> * Debug level setted to Debug
$ l
> * Debug: Command recevied: l
> * Show debug level: **On** <- I redo setting it to debug and now it it's "on"?

It looks like the value for show debug level get's toggled, but also isn't showing the correct debug status.

If telnet password is set the timeout due to inactivity is always set to 1 min

Looking at the code below the telnet connection will be closed after 1 min of inactivity even when MAX_TIME_INACTIVE is set to different value.

`
#ifdef MAX_TIME_INACTIVE

	// Inactivity - close connection if not received commands from user in telnet
	// For reduce overheads

	uint32_t maxTime = MAX_TIME_INACTIVE; // Normal

	if (_password != "") { // Request password - 18/08/08
		maxTime = 60000; // One minute to password
	}

	if ((millis() - _lastTimeCommand) > maxTime) {
		TelnetClient.println("* Closing session by inactivity");
		TelnetClient.stop();
		_connected = false;
		_silence = false;
	}

#endif`

device doesn't reboot after reset

While connected through telnet I can rest the device. It is not rebooting however.

Serial output shows a WDT reset (which is the last message and then nothing...)

Async websockets

Would it be possible to implement the asynchronous websockets in this library?

Compile errors with wemos d1 mini

Compiling for Wemos D1 Mini using Arduino IDE. I receive the following compiler errors.

/Users/zach/Documents/Arduino/libraries/RemoteDebug/RemoteDebug.cpp: In member function 'void RemoteDebug::begin(String, uint16_t, uint8_t)':
/Users/zach/Documents/Arduino/libraries/RemoteDebug/RemoteDebug.cpp:104:25: error: no matching function for call to 'WiFiServer::begin(uint16_t&)'
TelnetServer.begin(port);
^
/Users/zach/Documents/Arduino/libraries/RemoteDebug/RemoteDebug.cpp:104:25: note: candidate is:
In file included from /Users/zach/Library/Arduino15/packages/esp8266/hardware/esp8266/2.3.0/libraries/ESP8266WiFi/src/ESP8266WiFi.h:40:0,
from /Users/zach/Documents/Arduino/libraries/RemoteDebug/RemoteDebug.cpp:65:
/Users/zach/Library/Arduino15/packages/esp8266/hardware/esp8266/2.3.0/libraries/ESP8266WiFi/src/WiFiServer.h:53:8: note: virtual void WiFiServer::begin()
void begin();
^
/Users/zach/Library/Arduino15/packages/esp8266/hardware/esp8266/2.3.0/libraries/ESP8266WiFi/src/WiFiServer.h:53:8: note: candidate expects 0 arguments, 1 provided
exit status 1
Error compiling for board WeMos D1 R2 & mini.

if/else doesn't work (macro problem?)

Describe the bug

this code can never output "x=0"

if (x == 1) debugD("x=1");
else        debugD("x=0");

but this code works

if (x == 1) {debugD("x=1");}
else        {debugD("x=0");}

To Reproduce
Run code snippets above.

WiFiClientSecure.h not found on platform espressif32 (platformio)

Describe the bug
WiFiClientSecure.h not found error when using espressif32 platform with PlatformIO

To Reproduce
Just use remotedebug in a project on PlatformIO with espressif32

Expected behavior
The code should work also under these conditions

Additional context
I used the WEBSOCKET_DISABLED switch but as PlatformIO is compiling the /utility directory I also had to add an entry to library.json:

"build": {
"srcFilter": "+<*> -"
},

Now my project works again but of course this is not ideal... Better to fix the code for espressif32 use.

Some "Errors" detected

Hello,
I have been using your lib for a couple of days and I like it very much.
I have encountered the following (little) problems:
-After resetting the ESP loglevel ist set to 'off', but Errors a still logged.

  • There is a command to switch off logging, but that does not work.
  • The command "off" should be mentioned in the Command-List (it is missing)
  • If you terminate the telnet connection and start a new one, log level is still remembered, I dont know if this is a bug or a feature. IMHO it should be turned off by default an after terminating telnet session.
  • Connecting from two clients at the same time time does not work. Sometimes it blocks the esp-connection.
    Is it possible to connect with more than one client at the same time?

Acitive and deactive RemoteDebug by code

Is it possible active and deactive RemoveDebug by code?
On my project with ESP8266 there is a html page (by webserver) to set some option.
I'd like add a option to active/deactive RemoteDebug, so I can use it when I need without compile my project.

Is it possible? How?

Is possibile change activection time by code without chance library code (default 5 minutes)?

set debug level to OFF again with "o" ?

you have letters for the specific debug-level.
but is there also an "o" or null/0-Zero to set the debug level to "off" again?

or back to the "default" debug-level? what is this?

would be fantastic ... 😄

thanks, very helpful tool!

redebug

Remote Debug für Arduino Mega/Uno/nao

Hello,
I am using your Remote Debug on several ESPxx Projects.
But I also have some projects with Arduino Mega and Ethernet Shield.
Would it not be possible to use it also with the Arduino?
Boris

Websocket interface not displaying correctly

Hi,

Ran into an issue where the string "27" is not been displayed correctly on the websocket interface. The serial port and telnet interfaces do not have this problem.

I'm using release 3.05 using PlatformIO, and the remote debug app from here: http://joaolopesf.net/remotedebugapp/

The following test code should reproduce the issue
` //cut down version of the original problem I observerd
double tmp = 0.000043;
tmp *= 6372795.0;
Debug.printf("5, %f\n", tmp);
rdebugE("6, %f\n", tmp);

//Other examples that don't display correctly on the websocket interface
Debug.println("274.030185");
Debug.println(274.030185);
Debug.println(274);`

And got the following on the websocket interface

(E) 5, 4.030185
(E) (distanceBetween) 6, 4.030185
(E) 4.030185
(E) 4.03
(E) 4

And this on the serial port and telnet interface

(E) 5, 274.030185
(E) (distanceBetween) 6, 274.030185
(E) 274.030185
(E) 274.03
(E) 274

Maybe 27 is being interpreted as an escape character or the like.

Serial output is affected by telnet debug level

Describe the bug
By default serial only outputs the initial level (debug). When the debug level is changed through telnet the serial level is also changed.

To Reproduce
Steps to reproduce the behavior:

  1. Upload a project with remote debug
  2. Open serial console
  3. Login via telnet and change debug level and see how the output on the serial console is affected

Expected behavior
The serial console should not be affected by the telnet debug level. It should output all levels by default and it should be possible to change the level for serial logging it in code.

Screenshots
If applicable, add screenshots to help explain your problem.

Arduino Information:

  • OS: Linux Mint 19.2
  • IDE Arduino IDE
  • IDE 1.8.10
  • Board ESP8266

Additional context
None.

Websocket client

Hello,

we are using RemoteDebug in our access control system for 3D printers and I would like to ask if websocket client can be also implemented .

As we are still developing our FW and we have no problem with RemoteDebug, we could use some remote logging to our server in local network, which can be done by websocket client. Sometimes I need look at log for information what happened and telnet and web app is good but sometimes connection break and I lost log which is very valuable.

I tried implement websocket client at our server, but this is not good solution for us as we do not use static IP addresses at our printers, this is also for mobility of printer (different places, different networks) so this would be very good solution for us and I believe for some other people as well.

If you can at least point it out what need to be changed to implement this, so we can look at it at try that, but for now I´m bit lost.

Thanks

Ability to use flash strings in debug messages

Is your feature request related to a problem? Please describe.

All messages processed by debug are stored in RAM memory.
So in effect, observing/debugging application causes huge difference in RAM utilisation.

Describe the solution you'd like

Something like:
debugI(F("some message stored in flash"));

Besides: excellent library.

ESP32

Hello,
unfortunately the library does not run with the ESP32. Will there be any adjustments?
Boris

show Debug Level

// Show debug level
void RemoteDebug::showDebugLevel(boolean show) {
_showProfiler = show;
}

--> _showDebugLevel

Recommend Projects

  • React photo React

    A declarative, efficient, and flexible JavaScript library for building user interfaces.

  • Vue.js photo Vue.js

    🖖 Vue.js is a progressive, incrementally-adoptable JavaScript framework for building UI on the web.

  • Typescript photo Typescript

    TypeScript is a superset of JavaScript that compiles to clean JavaScript output.

  • TensorFlow photo TensorFlow

    An Open Source Machine Learning Framework for Everyone

  • Django photo Django

    The Web framework for perfectionists with deadlines.

  • D3 photo D3

    Bring data to life with SVG, Canvas and HTML. 📊📈🎉

Recommend Topics

  • javascript

    JavaScript (JS) is a lightweight interpreted programming language with first-class functions.

  • web

    Some thing interesting about web. New door for the world.

  • server

    A server is a program made to process requests and deliver data to clients.

  • Machine learning

    Machine learning is a way of modeling and interpreting data that allows a piece of software to respond intelligently.

  • Game

    Some thing interesting about game, make everyone happy.

Recommend Org

  • Facebook photo Facebook

    We are working to build community through open source technology. NB: members must have two-factor auth.

  • Microsoft photo Microsoft

    Open source projects and samples from Microsoft.

  • Google photo Google

    Google ❤️ Open Source for everyone.

  • D3 photo D3

    Data-Driven Documents codes.