Git Product home page Git Product logo

covid-19-germany-gae's Introduction

COVID-19 case numbers for Germany 😷

Update April 2023: no more daily updates.

Some counties in Germany have stopped reporting data in January 2023, and it is probably fair to say that by now there is not so much demand anymore for a project like this.

I would like to say a huge Thank You for your tremendous interest, for contributing, for critical discussion, and for helping reveal the most brittle kind of edge cases. All that helped keep the data flowing while rarely compromising on quality.

In the future, we hopefully do not need an underground software engineering effort like this anymore, and state of Germany will be able to expose relevant data quickly via useful and robust interfaces.

For me personally, this was a rather significant engineering effort and I learned a whole lot. I feel both, pain and happiness when I go through the almost 300 patches that I had been working on since March 20, 2020.

Literature referencing this project

The following list is based on a non-exhaustive web search:

  • Björn Thor Arnarson, 2021. How a school holiday led to persistent COVID-19 outbreaks in Europe. Nature Scientific Reports (11). HTML
  • Luigi Palatella et al., 2021. A phenomenological estimate of the true scale of COVID-19 from primary data. Chaos, Solitons & Fractals (146). HTML
  • Marcella Alsan et al., 2020; revised 2023. Civil Liberties in Times of Crisis. NBER Working Papers. HTML, PDF, Appendix PDF
  • Naqvi A, 2021. COVID-19 European regional tracker. Scientific Data (8). HTML, PDF
  • Philip Eisenlohr, 2020. Comparative visualization of global COVID-19 progression over time. medium.com. HTML
  • Teodoro Alamo et al., 2020. COVID-19: Open-Data Resources for Monitoring, Modeling, and Forecasting the Epidemic. Electronics (9). HTML
  • S Di Federico, 2022. Availability of open data related to COVID-19 epidemic in Italy. Annali di Igiene. HTML, PDF
  • Mattia Mazzoli et al., 2021. Interplay between mobility, multi-seeding and lockdowns shapes COVID-19 local impact. PLOS Computational Biology. HTML
  • Elaine Ford, Winfried Weck, 2020. Internet and the Pandemic in the Americas. The First Health Crisis of the Digital Era. Book. Konrad Adenauer Stiftung. HTML
  • Björn Thor Arnarson, 2021. Breaks and Breakouts: Explaining the Persistence of COVID-19. SSRN Electronic Journal. HTML
  • Abdollah Jalilian, Jorge Mateu, 2021. A hierarchical spatio-temporal model to analyze relative risk variations of COVID-19: a focus on Spain, Italy and Germany. Stochastic Environmental Research and Risk Assessment. HTML
  • Ben-Hur Cardoso, Sebastian Gonçalves, 2020. Universal scaling law for COVID-19 propagation in urban centers. Preprint. HTML, PDF
  • Fabrizio Pecoraro, Daniela Luzi, 2021. Open Data Resources on COVID-19 in Six European Countries: Issues and Opportunities. Int J Environ Res Public Health. HTML, PDF
  • Teodoro Alamo et al, 2020. Data-Driven Methods to Monitor, Model, Forecast and Control Covid-19 Pandemic: Leveraging Data Science, Epidemiology and Control Theory. HTML, PDF
  • J. Delgado, 2021. Applying the FAIR Principles to Accelerate Health Research in Europe in the Post COVID-19 Era. Proceedings of the 2021 EFMI Special Topic Conference. Google Books Preview
  • Luis Baibás et al., 2020. COVID-19 effective reproductive ratio determination: An application, and analysis of issues and influential factors. Preprint. HTML

Other projects that are or were using this repository

🇩🇪 Übersicht

(see below for an English version)

  • COVID-19 Fallzahlen für Bundesländer und Landkreise.
  • Mehrfach täglich automatisiert aktualisiert.
  • Mit Zeitreihen (inkl. 7-Tage-Inzidenz-Zeitreihen).
  • Aktuelle Einwohnerzahlen und GeoJSON-Daten, mit transparenten Quellen.
  • Präzise maschinenlesbare CSV-Dateien. Zeitstempel in ISO 8601-Notation, Spaltennamen nutzen u.a. ISO 3166 country codes.
  • Zwei verschiedene Perspektiven:

🇺🇸 Overview

  • Historical (time series) data for individual Bundesländer and Landkreise (states and counties).
  • Automatic updates, multiple times per day.
  • 7-day incidence time series (so that you don't need to compute those).
  • Population data and GeoJSON data, with transparent references and code for reproduction.
  • Provided through machine-readable (CSV) files: timestamps are encoded using ISO 8601 time string notation. Column names use the ISO 3166 notation for individual states.
  • Two perspectives on the historical evolution:
    • Official RKI time series data, based on an ArcGIS HTTP API (docs) provided by the Esri COVID-19 GeoHub Deutschland. These time series are being re-written as data gets better over time (accounting for delay in reporting etc), and provide a credible, curated view into the past weeks and months.
    • Time series data provided by the Risklayer GmbH-coordinated crowdsourcing effort (the foundation for what various German newspapers and TV channels show on a daily basis, such as the ZDF but also the foundation for what the JHU) publishes about Germany.

Contact, questions, contributions

You probably have a number of questions. Just as I had (and still have). Your feedback, your contributions, and your questions are highly appreciated! Please use the GitHub issue tracker (preferred) or contact me via mail. For updates, you can also follow me on Twitter: @gehrcke.

Plots

Note that these plots are updated multiple times per day. Feel free to hotlink them.
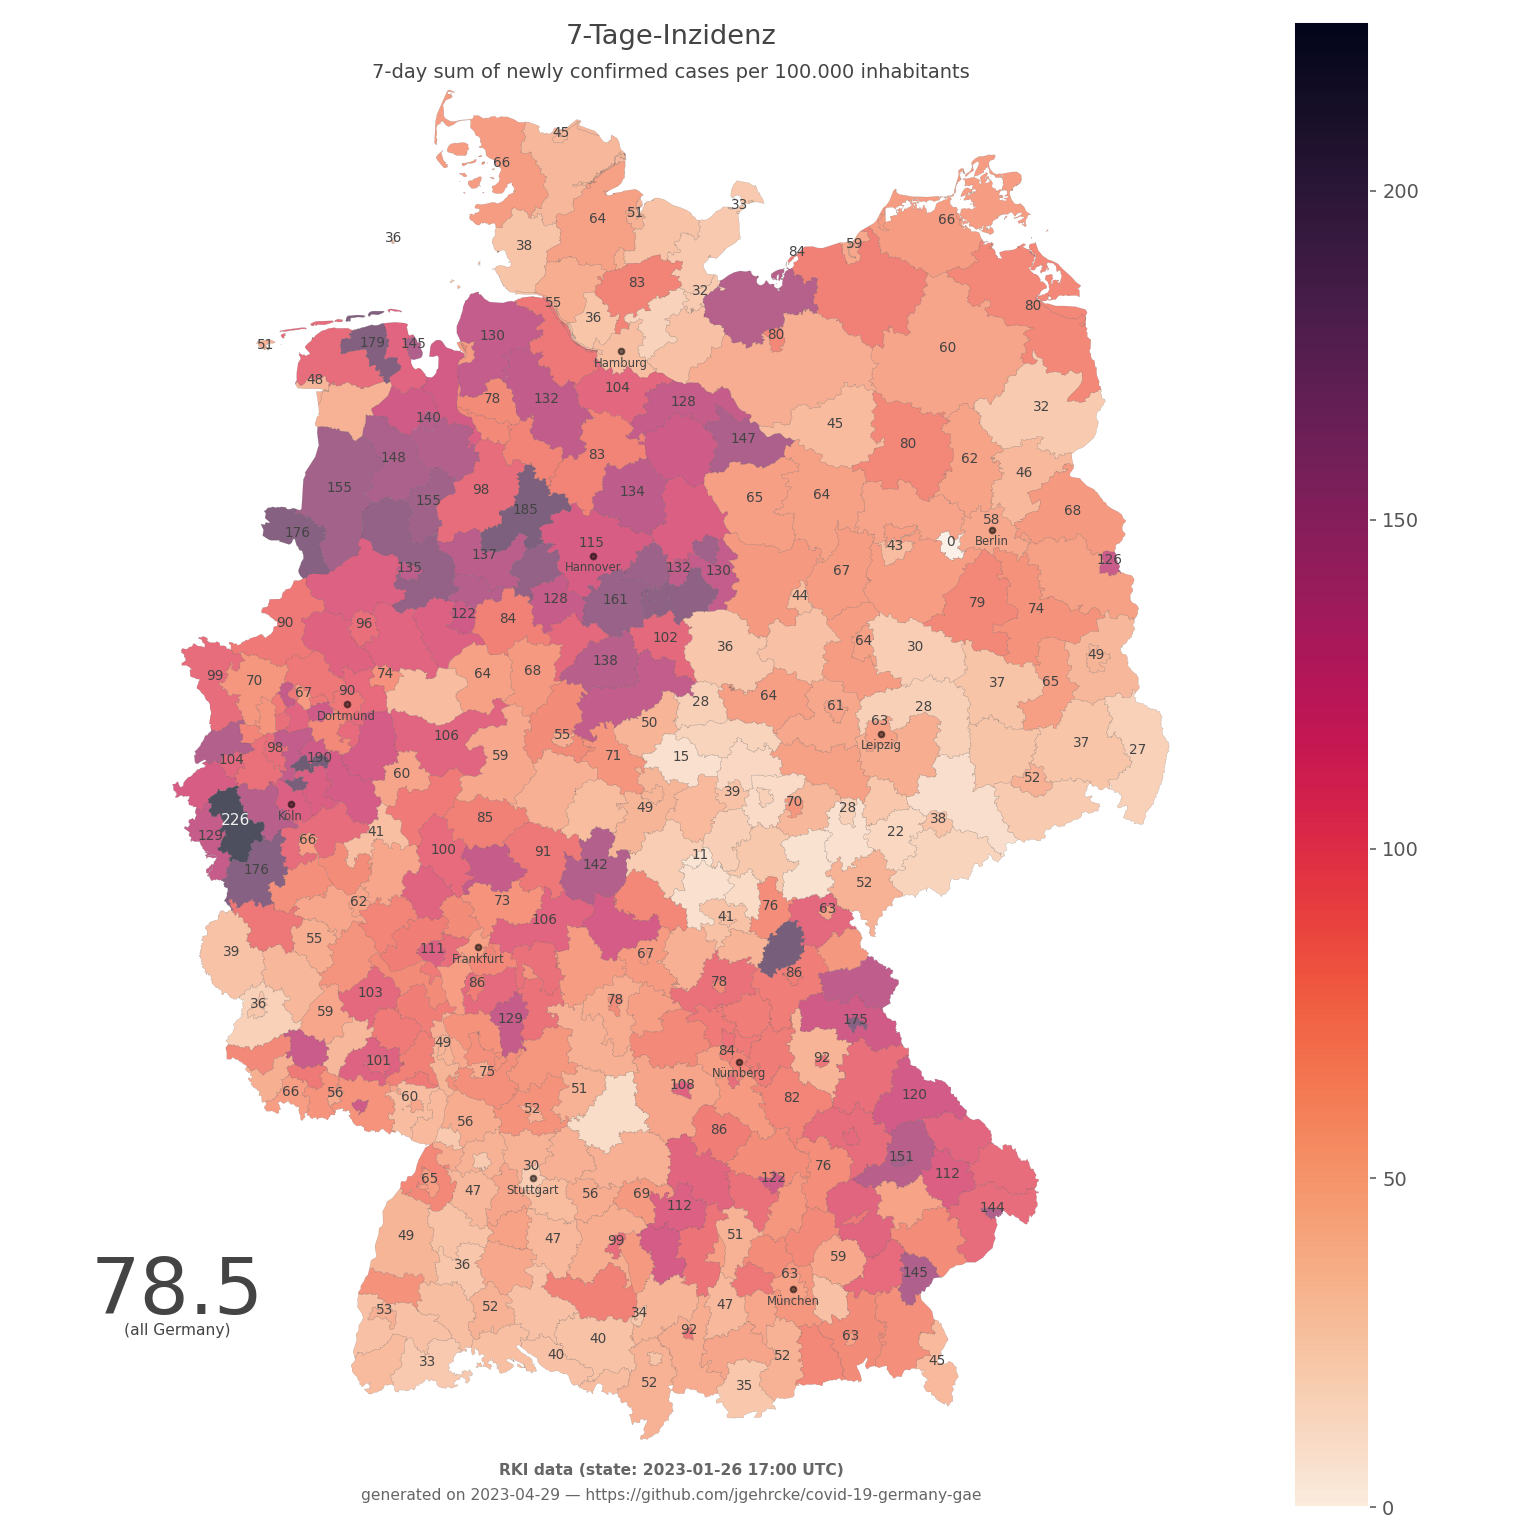
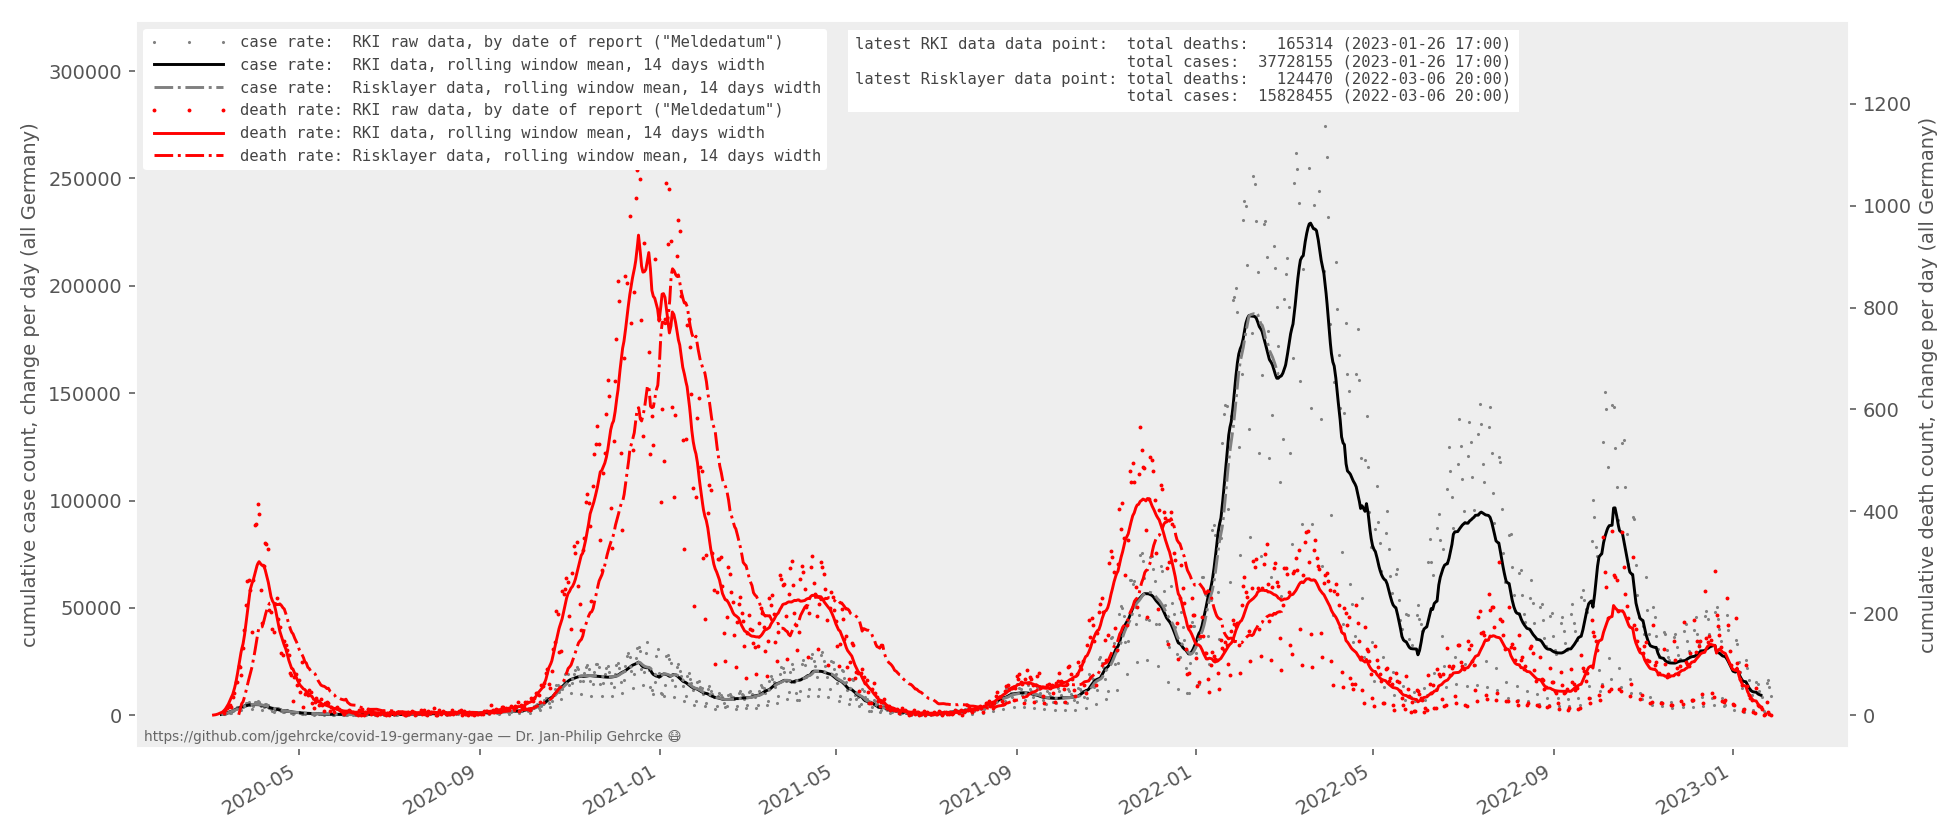
Note: there is a systematic difference between the RKI data-based death rate curve and the Risklayer-based death rate curve. Both curves are wrong, and yet both curves are legit. The incidents of death that we learn about today may have happened days or weeks in the past. Neither curve attempts to show the exact time of death (sadly! :-)) The RKI curve, in fact, is based on the point in time when each corresponding COVID-19 case that led to death was registered in the first place ("Meldedatum" of the corresponding case). The Risklayer data set to my knowledge pretends as if the incidents of death we learn about today happened yesterday. While this is not true, the resulting curve is a little more intuitive. Despite its limitations, the Risklayer data set is the best view on the "current" evolution of deaths that we have.

The individual data files

  • RKI data (most credible view into the past): time series data provided by the Robert Koch-Institut (updated daily):
    • cases-rki-by-ags.csv and deaths-rki-by-ags.csv: per-Landkreis time series
    • cases-rki-by-state.csv and deaths-rki-by-state.csv: per-Bundesland time series
    • 7-day incidence time series resolved by county based on RKI data can be found in more-data/.
    • This is the only data source that rigorously accounts for Meldeverzug (reporting delay). The historical evolution of data points in these files is updated daily based on a (less accessible) RKI ArcGIS system. These time series see amendments weeks and months into the past as data gets better over time. This data source has its strength in the past, but it often does not yet reflect the latest from today and yesterday.
  • Crowdsourcing data (fresh view into the last 1-2 days): Risklayer GmbH crowdsource effort (see "Attribution" below):
  • ags.json:
    • for translating "amtlicher Gemeindeschlüssel" (AGS) to Landreis/Bundesland details, including latitude and longitude.
    • containing per-county population data (see pull/383 for details).
  • JSON endpoint /now: Germany's total case count (updated in real time, always fresh, for the sensationalists) -- Update Feb 2021: the HTTP API was disabled.
  • data.csv: history, mixed data source based on RKI/ZEIT ONLINE. This did power the per-Bundesland time series exposed by the HTTP JSON API up until Jan 2021.

How is this data set different from others?

  • It includes historical data for individual Bundesländer and Landkreise (states and counties).
  • Its time series data is being re-written as data gets better over time. This is based on official RKI-provided time series data which receives daily updates even for days weeks in the past (accounting for delay in reporting).

CSV file details

Focus: predictable/robust machine readability. Backwards-compatibility (columns get added; but have never been removed so far).

  • The column names use the ISO 3166 code for individual states.
  • The points in time are encoded using localized ISO 8601 time string notation.

Note that the numbers for "today" as presented in media often actually refer to the last known state of data on the evening before. To address this ambiguity, the sample timestamps in the CSV files presented in this repository contain the time of the day (and not just the day). With that, consumers can have a vague impression about whether the sample represents the state in the morning or evening -- a common confusion / ambiguity with other data sets.

The recovered metric is not presented because it is rather blurry. Feel free to consume it from other sources!

Quality data sources published by Bundesländer

I tried to discover these step-by-step, they are possibly underrated (April 2020, minor updates towards the end of 2020):

Further resources

Changelog

This is a very high-level changelog. Technical details of reporting changed all the time, most details can be inferred from GitHub issues.

  • 2023-04: disabled daily updates
  • 2022-05: the Risklayer crowdsourcing effort mentioned below has been discontinued in March 2022. Corresponding data files and plots are not updated anymore in this repository.
  • 2021-02: I disabled the HTTP API. It's best to directly use the data files from this respository.

What you should know before reading these numbers

Please question the conclusiveness of these numbers. Some directions along which you may want to think:

  • Germany seems to perform a large number of tests. But think about how much insight you actually have into how the testing rate (and its spatial distribution) evolves over time. In my opinion, one absolutely should know a whole lot about the testing effort itself before drawing conclusions from the time evolution of case count numbers.
  • Each confirmed case is implicitly associated with a reporting date. We do not know for sure how that reporting date relates to the date of taking the sample.
  • We believe that each "confirmed case" actually corresponds to a polymerase chain reaction (PCR) test for the SARS-CoV2 virus with a positive outcome. Well, I think that's true, we can have that much trust into the system.
  • We seem to believe that the change of the number of confirmed COVID-19 cases over time is somewhat expressive: but what does it shed light on, exactly? The amount of testing performed, and its spatial coverage? The efficiency with which the virus spreads through the population ("basic reproduction number")? The actual, absolute number of people infected? The virus' potential to exhibit COVID-19 in an infected human body?

If you keep these (and more) ambiguities and questions in mind then I think you are ready to look at these numbers and their time evolution :-) 😷.

Thoughts about reporting delays

In Germany, every step along the chain of reporting (Meldekette) introduces a noticeable delay. This is not necessary, but sadly the current state of affairs. The Robert Koch-Institut (RKI) seems to be working on a more modern reporting system that might mitigate some of these delays along the Meldekette in the future. Until then, it is fair to assume that case numbers published by RKI have 1-2 days delay over the case numbers published by Landkreise, which themselves have an unknown lag relative to the physical tests. In some cases, the Meldekette might even be entirely disrupted, as discussed in this SPIEGEL article (German). Also see this discussion.

Wishlist: every case should be tracked with its own time line, and transparently change state over time. The individual cases (and their time lines) should be aggregated on a country-wide level, anonymously, and get published in almost real time, through an official, structured data source, free to consume for everyone.

Attributions

Beginning of March 2020: shout-out to ZEIT ONLINE for continuously collecting and publishing the state-level data with little delay.

Edit March 21, 2020: Notably, by now the Berliner Morgenpost seems to do an equally well job of quickly aggregating the state-level data. We are using that in here, too. Thanks!

Edit March 26, 2020: Risklayer is coordinating a crowd-sourcing effort to process verified Landkreis data as quickly as possible. Tagesspiegel is verifying this effort and using it in their overview page. As far as I can tell this is so far the most transparent data flow, and also the fastest, getting us the freshest case count numbers. Great work!

Edit December 13, 2020: for the *-rl-crowdsource*.csv files proper legal attribution goes to

Risklayer GmbH (www.risklayer.com) and Center for Disaster Management and Risk Reduction Technology (CEDIM) at Karlsruhe Institute of Technology (KIT) and the Risklayer-CEDIM-Tagesspiegel SARS-CoV-2 Crowdsourcing Contributors

covid-19-germany-gae's People

Contributors

actions-user avatar github-actions[bot] avatar jgehrcke avatar viktorgrosch avatar

Stargazers

 avatar  avatar  avatar  avatar  avatar  avatar  avatar  avatar  avatar  avatar  avatar  avatar  avatar  avatar  avatar  avatar  avatar  avatar  avatar  avatar  avatar  avatar  avatar  avatar  avatar  avatar  avatar  avatar  avatar  avatar  avatar  avatar  avatar  avatar  avatar  avatar  avatar  avatar  avatar  avatar  avatar  avatar  avatar  avatar  avatar  avatar  avatar  avatar  avatar  avatar  avatar  avatar  avatar  avatar  avatar  avatar  avatar  avatar  avatar  avatar  avatar  avatar  avatar  avatar  avatar  avatar  avatar  avatar  avatar  avatar  avatar  avatar  avatar  avatar  avatar  avatar  avatar  avatar  avatar  avatar  avatar  avatar  avatar  avatar  avatar  avatar  avatar  avatar  avatar  avatar  avatar  avatar  avatar  avatar  avatar  avatar  avatar  avatar  avatar  avatar

Watchers

 avatar  avatar  avatar  avatar  avatar

covid-19-germany-gae's Issues

for the record: useful source for Landkreis metadata

NPGEO Corona
https://npgeo-corona-npgeo-de.hub.arcgis.com/datasets/917fc37a709542548cc3be077a786c17_0
RKI Corona Landkreise
Last updated 14 hours ago | 412 Records

--
This is a great structured resource, describing the individual Landkreise with their metadata properties. The case count is behind, because this is the RKI view on case count.

But this LK metadata can be correlated with LK case count obtained by ZEIT ONLINE or https://github.com/corona-zahlen-landkreis/corona_landkreis_fallzahlen_scraping.
Screenshot:

Screenshot from 2020-03-24 16-43-48

This table as CSV file: here

Make /timeseries endpoint consume data.csv

Right now this endpoint still consumes a private spreadsheet behind the scenes. I manually curate that spreadsheet and derive both, and also derive the CSV file from it. Make the API implementation consume the CSV file in the repo: cleaner, more transparent, more robust information flow.

Describe Meldekette in README

CSSEGISandData/COVID-19#1008

#43

corona-zahlen-landkreis/corona_landkreis_fallzahlen_scraping#39

Highly insightful, from March 23:
https://fragdenstaat.de/anfrage/meldekette-von-coronavirus-zahlen/

Unter anderem um diesen Prozess weiter zu vereinheitlichen und zu beschleunigen, entwickelt das RKI ein elektronisches Melde- und Informationssystem mit dem Namen "DEMIS". Damit sollen die eingehenden Meldungen mit ihrem jeweiligen Bearbeitungsstand allen am Melde- und Übermittlungsweg beteiligten Einrichtungen entsprechend ihren jeweiligen gesetzlichen Zugriffberechtigungen medienbruchfrei in Echtzeit zur Verfügung stehen.

Also:

Die von den Ärzten und Laboren auf unterschiedlichen Wegen und in unterschiedlichen Formaten eingehenden Meldungen müssen zunächst vom Gesundheitsamt erfasst, zusammengeführt und anhand der vom RKI getroffenen Falldefinitionen bewertet werden. Die Daten werden spätestens am nächsten Arbeitstag vom Gesundheitsamt elektronisch an die zuständige Landesbehörde und von dort an das RKI übermittelt.

Landing page: plot new cases

Very cool repo!

It would be nice to also plot the daily new cases for the comparison plot in the landing page. It would help separate true divergence from reporting delay between sources.

Related: #58

additional data elements (beyond infected/cured/deceased)?

I love the progress this repo is making, and I don't have an issue, but rather a question, which I hope someone here can answer: Is there a source in Germany for the data that the Dipartimento della Protezione Civile makes available for Italy? There are two parts, both of which are useful:

  1. Breakdown of currently active cases into home isolated vs. intensive care vs non-ICU hospital.
  2. The number of tests performed on a given day

I have not seen this anywhere, but it is so obviously important to gauge the progress of the outbreak and the effectiveness of countermeasures, that I have to believe that German authorities also capture this information.

Has anyone seen this reported?

Thanks,
Matt

Column names ags.csv

Do you have a link/dataset to convert the columns names in the ags files? I figured out that they are Landkreis Keys and tried to make my own converter, but every dataset I find is in most cases not sufficient.

For example Landkreiskey 1000 => Flensburg

Data update frequency

Hello, I’m looking at the data by state and the latest date is 25 May. How frequent does the data get refreshed?

Nice repo!

Followed your link from the JHU conversation.

I like your use of GAE for this. I once did a tiny little side project on GAE several years ago, but then didn't really keep up with it (as I remember GAE was stuck on Python 2.6 or 2.7 for what seemed like an eternity). I will have to take a look at the Python part of your repo, to get a sense of what's possible now. Performance seems to be excellent: I am in California, and your API is VERY quick, even from here.

Happy to exchange thoughts on this pandemic, here. Or on Twitter, if you prefer. I followed you there, as well.

data.csv missing days of data?

It looks somewhat incomplete - very obvious around April 8th to April 20th, but other dates as well. Given that RKI did report data for the missing days, is there a reason to exclude it, or is this a simple oversight?

Data update

Hi! Great repo! I was just wondering if you are updating the data any time soon. It is now a week old. Thanks!

Data source German "Intensivregister"

There is a new great official data source that gets reports by each hospital for intensive care Covid cases they have (and free ventilators).

https://www.intensivregister.de/#/intensivregister

Unfortunately, they only provide a daily snapshot here in form of a picture of a table and no historic data. My request hasn't been answered now for days. Any interest in starting to include those numbers?

Is it possible to find the infection dates?

Hi,

Thanks for the project! Like you I've been very dismayed by the state of the data being published. I don't understand why we can't just have a CSV with an event stream, with each case ID and then changes to the case.

I'm particularly troubled by the prominence of the "CFR" stat in many dashboards. This stat is near useless, due to the extremely fast growth rate. If the median time from onset to death is 22 days, and cases double every 2.75 days, then while the disease is growing 255/256 cases will be simply too recent to be "eligible" for mortality.

I want to make some more detailed calculations about this, but the problem is that we need to know the time of onset of symptoms for the cases, not simply when they were reported. The RKI figures suggest this information is often recorded, e.g. in Figure 3 here it is available for some cases: https://www.rki.de/DE/Content/InfAZ/N/Neuartiges_Coronavirus/Situationsberichte/2020-03-20-en.pdf?__blob=publicationFile

I suppose I could try to laboriously reconstruct the source figures by zooming in on the PDF, but...wtf. Is the underlying data available somewhere instead?

The public is severely misled about what's going on, because they're looking at this useless CFR figure. I think many decision makers are actually looking at the same picture of things and being misled as well.

Source URL

Thank you for making this!
Could you please share the Zeit JSON URL you use to get the data? I couldn't find it. I guess it's in a .env file not pushed here.
Does the original data have the numbers per Bundesland?

Confirmation of COVID-19 not possible

As of this writing, March 27th, 2020, there is actually no scientific test - as in: a provable and repeatable test - to confirm a case of COVID-19. Here's what the Wikipedia community says:

https://en.wikipedia.org/wiki/Coronavirus_disease_2019#Diagnosis

First the ambiguous part which is probably misleading a large part of the public into thinking that COVID-19 can be tested for:

The WHO has published several testing protocols for the disease. The standard method of testing is real-time reverse transcription polymerase chain reaction (rRT-PCR). The test can be done on respiratory samples obtained by various methods, including a nasopharyngeal swab or sputum sample.[62] Results are generally available within a few hours to two days. Blood tests can be used, but these require two blood samples taken two weeks apart and the results have little immediate value.

This is apparently making many readers believe that the paragraph is describing the diagnosis of COVID-19. It's not, because the clarification is right in the next sentence, emphasis mine:

Chinese scientists were able to isolate a strain of the coronavirus and publish the genetic sequence so that laboratories across the world could independently develop polymerase chain reaction (PCR) tests to detect infection by the virus. As of 19 March 2020, there were no antibody tests though efforts to develop them are ongoing.

There is no test for COVID-19 (the disease) but a test for SARS-CoV-2 (the virus).

So what are symptoms of COVID-19?

Diagnostic guidelines released by Zhongnan Hospital of Wuhan University suggested methods for detecting infections based upon clinical features and epidemiological risk. These involved identifying people who had at least two of the following symptoms in addition to a history of travel to Wuhan or contact with other infected people: fever, imaging features of pneumonia, normal or reduced white blood cell count, or reduced lymphocyte count.

In other words, a wide range of symptoms caused by anything from bacteria to viruses.

Moreover:

One study in China found that CT scans showed ground-glass opacities in 56%, but 18% had no radiological findings. Bilateral and peripheral ground glass opacities are the most typical CT findings, though they are non-specific.

So these are non-specific, but even aside of that: no country has such a large capacity of CT equipment to test each suspected case of COVID-19.

Add to this that the vast majority of published and claimed COVID-19 cases had one or more pre-existing conditions which either weaken the immune-system or attack the lungs, i.e. conditions which would also cause the above symptoms: fever, imaging features of pneumonia, normal or reduced white blood cell count, or reduced lymphocyte count.

I repeat: right now there is no way to prove in any scientific sense that a person infected with SARS-CoV-2 and who also developed e.g. pneumonia is actually infected by COVID-19, or if they were "only" infected by SARS-CoV-2, fought off the infection by SARS-CoV-2 but developed the above symptoms due to an unrelated infection with other bacteria or viruses. Which would actually explain why the vast majority of people infected by SARS-CoV-2 survive without developing any of the above symptoms, and why the vast majority of confirmed or suspected COVID-19 cases had pre-existing conditions, namely conditions causing the exact same symptoms.

Here's how the Robert-Koch-Institute confuses the situation even more:

https://www.rki.de/DE/Content/InfAZ/N/Neuartiges_Coronavirus/Situationsberichte/2020-03-26-en.pdf?__blob=publicationFile

Clinical aspects
Clinical information is available for 26,250 of the notified cases, of which 870 cases were reported as not having any symptoms considered significant for COVID-19. The most common manifestations are cough (14,202; 54%), fever (10,784; 41%), rhinorrhoea (6,158; 23%) and pneumonia (429; 2%). Hospitalisation was reported in 2,664 (10%) of the 26,563 COVID-19 cases with data available. An estimated 5,900 persons have recovered from their COVID-19 infection. Cases were considered to have recovered if they had a known onset of disease on or before 12/03/2020, were not reported to have pneumonia or dyspnea, did not require hospitalisation or had already been discharged and did not die. Cases were included in the algorithm only if information on date of illness onset, symptoms, hospitalisation status and vital status were available.

So the RKI is counting people infected by SARS-CoV-2 who had no symptoms of pneumonia or dyspnea and who were not hospitalised, as cases of cured COVID-19, instead of counting them as cases of SARS-CoV-2 infection without developing COVID-19. I guess that's called proof-through-absence-of-evidence? But don't take my word for it, here's what the RKI itself admits in the German-only case definition file, emphasis mine:

https://www.rki.de/DE/Content/InfAZ/N/Neuartiges_Coronavirus/Falldefinition.pdf?__blob=publicationFile

Epidemiologische Bestätigung
Epidemiologische Bestätigung, definiert als mindestens einer der beiden folgenden Nachweise unter Berücksichtigung der Inkubationszeit:

  • epidemiologischer Zusammenhang mit einer labordiagnostisch nachgewiesenen Infektion beim Menschen durch - Mensch-zu-Mensch-Übertragung
  • Auftreten von zwei oder mehr Lungenentzündungen (Pneumonien) (spezifisches klinisches Bild) in einer medizinischen Einrichtung, einem Pflege- oder Altenheim, bei denen ein epidemischer Zusammenhang wahrscheinlich ist oder vermutet wird, auch ohne Vorliegen eines Erregernachweises.

Please read the last part carefully:

bei denen ein epidemischer Zusammenhang wahrscheinlich ist oder vermutet wird, auch ohne Vorliegen eines Erregernachweises.

in English: a COVID-19 infection is to be treated as confirmed if there were two or more cases of pneumonia in a medical facility, nursing home or retirement home, where an epidemiological connection is probable or suspected, even if there is no positive test result for the virus.

And here is what the RKI says which cases should be reported as confirmed cases of COVID-19, emphasis mine:

Über die zuständige Landesbehörde an das RKI zu übermittelnder Fall
B. Klinisch-epidemiologisch bestätigte Erkrankung
Spezifisches klinisches Bild von COVID-19, ohne labordiagnostischen Nachweis, aber mit epidemiologischer Bestätigung (Auftreten von zwei oder mehr Lungenentzündungen (Pneumonien) in einer medizinischen Einrichtung, einem Pflegeoder Altenheim).
Spezifisches oder unspezifisches klinisches Bild von COVID-19, ohne labordiagnostischen Nachweis, aber mit epidemiologischer Bestätigung (Kontakt zu einem bestätigten Fall).

In English: all cases of pneumonia where two or more cases of pneumonia occured in a medical facility, nursing home or retirement home where an epidemiological connection is established should be transmitted by state authorities to the RKI as a case of COVID-19 even in the absence of a positive test for SARS-CoV-2 in the patient who developed the pneumonia.

So given the fact that:

  • there is no region left in Germany where no person has tested positive for SARS-CoV-2, and
  • therefore the condition that an epidemiological connection must exist is always true for every medical facility, nursing home or retirement home in the country,

the RKI is basically saying that starting in March 2020 all cases of pneumonia in Germany should be reported as COVID-19. Imagine that.

Therefore I think this project, useful as it may be, should correctly label the findings: if they are really just giving positive test numbers for SARS-CoV-2 then it should read that this is what the findings show, nothing more. The numbers should also point out the above: cases of unrelated pneumonia with no testing done for SARS-CoV-2 where the sick person was somehow connected to a confirmed case of SARS-CoV-2 are (mis-)represented as a confirmed case of COVID-19.

Weekly summaries per 100000 population on gist.github, destatis.csv

Hi JGehrcke
Fyinfo, I've put some files under https://gist.github.com/denis-bz

0-covid19-per100000-perweek-allgermany.md
covid19_weeks.py
ags_place_pop.py
destatis-ags-place-pop.csv  -- from a destatis .csv, ags -> Pop Place Land

121may-covid19_weeks.log

No plots --
what do you think of the plot Munich + 6 Landkreise from last week ?

What plots on the web give any insight at all on causes ?

cheers
-- denis-bz-py t-online.de

Data for nr. recovered / nr. active cases ?

Hi JGehrcke
would you know of .csv files with the number of people recovered each day / each city ?
What I'm really looking for is the number of people who could infect others,
active cases:
Total nr cases, from your cases-rki-by-ags.csv
- nr recovered ?
- nr died
- nr in quarantine -- estimate ?

Then one could say e.g. "10 people per 100000 in my area could infect me"
which seems to me a simple way to put the risk in perspective.
What do you think ?

Thanks, cheers
-- denis-bz-py t-online.de

New data, rki.

What's wrong with rki data, Both death and confirm? It's not updating, thank you a lot, it would be very helpful.

Press review "data quality"

Just starting a small list with articles discussing the data quality of data sets. Hope it's fine for you as "issue".

19.03.2020, Berliner Zeitung, "Corona-Statistik - RKI und Johns Hopkins University: Darum weichen die Fallzahlen voneinander ab"

19.03.2020, tagesschau.de, "Zahlen über infizierte Menschen Unterschiedlich, aber nicht falsch"

22.03.2020, Spiegel, "Verwirrung um Fallzahlen vom Robert Koch-Institut - Doch keine Entwarnung bei Corona-Infektionen "

22.03.2020, tagesschau.de, "Infektionszahlen - Zu früh für einen Trend"

24.03.2020, Spiegel, "Statistikprobleme beim Coronavirus - Die große Meldelücke"

27.04.2020, ndr, "Corona: Neue Daten stellen Epidemie-Verlauf infrage"

Add possibility for time series for Germany

Hey there, this is really really great work, thank you very much. I've build a little dashboard my self and want to include the numbers for all of Germany. So far it looks like I can get the timeseries for Germany only via CSV download? Would it be possible for you to add this? The sum seems to be already contained in the data file. Cheers, Daniel

a plot of Covid-19 cases hospitalized per week

Hi J Gehrcke,
just fyinfo, not an issue, here's a plot of Covid-19 cases hospitalized per week, from RKI data:

26aug2020-Covid19-hospitalized-de-25aug

Seems to me that concentrating on the < 10 % of cases who enter hospital
would be more effective than looking at all cases, 90 % of them mild --
what do you think ?

If you know of a data source for nr. hospitalized per Kreis (the RKI Berichte have only the totals for all Germany), please let me know.

cheers
-- denis

A plot of cases in München + 6 Landkreise

Hi JGehrcke
fwiw, here's a plot from your cases-rki-by-ags.csv of 3 May --

07May-denis-M6_covid19

The question is WHY

  1. counties differ -- M 90 % 14/day, DAH and FS >= 20
  2. steep up ~ 25 days, then steep down
    lots of possible reasons
    but none that I know of with testable models ?

cheers
-- denis-bz-py t-online.de

Compare time series from data sources: JHU, Risklayer, RKI, ZEIT ONLINE, ...

With the current state of tooling in this repo we're now approaching a state where it's easy to compare time series obtained from different data sources, and where it will be easy to do so continuously do so (with automation). A simple plot showing the four time series named in the title will reveal a lot about the relationship, differences, and commonalities between the data sources.

deaths num

Could you please provide deaths num in cases-rki-by-ags.csv like you do in data.csv ? That would be very helpful.

Recommend Projects

  • React photo React

    A declarative, efficient, and flexible JavaScript library for building user interfaces.

  • Vue.js photo Vue.js

    🖖 Vue.js is a progressive, incrementally-adoptable JavaScript framework for building UI on the web.

  • Typescript photo Typescript

    TypeScript is a superset of JavaScript that compiles to clean JavaScript output.

  • TensorFlow photo TensorFlow

    An Open Source Machine Learning Framework for Everyone

  • Django photo Django

    The Web framework for perfectionists with deadlines.

  • D3 photo D3

    Bring data to life with SVG, Canvas and HTML. 📊📈🎉

Recommend Topics

  • javascript

    JavaScript (JS) is a lightweight interpreted programming language with first-class functions.

  • web

    Some thing interesting about web. New door for the world.

  • server

    A server is a program made to process requests and deliver data to clients.

  • Machine learning

    Machine learning is a way of modeling and interpreting data that allows a piece of software to respond intelligently.

  • Game

    Some thing interesting about game, make everyone happy.

Recommend Org

  • Facebook photo Facebook

    We are working to build community through open source technology. NB: members must have two-factor auth.

  • Microsoft photo Microsoft

    Open source projects and samples from Microsoft.

  • Google photo Google

    Google ❤️ Open Source for everyone.

  • D3 photo D3

    Data-Driven Documents codes.