Git Product home page Git Product logo

waffle's Introduction

🧇 waffle

Create Waffle Chart Visualizations

Description

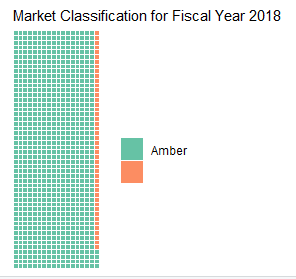
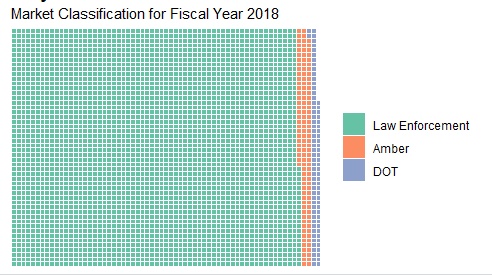
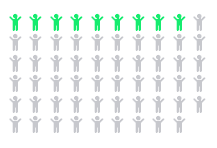
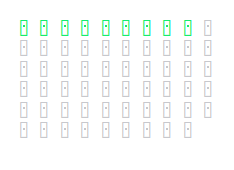
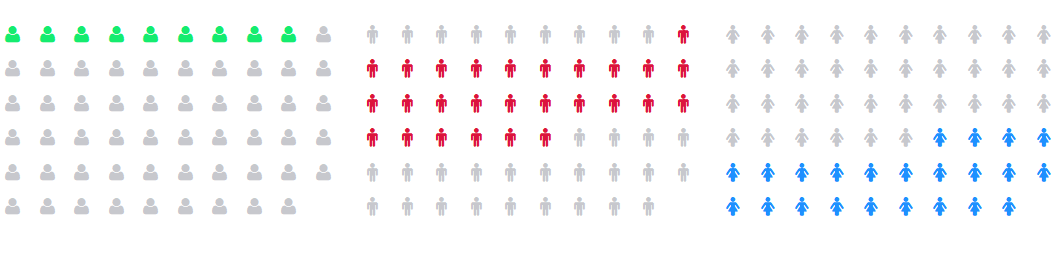
Square pie charts (a.k.a. waffle charts) can be used to communicate parts of a whole for categorical quantities. To emulate the percentage view of a pie chart, a 10x10 grid should be used with each square representing 1% of the total. Modern uses of waffle charts do not necessarily adhere to this rule and can be created with a grid of any rectangular shape. Best practices suggest keeping the number of categories small, just as should be done when creating pie charts. Tools are provided to create waffle charts as well as stitch them together, and to use glyphs for making isotype pictograms.

It uses ggplot2 and returns a ggplot2 object.

What’s Inside the Tin

The following functions are implemented:

  • waffle: Make waffle (square pie) charts

  • draw_key_pictogram: Legend builder for pictograms

  • fa_grep: Search Font Awesome glyph names for a pattern

  • fa_list: List all Font Awesome glyphs

  • fa5_brand: Font Awesome 5 Brand

  • fa5_solid: Font Awesome 5 Solid

  • geom_pictogram: Pictogram Geom

  • geom_waffle: Waffle (Square pie chart) Geom

  • install_fa_fonts: Install Font Awesome 5 Fonts

  • iron: Veritical, left-aligned layout for waffle plots

  • scale_label_pictogram: Used with geom_pictogram() to map Font Awesome fonts to labels

  • theme_enhance_waffle: Waffle chart theme cruft remover that can be used with any other theme

Installation

install.packages("waffle") # NOTE: CRAN version is 0.7.0
# or
remotes::install_github("hrbrmstr/waffle")

NOTE: To use the ‘remotes’ install options you will need to have the {remotes} package installed.

Usage

library(waffle)
library(magrittr)
library(hrbrthemes)
library(ggplot2)
library(dplyr)
library(waffle)

# current verison
packageVersion("waffle")
## [1] '1.0.2'

Some new bits up first

data.frame(
  parts = factor(rep(month.abb[1:3], 3), levels=month.abb[1:3]),
  vals = c(10, 20, 30, 6, 14, 40, 30, 20, 10),
  col = rep(c("navy", "black", "maroon"), 3),
  fct = c(
    rep("Thing 1", 3),
    rep("Thing 2", 3),
    rep("Thing 3", 3)
  )
) -> xdf

xdf %>%
  count(parts, wt = vals) %>%
  ggplot(
    aes(fill = parts, values = n)
  ) +
  geom_waffle(
    n_rows = 20,
    size = 0.33, 
    colour = "white",
    flip = TRUE
  ) +
  scale_fill_manual(
    name = NULL,
    values = c("#a40000", "#c68958", "#ae6056"),
    labels = c("Fruit", "Sammich", "Pizza")
  ) +
  coord_equal() +
  theme_ipsum_rc(grid="") +
  theme_enhance_waffle()

xdf %>%
  count(parts, wt = vals) %>%
  ggplot(
    aes(label = parts, values = n)
  ) +
  geom_pictogram(
    n_rows = 10, 
    aes(colour = parts), 
    flip = TRUE, 
    make_proportional = TRUE
  ) +
  scale_color_manual(
    name = NULL,
    values = c("#a40000", "#c68958", "#ae6056"),
    labels = c("Fruit", "Sammich", "Pizza")
  ) +
  scale_label_pictogram(
    name = NULL,
    values = c("apple-alt", "bread-slice", "pizza-slice"),
    labels = c("Fruit", "Sammich", "Pizza")
  ) +
  coord_equal() +
  theme_ipsum_rc(grid="") +
  theme_enhance_waffle() +
  theme(
    legend.key.height = unit(2.25, "line"),
    legend.text = element_text(size = 10, hjust = 0, vjust = 0.75)
  ) 

xdf %>%
  count(parts, wt = vals) %>%
  ggplot(
    aes(label = parts, values = n)
  ) +
  geom_pictogram(
    n_rows = 20, 
    size = 6, 
    aes(colour = parts), 
    flip = TRUE,
    family = "FontAwesome5Brands-Regular"
  ) +
  scale_color_manual(
    name = NULL,
    values = c("#073f9c", "black", "#f34323"),
    labels = c("BitBucket", "GitHub", "Other")
  ) +
  scale_label_pictogram(
    name = NULL,
    values = c("bitbucket", "github", "git-alt"),
    labels = c("BitBucket", "GitHub", "Other")
  ) +
  coord_equal() +
  theme_ipsum_rc(grid="") +
  theme_enhance_waffle() +
  theme(
    legend.text = element_text(hjust = 0, vjust = 1)
  )

Geoms!

library(hrbrthemes)
library(waffle)
library(tidyverse)

tibble(
  parts = factor(rep(month.abb[1:3], 3), levels=month.abb[1:3]),
  values = c(10, 20, 30, 6, 14, 40, 30, 20, 10),
  fct = c(rep("Thing 1", 3), rep("Thing 2", 3), rep("Thing 3", 3))
) -> xdf

ggplot(
  data = xdf, 
  aes(fill=parts, values=values)
) +
  geom_waffle(
    color = "white", 
    size = 1.125, 
    n_rows = 6
  ) +
  facet_wrap(~fct, ncol=1) +
  scale_x_discrete(
    expand = c(0,0,0,0)
  ) +
  scale_y_discrete(
    expand = c(0,0,0,0)
  ) +
  ggthemes::scale_fill_tableau(name=NULL) +
  coord_equal() +
  labs(
    title = "Faceted Waffle Geoms"
  ) +
  theme_ipsum_rc(grid="") +
  theme_enhance_waffle()

Waffle Bar Charts with scales!

library(dplyr)
library(waffle)

storms %>% 
  filter(year >= 2010) %>% 
  count(year, status) -> storms_df

ggplot(
  data = storms_df, 
  aes(fill = status, values = n)
) +
  geom_waffle(
    color = "white", 
    size = .25, 
    n_rows = 10, 
    flip = TRUE
  ) +
  facet_wrap(
    ~year, 
    nrow = 1, 
    strip.position = "bottom"
  ) +
  scale_x_discrete() + 
  scale_y_continuous(
    labels = function(x) x * 10, # make this multiplier the same as n_rows
    expand = c(0,0)
  ) +
  ggthemes::scale_fill_tableau(name=NULL) +
  coord_equal() +
  labs(
    x = "Year", y = "Count",
    title = "Faceted Waffle Bar Chart",
    subtitle = "{dplyr} storms data"
  ) +
  theme_minimal(
    base_family = "Roboto Condensed"
  ) +
  theme(
    panel.grid = element_blank(), 
    axis.ticks.y = element_line()
  ) +
  guides(
    fill = guide_legend(reverse = TRUE)
  )

Basic example

parts <- c(80, 30, 20, 10)
waffle(parts, rows = 8)

Use a data frame

parts <- data.frame(
  names = LETTERS[1:4],
  vals = c(80, 30, 20, 10)
)

waffle(parts, rows = 8)

Slightly more complex example

c(
  `Un-breached\nUS Population` = (318 - 11 - 79), 
  `Premera` = 11, 
  `Anthem` = 79
) -> parts
waffle(
  parts = parts, 
  rows = 8, 
  size = 1, 
  colors = c("#969696", "#1879bf", "#009bda"),
  legend_pos = "bottom"
)

Health records breaches as fraction of US Population

One square == 1m ppl

waffle(
  parts = parts / 10, 
  rows = 3,
  colors = c("#969696", "#1879bf", "#009bda")
)

Health records breaches as fraction of US Population

(One square == 10m ppl)

library(extrafont)

waffle(
  parts = parts / 10, 
  rows = 3, 
  colors = c("#969696", "#1879bf", "#009bda"),
  use_glyph = "medkit", 
  size = 8
) + 
  expand_limits(
    y = c(0, 4)
  )

Replicating an old favourite

Via: https://www.nytimes.com/2008/07/20/business/20debt.html

c(
  `Mortgage\n($84,911)` = 84911, 
  `Auto and\ntuition loans\n($14,414)` = 14414,
  `Home equity loans\n($10,062)` = 10062, 
  `Credit Cards\n($8,565)` = 8565
) -> savings
waffle(
  parts = savings / 392, 
  rows = 7, 
  size = 0.5, 
  legend_pos = "bottom",
  colors = c("#c7d4b6", "#a3aabd", "#a0d0de", "#97b5cf")
)

Average Household Savings Each Year

(1 square == $392)

More replication

Similar to https://eagereyes.org/techniques/square-pie-charts

professional <- c(`Male` = 44, `Female (56%)` = 56)
waffle(
  parts = professional, 
  rows = 10, 
  size = 0.5,
  colors = c("#af9139", "#544616")
)

Keeps factor by default levels now

With:

iron(
  waffle(
    parts = c(thing1 = 0, thing2 = 100), 
    rows = 5
  ),
  waffle(
    parts = c(thing1 = 25, thing2 = 75), 
    rows = 5
  )
)

Without (you can disable this via keep parameter now):

iron(
  waffle(
    parts = c(thing1 = 0, thing2 = 100), 
    rows = 5, 
    keep = FALSE
  ),
  waffle(
    parts = c(thing1 = 25, thing2 = 75), 
    rows = 5, 
    keep = FALSE
  )
)

Professional Workforce Makeup

Iron example (left-align & padding for multiple plots)

pain.adult.1997 <- c(`YOY (406)` = 406, `Adult (24)` = 24)

waffle(
  parts = pain.adult.1997 / 2,
  rows = 7, 
  size = 0.5,
  colors = c("#c7d4b6", "#a3aabd"),
  title = "Paine Run Brook Trout Abundance (1997)",
  xlab = "1 square = 2 fish", pad = 3
) -> A

pine.adult.1997 <- c(`YOY (221)` = 221, `Adult (143)` = 143)

waffle(
  parts = pine.adult.1997 / 2, 
  rows = 7, 
  size = 0.5,
  colors = c("#c7d4b6", "#a3aabd"),
  title = "Piney River Brook Trout Abundance (1997)",
  xlab = "1 square = 2 fish", pad = 8
) -> B

stan.adult.1997 <- c(`YOY (270)` = 270, `Adult (197)` = 197)

waffle(
  parts = stan.adult.1997 / 2, 
  rows = 7, 
  size = 0.5,
  colors = c("#c7d4b6", "#a3aabd"),
  title = "Staunton River Trout Abundance (1997)",
  xlab = "1 square = 2 fish"
) -> C

iron(A, B, C)

Package Code Metrics

cloc::cloc_pkg_md()
Lang # Files (%) LoC (%) Blank lines (%) # Lines (%)
R 14 0.44 624 0.35 218 0.36 439 0.38
Rmd 2 0.06 255 0.15 88 0.14 139 0.12
SUM 16 0.50 879 0.50 306 0.50 578 0.50

{cloc} 📦 metrics for waffle

Code of Conduct

Please note that this project is released with a Contributor Code of Conduct. By participating in this project you agree to abide by its terms.

waffle's People

Contributors

amrrs avatar breza avatar calbertsen avatar hrbrmstr avatar j450h1 avatar jdbarillas avatar leeper avatar markedmondson1234 avatar matt-jay avatar paulc91 avatar sfirke avatar timelyportfolio avatar

Stargazers

 avatar  avatar  avatar  avatar  avatar  avatar  avatar  avatar  avatar  avatar  avatar  avatar  avatar  avatar  avatar  avatar  avatar  avatar  avatar  avatar  avatar  avatar  avatar  avatar  avatar  avatar  avatar  avatar  avatar  avatar  avatar  avatar  avatar  avatar  avatar  avatar  avatar  avatar  avatar  avatar  avatar  avatar  avatar  avatar  avatar  avatar  avatar  avatar  avatar  avatar  avatar  avatar  avatar  avatar  avatar  avatar  avatar  avatar  avatar  avatar  avatar  avatar  avatar  avatar  avatar  avatar  avatar  avatar  avatar  avatar  avatar  avatar  avatar  avatar  avatar  avatar  avatar  avatar  avatar  avatar  avatar  avatar  avatar  avatar  avatar  avatar  avatar  avatar  avatar  avatar  avatar  avatar  avatar  avatar  avatar  avatar  avatar  avatar  avatar  avatar

Watchers

 avatar  avatar  avatar  avatar  avatar  avatar  avatar  avatar  avatar  avatar  avatar  avatar  avatar  avatar  avatar  avatar  avatar  avatar  avatar  avatar  avatar  avatar  avatar  avatar  avatar  avatar  avatar  avatar  avatar

waffle's Issues

Last element in parts does not display

parts <- c('points' = mean(boxes$points), 'rebounds' = mean(boxes$dktotreb_pts), 'blocks' = mean(boxes$dkblocks_pts), 'x3p' = mean(boxes$dkX3p_pts), 'assists' = mean(boxes$dkassists_pts), 'steals' = mean(boxes$dksteals_pts))

waffle(parts, rows=5, size=1)

the values for points, rebounds, blocks, and assists are displayed in the waffle chart, but not steals. This happens to the last element in the parts list regardless of how it is ordered.
screenshot from 2015-03-22 22 33 29

FontAwesome glyphs not rendering in Windows / RStudio Viewer

It looks like the .css is being loaded correctly and that FontAwesome is a loaded font / font family, but I am unable to get the glyphs to render. I have also tried removing the other Font Awesome* fonts from my machine, but no dice...

library(waffle)
#> Loading required package: ggplot2
library(extrafont)
#> Registering fonts with R

fonts()[grep("Awesome", fonts())]
#> [1] "Font Awesome 5 Brands" "Font Awesome 5 Free"   "FontAwesome"

waffle(c(50, 30, 15, 5), rows = 5, use_glyph = "medkit", glyph_size = 6)

devtools::session_info()
#> Session info -------------------------------------------------------------
#>  setting  value                       
#>  version  R version 3.4.4 (2018-03-15)
#>  system   x86_64, mingw32             
#>  ui       RTerm                       
#>  language (EN)                        
#>  collate  English_United States.1252  
#>  tz       America/New_York            
#>  date     2018-04-10
#> Packages -----------------------------------------------------------------
#>  package      * version    date       source                            
#>  backports      1.1.2      2017-12-13 CRAN (R 3.4.3)                    
#>  base         * 3.4.4      2018-03-15 local                             
#>  colorspace     1.3-2      2016-12-14 CRAN (R 3.4.3)                    
#>  compiler       3.4.4      2018-03-15 local                             
#>  curl           3.2        2018-03-28 CRAN (R 3.4.4)                    
#>  datasets     * 3.4.4      2018-03-15 local                             
#>  devtools       1.13.5     2018-02-18 CRAN (R 3.4.3)                    
#>  digest         0.6.15     2018-01-28 CRAN (R 3.4.3)                    
#>  evaluate       0.10.1     2017-06-24 CRAN (R 3.4.3)                    
#>  extrafont    * 0.17       2014-12-08 CRAN (R 3.4.3)                    
#>  extrafontdb    1.0        2012-06-11 CRAN (R 3.4.1)                    
#>  ggplot2      * 2.2.1.9000 2018-03-22 Github (thomasp85/ggplot2@f1ba983)
#>  graphics     * 3.4.4      2018-03-15 local                             
#>  grDevices    * 3.4.4      2018-03-15 local                             
#>  grid           3.4.4      2018-03-15 local                             
#>  gridExtra      2.3        2017-09-09 CRAN (R 3.4.3)                    
#>  gtable         0.2.0      2016-02-26 CRAN (R 3.4.3)                    
#>  htmltools      0.3.6      2017-04-28 CRAN (R 3.4.3)                    
#>  knitr          1.20       2018-02-20 CRAN (R 3.4.4)                    
#>  labeling       0.3        2014-08-23 CRAN (R 3.4.1)                    
#>  lazyeval       0.2.1      2017-10-29 CRAN (R 3.4.3)                    
#>  magrittr       1.5        2014-11-22 CRAN (R 3.4.3)                    
#>  memoise        1.1.0      2017-04-21 CRAN (R 3.4.3)                    
#>  methods      * 3.4.4      2018-03-15 local                             
#>  munsell        0.4.3      2016-02-13 CRAN (R 3.4.3)                    
#>  pillar         1.2.1      2018-02-27 CRAN (R 3.4.3)                    
#>  plyr           1.8.4      2016-06-08 CRAN (R 3.4.3)                    
#>  RColorBrewer   1.1-2      2014-12-07 CRAN (R 3.4.1)                    
#>  Rcpp           0.12.16    2018-03-13 CRAN (R 3.4.4)                    
#>  rlang          0.2.0.9001 2018-03-27 Github (tidyverse/rlang@49d7a34)  
#>  rmarkdown      1.9        2018-03-01 CRAN (R 3.4.3)                    
#>  rprojroot      1.3-2      2018-01-03 CRAN (R 3.4.3)                    
#>  Rttf2pt1       1.3.6      2018-02-22 CRAN (R 3.4.3)                    
#>  scales         0.5.0.9000 2018-03-05 Github (hadley/scales@d767915)    
#>  stats        * 3.4.4      2018-03-15 local                             
#>  stringi        1.1.6      2017-11-17 CRAN (R 3.4.2)                    
#>  stringr        1.3.0      2018-02-19 CRAN (R 3.4.3)                    
#>  tibble         1.4.2      2018-01-22 CRAN (R 3.4.3)                    
#>  tools          3.4.4      2018-03-15 local                             
#>  utils        * 3.4.4      2018-03-15 local                             
#>  waffle       * 0.9.0      2018-04-10 Github (hrbrmstr/waffle@72778f5)  
#>  withr          2.1.2      2018-03-19 Github (jimhester/withr@79d7b0d)  
#>  yaml           2.1.17     2018-02-27 CRAN (R 3.4.3)

Created on 2018-04-10 by the reprex package (v0.2.0).

Alignment and scaling issue

Follow-up from Twitter conversation...

Trying to make multiple waffle charts, in this case three of them, of raw abundance count, for comparison of abundance against the individual site. Example below is for brook trout abundance in three streams:

part one making the individual plots:

> pain.adult.1997 <- c( `YOY (406)`=406, `Adult (24)`=24)
p.pain.waffle.1997 <- waffle(pain.adult.1997/2, rows=7, size=0.5, 
       colors=c("#c7d4b6", "#a3aabd"), 
       title="Paine Run Brook Trout Abundance (1997)", 
       xlab="1 square = 2 fish")

> pine.adult.1997 <- c( `YOY (221)`=221, `Adult (143)`=143)
p.pine.waffle.1997 <- waffle(pine.adult.1997/2, rows=7, size=0.5, 
                             colors=c("#c7d4b6", "#a3aabd"), 
                             title="Piney River Brook Trout Abundance (1997)", 
                             xlab="1 square = 2 fish")

> stan.adult.1997 <- c( `YOY (270)`=270, `Adult (197)`=197)
p.stan.waffle.1997 <- waffle(stan.adult.1997/2, rows=7, size=0.5, 
                             colors=c("#c7d4b6", "#a3aabd"), 
                             title="Staunton River Trout Abundance (1997)", 
                             xlab="1 square = 2 fish")

I tried a back door method that I have found works well with typical plot elements using the gridExtra and gtable packages to arrange plots. This code is pretty rough. This actually fixes the problem of scaling, but then centers everything.

attempting to gride the waffles

require(gridExtra)
require(gtable)

pain panel graph

gA7 <- ggplot_gtable(ggplot_build(p.pain.waffle.1997))
gB7 <- ggplot_gtable(ggplot_build(p.pine.waffle.1997))
gC7 <- ggplot_gtable(ggplot_build(p.stan.waffle.1997))

maxWidth = unit.pmax(gA7$widths[2:3],
gB7$widths[2:3],
gC7$widths[2:3])

Set the widths

gA7$widths[2:3] <- maxWidth
gB7$widths[2:3] <- maxWidth
gC7$widths[2:3] <- maxWidth

Arrange the four charts

grid.arrange(gA7, gB7, gC7, nrow=3)

This may be a rather crude way to do it if one wants to make multiple graphs (belaying my abject novice status here). But interested in how to best go about this.

README should recommend installing Github version

Due to issues passing data frames to the CRAN version as referenced in #45, the README should probably reflect the recommendation to install using GH, or at least note that using install.packages("waffle") will not necessarily include all functionality demonstrated later in the README

waffle and as_rcdimple

I'm trying to turn waffle static charts in interactive charts.
This is my simple code:

install.packages("waffle") devtools::install_github("timelyportfolio/rcdimple") library(waffle) library(rcdimple) parts <- c( 80, 30, 20, 10 ) as_rcdimple( waffle( parts, rows=8) )

but It gives this error:

Error: could not find function "as_rcdimple"

and if I install waffle in this way:

devtools::install_github("hrbrmstr/waffle")
the error is:

Error in [[<-.data.frame(tmp, fml$left.name, value = NA_real_) : replacement has 1 row, data has 0
In addition: Warning message: axis.ticks.margin is deprecated. Please set margin property of
axis.text instead

Could someone help?

Lost part when scaling

parts =c(a=1000, b=1, c=100)
waffle(parts)
waffle(parts/10)

I would have expected the labels for the 2nd waffle part to be "a" and "c", not "a" and "b". It looks like the items in "c" got moved to the "b" label.

Attempting to create waffle chart with non-integers

Hello,
I'm attempting to create a one-row waffle chart with an Awesome Font character. Essentially, I'm looking to create 10 characters, each of which represents 10% of my sample. I would like to display the fact that 65% of my sample agrees w/ a survey question.

Rather than create a waffle chart w/ 100 characters, 65 of which are the color representing agree (black), I want to create a chart with 10 character, 6.5 of which are black and 3.5 in the color representing disagree (grey). Ideally, I would like the first 6 characters to be black, the 7th character to be half black and half grey, and characters 8-10 to be grey.

Right now, when I enter in 6.5 as my first element and 3.5 as my second element, the package rounds up the first element, so I see 7 black characters and 3 grey characters. I also get a warning message, which I suspect is due to the non-integers.

I've included the code, the image, and warning message below. Is there any way to proportionally fill characters with colors?

Thanks!

waffle(c("Male" = 6.5, "Female" =3.5),

  • rows = 1, use_glyph = "male", glyph_size = 8, colors = c("#000000","#CCCCCC"),
  • xlab = "1 person = 10%", legend_pos = "none", pad = 0)
    Warning message:
    Removed 1 rows containing missing values (geom_text).

agree waffle

FontAwesome not found, Waffle version 0.7.0, R version 3.4.3 (2017-11-30)

Version Details
R version 3.4.3 (2017-11-30)
Waffle version 0.7.0

Issue
When I run the below script I receive the following error message.

"Error: FontAwesome not found. Install via: https://github.com/FortAwesome/Font-Awesome/tree/master/fonts"
*** Please note, when I follow the above link it takes users to a 404 error page. ***

The steps I followed to correct, were to install the Fontawesome files from GitHub as indicated in the waffle package support documentation. I checked that he FA fonts were loaded by running fa_list(), which returned the list of fonts available. I would like to know if I need to call the FA fonts in a different manner to use the use_glyph function within waffle.

Script
library(waffle)
test <- c(40)
waffle(test, rows=1,use_glyph = 'male')

Error when running source code as my own function

Hello,
I'm attempting to modify the source code to change some of the parameters. Here is what I'm doing:

  1. Copy full source code
  2. Paste into script file in R Studio
  3. Name the function waffle_mod <- and run the code

Here is the script with the error message at the bottom. Do you know of any way that I could address this issue?

waffle_mod(c("Male" = 6, "Female" = 4),

  • rows = 1, use_glyph = "male", glyph_size = 8, colors = c("#000000","#CCCCCC"),
  • xlab = "67% Agree", legend_pos = "none")
    Error in fa_unicode() : could not find function "fa_unicode"

v1.0.1 on CRAN and anaconda?

Big fan of the waffle package! Just wondering, currently CRAN only has v0.7. When is v1.0.1 likely to make its way to CRAN? I'm also interested in getting it on anaconda.org, which we use in our organisation. It appears that it's relatively straightforward to get CRAN packages onto anaconda, but as v1.0.1 is only available on github and your CRAN mirror, it's a bit more complex. I'm particularly keen to make use of geom_waffle() which only appears in v1.0.1 (I wrote a chart with geom_waffle and I'd rather not have to rewrite with waffle())

Feeding in Excel/csv information with loop

Hi, I'm new to coding and I'm hoping to make a large number of waffle charts. Essentially, I am hoping to combine the idea of a treemap with a waffle map nested inside -- wherein I have bike share data and am trying to size the larger shape (waffle as a whole) by number of rides and within that shape show blocks that represent number of rides broken down by generation.

I have all of this in an Excel sheet/csv, so could someone help me with some of the syntax for how I could feed in an Excel sheet and have it iterate through creation of charts based on column name?

github

Thanks!

another way to handle sizing of glyphs | get interactivity

For anyone that wants the graphic to be responsive or potentially interactive, I thought it might be helpful to demo this little bit of code. Resize the browser or viewer to see the effect.

library(waffle)
library(extrafont)
library(gridSVG)
library(XML)
library(htmltools)
library(pipeR)

# slightly more complex example
parts <- c(`Un-breached\nUS Population`=(318-11-79), `Premera`=11, `Anthem`=79)
library(extrafont)
waffle(parts/10, rows=3, colors=c("#969696", "#1879bf", "#009bda"),
       use_glyph="medkit", size=8)

grid.export(name=NULL) %>>%
  (.$svg) %>>%
  (~{xmlAttrs(.)["width"]="100%"} ) %>>%
  (~{xmlAttrs(.)["height"]="100%"} ) %>>%
  saveXML %>>%
  HTML %>>%
  html_print

waffle plot come out as empty squares when working in RStudio Notebook (rmarkdown)

When I try the following (see below) example from github from the R console in RStudio, the plot is right, however, I got only empty squares when I try the same example in an RStudio Notebook (rmarkdown).

I am working on MacOS, R 3.6.1, and RStudio 1.2.1564

p1 <- xdf %>%
count(parts, wt = vals) %>%
ggplot(aes(label = parts, values = n)) +
geom_pictogram(n_rows = 10, aes(colour = parts), flip = TRUE, make_proportional = TRUE) +
scale_color_manual(
name = NULL,
values = c("#a40000", "#c68958", "#ae6056"),
labels = c("Fruit", "Sammich", "Pizza")
) +
scale_label_pictogram(
name = NULL,
values = c("apple-alt", "bread-slice", "pizza-slice"),
labels = c("Fruit", "Sammich", "Pizza")
) +
coord_equal() +
theme_ipsum_rc(grid="") +
theme_enhance_waffle() +
theme(legend.key.height = unit(2.25, "line")) +
theme(legend.text = element_text(size = 10, hjust = 0, vjust = 0.75))

Problem, when a zero in the data is included: Is there a workaround?

I am using waffle in a for looping over a dataframe and generating multiple plots.

An example from my data:
1 99
85 15
8 92
1 99
10 90
0 100

The problem is the last set of numbers: When there is a 0 included, waffle behaves like it's a 100. The zero seems to be ignored. Is there a way to prevent this?

Working: Green = 10, orange = 90
waffle(c(10, 90))

Not working: Green = 0
waffle(c(0, 100))

image

image

Horizontal waffle bar chart

The waffle bar chart feature is awesome, but it seems limited to vertical bars only. Is there any way to make a horizontal bar chart. Currently, the code requires coord_equal(), which cannot be combined with coord_flip(), needed for the horizontal chart.

Thanks!

Inconsistent legend labelling

I think this is a problem:

waffle(c(`a`=0, `b`=20, `c`=20), rows=5, pad=1,
       colors=c("red", '#cccccc', "#969696"))

waffle(c(`a`=10, `b`=20, `c`=20), rows=5, pad=1,
       colors=c("red", '#cccccc', "#969696"))

In the first plot the legend is labelled with a and b, even though there are no a's. Note in plot 1 B's appear in red. In the second plot A's appear in red.

Awesome Font Name and Family

Hi,

Thanks for making this awesome package. I am still a beginner so I may be missing something obvious. On Windows 10, I am unable to create any of the carts that Font Awesome glyphs. I did some digging and in the extrafontsdb/fontmap/fonttable.csv, the font name and font table for the Font Awesome fonts do not match what has been specified in the waffle.R file.

glyph_font = "Font Awesome 5 Free Solid",glyph_font_family = "FontAwesome5Free-Solid"

Are you sure this is correct? In the fonttable.csv, it seems to be flipped. I want to understand if there is something wrong with the way I installed these font.

Thanks.

Feature request: mix waffles with and without legends in iron()

Great package! Legends are redundant when I iron together more than three waffle plots with the same legend.

I could not find a way to eliminate legends without Error: ncol(x) == ncol(y) is not TRUE.

EXAMPLE:

boom <- c(red = 12, blue = 16)
boom2 <- c(red = 18, blue = 8)
iron(
  waffle(boom, rows = 2, size = 0.25),
  
  waffle(boom2, rows = 2, size = 0.25) +
    theme(legend.position = "none")
  
)

This may not be possible because of how iron() is built?

Thank you for your work!

`rcdimple` versions

Love it, and coincides nicely with rcdimple, so I'll combine the two. The last example gets very close to a complete replication. Could easily make a function to make it one-liner.

library(waffle)
library(pipeR)
library(rcdimple)

#play with example from ?waffle
parts <- c(80, 30, 20, 10)

waffle(parts, rows=8) %>>%
  ggplot_build %>>%
  (.$data[[1]]) %>>%
  na.omit %>>%
  (dat~
    dimple( dat, y~x, type = "bar", groups = "fill" ) %>>%
      xAxis( type = "addCategoryAxis" ) %>>%
      yAxis( type = "addCategoryAxis" ) %>>%
      default_colors( unique( dat$fill ))
  )

parts <- c(`Un-breached\nUS Population`=(318-11-79), `Premera`=11, `Anthem`=79)

waffle(parts, rows=8, size=1, colors=c("#969696", "#1879bf", "#009bda") ) %>>%
  ggplot_build %>>%
  (.$data[[1]]) %>>%
  na.omit %>>%
  (dat~
     dimple( dat, y~x, type = "bar", groups = "fill", height = 200, width = 800 ) %>>%
     xAxis( type = "addCategoryAxis", title  = "One square == 1m ppl" ) %>>%
     yAxis( type = "addCategoryAxis" ) %>>%
     default_colors( unique( dat$fill ) ) %>>%
     set_bounds( x = "5%", y = "10%", width = "80%", height = "70%") %>>%
     add_title("Health records breaches as fraction of US Population")
  )


waffle(parts/10, rows=3, colors=c("#969696", "#1879bf", "#009bda") ) %>>%
  ggplot_build %>>%
  (.$data[[1]]) %>>%
  na.omit %>>%
  (dat~
    dimple( dat, y~x, type = "bar", groups = "fill", height = 200, width = 600 ) %>>%
    xAxis( type = "addCategoryAxis", title  = "One square == 10m ppl" ) %>>%
    yAxis( type = "addCategoryAxis" ) %>>%
    default_colors( unique( dat$fill ) ) %>>%
    set_bounds( x = "5%", y = "10%", width = "80%", height = "70%") %>>%
    add_title("Health records breaches as fraction of US Population")
  )


# replicating an old favourite

# http://graphics8.nytimes.com/images/2008/07/20/business/20debtgraphic.jpg
# http://www.nytimes.com/2008/07/20/business/20debt.html
savings <- c(`Mortgage ($84,911)`=84911, `Auto and\ntuition loans ($14,414)`=14414, `Home equity loans ($10,062)`=10062, `Credit Cards ($8,565)`=8565)
waffle(
  savings/392, rows=7, size=0.5
  , colors=c("#c7d4b6", "#a3aabd", "#a0d0de", "#97b5cf")
) %>>%
  ggplot_build %>>%
  (.$data[[1]]) %>>%
  na.omit %>>%
  (dat~
     dimple( dat, y~x, type = "bar", groups = "fill", height = 300, width = 800 ) %>>%
     xAxis( type = "addCategoryAxis", title  = "1 square == $392" ) %>>%
     yAxis( type = "addCategoryAxis" ) %>>%
     default_colors( unique( dat$fill ) ) %>>%
     set_bounds( x = "5%", y = "10%", width = "80%", height = "70%") %>>%
     add_title("Average Household Savings Each Year")
  )


# do almost everything in one pipe

# similar to but not exact
# https://eagereyes.org/techniques/square-pie-charts
professional <- c(`Male`=44, `Female (56%)`=56)
waffle(
  professional, rows=10, size=0.5
  , colors=c("#af9139", "#544616")
  , title="Professional Workforce Makeup"
) %>>%
  (wf ~
    ggplot_build(wf) %>>%
      (.$data[[1]]) %>>%
      ( data.frame(
        group = wf$scales$scales[[3]]$labels[
          match(wf$data$value,unique(wf$data$value))
        ]
        , .
        , stringAsFactors = F 
      ) ) %>>%
      na.omit %>>%
      (dat~
         dimple( dat, y~x, type = "bar", groups = "group"
           , height = 500, width = 500, barGap = 0.08
         ) %>>%
         xAxis( type = "addCategoryAxis", title  = "" ) %>>%
         yAxis( type = "addCategoryAxis" ) %>>%
         default_colors( unique( dat$fill ) ) %>>%
         set_bounds( x = "5%", y = "10%", width = "65%", height = "70%") %>>%
         add_legend( x = "85%", y = "40%", width = "10%", height = "20%" ) %>>%
         add_title(wf$labels$title)
      )
  ) %>>%
  tack( options = list(tasks = list(
    htmlwidgets::JS(
      'function(){
          this.widgetDimple[0].axes.forEach(function(ax){
            ax.shapes.remove()
          })
      }'
    )
  )))

Can't reorder factors

Using the waffle package, it seems the code does not respond when factors are reordered using, for example:

factor(data, levels=c("2", "1", "3"))

From my testing, the order is based on order of factor appearance in data frame.

FontAwesome glyphs not exporting using ggplot

Hello, I'm having an issue where I can generate a waffle plot in RStudio, but it won't export with the glyphs included. On attempting to export the plots with ggplot's "ggsave", I am having the same issue that other users have reported, where the icon displays a colored dot instead of the glyph. I'm trying to reproduce a set of graphs using someone else's code. This is the error:

There were 50 or more warnings (use warnings() to see the first 50)
> warnings()
Warning messages:
1: In grid.Call.graphics(C_text, as.graphicsAnnot(x$label),  ... :
  font family 'FontAwesome' not found, will use 'wqy-microhei' instead`

I've installed FontAwesome 4.7.0.ttf, reinstalled waffle from GitHub instead of Cran, and tried the following code options to import/force FA to be recognized:

#Load font
font_import(paths = dirname(fa_font), prompt = FALSE)
fonts()
## [1] "FontAwesome"
if (.Platform$OS.type == "windows") loadfonts("win")
#FontAwesome already registered with windowsFonts().
# [1] "FontAwesome"

extrafont::loadfonts(device="win")
system.file("fonts", package="waffle")
loadfonts(device = "win")

font_import(pattern = 'fontawesome-webfont.ttf')

# check that Font Awesome is imported
fonts()[grep("Awesome", fonts())]

#check that FA glyphs are available
fa_list()

Every attempt to verify that Font Awesome is loaded appears to confirm that it is working. It's obviously loaded and available in RStudio. I can save the plot from the RStudio plot window and the icons will be there. There's some sort of disconnect between waffle, ggplot, and Font Awesome.

This code works:

waffle(c(data), flip = FALSE, reverse = TRUE, pad = 0, use_glyph = "male", size = 0.5,
       colors = c("#e31a1c", "#fd8d3c", "#fecc5c", "#ffffb2")) + theme(legend.position="none")

This code produces the pngs with missing glyphs:

#
for (i in 1 : nrow(rawdata)) {
  ## create data for current level
  a <- as.integer(as.character(rawdata[i, 15]))
  b <- as.integer(as.character(rawdata[i, 16]))
  c <- as.integer(as.character(rawdata[i, 17]))
  d <- as.integer(as.character(rawdata[i, 18]))
  data <- c(a, b, c, d)
  
## plot waffle charts & save as PNG files.
#
  
waf <-waffle(data, flip = TRUE, reverse = TRUE, pad = 0, use_glyph = "male", size = 0.5,
              colors = c("#e31a1c", "#ff7f00", "#fdbf6f", "#ffeda0")) + theme(legend.position="none")
 
  ## create customized name
  filename <- paste0(rawdata$`GIS ID`[i],'.png')
  ggsave(filename, waf, dpi = 1500)
}

Any suggestions would be welcome. Thanks!

Accept labels

Hello

What if I have 2 columns, one with the labels and the other with the values?

for example

mydata <- data.frame(group=c("A", "B", "0", "AB"), FR=c(20, 32, 32, 16))

It would be great if waffle could create the graph using that group names and that FR directly.
something like waffle(mydata$FR, mydata$group)
Without needing to rewrite it as mydata <- c('A'=20, 'B'=32, '0'=32, 'AB'=16)

error using facet_grid() with more than one faceting variable - invalid 'times' argument

While facet_wrap() works like a charm, facet_grid() leads to an error when used with a second (or more) faceting variable.

I attached a reprex below.

Thanks for a great package!

library(hrbrthemes)
library(waffle)
#> Loading required package: ggplot2
library(tidyverse)

tibble(
  parts = factor(rep(month.abb[1:3], 3), levels=month.abb[1:3]),
  values = c(10, 20, 30, 6, 14, 40, 30, 20, 10),
  fct = c(rep("Thing 1", 3), rep("Thing 2", 3), rep("Thing 3", 3)),
  fct2 = c(rep('a', 4), rep('b', 5))
) -> xdf

ggplot(xdf, aes(fill=parts, values=values)) +
  geom_waffle(color = "white", size=1.125, n_rows = 10, 
              make_proportional = TRUE) +
  facet_wrap(fct2~fct) +
  scale_x_discrete(expand=c(0,0)) +
  scale_y_discrete(expand=c(0,0)) +
  ggthemes::scale_fill_tableau(name=NULL) +
  coord_equal() +
  labs(
    title = "Faceted Waffle Geoms"
  ) +
  theme_ipsum_rc(grid="") +
  theme_enhance_waffle()

library(hrbrthemes)
library(waffle)
library(tidyverse)

tibble(
  parts = factor(rep(month.abb[1:3], 3), levels=month.abb[1:3]),
  values = c(10, 20, 30, 6, 14, 40, 30, 20, 10),
  fct = c(rep("Thing 1", 3), rep("Thing 2", 3), rep("Thing 3", 3)),
  fct2 = c(rep('a', 4), rep('b', 5))
) -> xdf

ggplot(xdf, aes(fill=parts, values=values)) +
  geom_waffle(color = "white", size=1.125, n_rows = 10, 
              make_proportional = TRUE) +
  facet_grid(fct2~fct) +
  scale_x_discrete(expand=c(0,0)) +
  scale_y_discrete(expand=c(0,0)) +
  ggthemes::scale_fill_tableau(name=NULL) +
  coord_equal() +
  labs(
    title = "Faceted Waffle Geoms"
  ) +
  theme_ipsum_rc(grid="") +
  theme_enhance_waffle()
#> Error in rep(as.character(.x[[use]][i]), .x[["values"]][i]): invalid 'times' argument

Created on 2019-07-24 by the reprex package (v0.3.0)

Problems with data frames

Hello,

I'm trying to use a data.frame as a parts argumento to the waffle function, but I'm getting a object type error. Using your example to reproduce the error the problem persists.

> parts <- data.frame(
+   names = LETTERS[1:4],
+   vals = c(80, 30, 20, 10)
+ )
> 
> waffle(parts, rows = 8)
Error in FUN(X[[i]], ...) : 
  (list) object cannot be coerced to type 'double'

Any idea on what's happening? The only way to get it working is to pass a vector.

`iron()` doesn't return a ggplot object

It might be helpful to allow users to save the output of iron() as an object for later use with ggsave(), patchwork, gridExtra, etc. Plots created with waffle() are returned as gg/ggplot objects, but the output of iron() is currently NULL.

Here's a reprex:

library(tidyverse)
library(waffle)

iron(
  waffle(c(thing1 = 0, thing2 = 100), rows = 5),
  waffle(c(thing1 = 25, thing2 = 75), rows = 5)
)

# Try to save this as an object
ironed_plot <- iron(
  waffle(c(thing1 = 0, thing2 = 100), rows = 5),
  waffle(c(thing1 = 25, thing2 = 75), rows = 5)
)

# There's immediate output...
# And the object is null, so we can't use it with ggsave()
ironed_plot
#> NULL

# This is the only way to get this to work with iron()
ggsave(last_plot(), filename = "ironed.pdf")
#> Saving 7 x 5 in image

We can work around this issue right now with patchwork or gridExtra by saving the individual waffle plot as objects and then not using iron(), but then the margins between the waffles are too big.

# Semi workaround with patchwork, but between-margins are too big
library(patchwork)

plot1 <- waffle(c(thing1 = 0, thing2 = 100), rows = 5)
plot2 <- waffle(c(thing1 = 25, thing2 = 75), rows = 5)

ironed_plot_patchwork <- plot1 + plot2 +
  plot_layout(ncol = 1)

ironed_plot_patchwork

# This works now
ggsave(ironed_plot_patchwork, filename = "ironed_patchwork.pdf")
#> Saving 7 x 5 in image

R CMD check warning

checking whether package ‘waffle’ can be installed ... WARNING
Found the following significant warnings:
  Warning: replacing previous import by ‘grid::arrow’ when loading ‘waffle’
  Warning: replacing previous import by ‘grid::unit’ when loading ‘waffle’
See ‘/private/tmp/Rtmp7xChS1/check_cran15edd13c5afb7/waffle.Rcheck/00install.out’ for details.

Please fix ASAP. I'm submitting to CRAN tomorrow.

Feature request: Ability to pass in a data frame and use facets

Say you have data like this:

   day bugs spiders worms
1    0    51        49        39
2   2    28        72        61
3   3    41        59        48
4  4    42        58        474

It would be great if you could do this:

waffle(df) + facet_grid(month~.)

I think the default behaviour if you don't add the facet should be to take the mean across days.

long list of waffle() plots to iron()?

Hi,

Thanks for creating this lovely package!

'm attempting to use iron() to stack hundreds of individual waffle plots. Each of my waffle plots is currently an element in a list. For example, my.list$waffle.1, my.list#waffle.2, etc.

I can't figure out how to supply this long list() of waffles to iron() in a simple, automated way.

iron(my.list$waffle.1, my.list#waffle.2, etc) works, but I have no success in 1) inputting a list of waffle plots to iron() or 2) hacking it, through unlist() or by generating a character-version of the comma-delimited list.

Any ideas? Thank you!

Extra blocks when DF has less than three columns

Hello, thank you so much for writing this package. I feel like I'm running into an issue though. When plotting data frames with less than three columns the chart seems to be adding extra blocks. I tried setting keep to false but nothing changed. Does the parts argument need to be a vector for this to work properly? Thanks!

image

image

image

image

Issue with specific glyph

So, 15 days ago I was using the cran version of waffle and ran a piece of code to generate this plot:
image

However, when I run it now, using GitHub's version, this is what I get:
image

When I tried to revert back to cran's version, the problem continued.

And it's weird because it only happens if I use the glyph "child". If I use "user", or "male" or "female", it works fine:

image

When I checked the code, it seems to be running normally:

Code using "child" as glyph:
image

Code using "user" as glyph:
image

You can see the problem when using the example from hrbrmstr/waffle main page:

library("extrafont")
library("waffle")
packageVersion("extrafont")
packageVersion("waffle")


parts <- c(`Un-breached\nUS Population` = (318 - 11 - 79), `Premera` = 11, `Anthem` = 79)

# THIS WORKS
waffle(
  parts / 10, rows = 3, colors = c("#969696", "#1879bf", "#009bda"),
  use_glyph = "medkit", size = 8
)

# THIS DOESN'T
waffle(
  parts / 10, rows = 3, colors = c("#969696", "#1879bf", "#009bda"),
  use_glyph = "child", size = 8
)

And this is the console:

> library("extrafont")
> library("waffle")
> packageVersion("extrafont")
[1] ‘0.17’
> packageVersion("waffle")
[1] ‘0.9.1’
> parts <- c(`Un-breached\nUS Population` = (318 - 11 - 79), `Premera` = 11, `Anthem` = 79)
> 
> # THIS WORKS
> waffle(
+   parts / 10, rows = 3, colors = c("#969696", "#1879bf", "#009bda"),
+   use_glyph = "medkit", size = 8
+ )
Warning message:
Removed 3 rows containing missing values (geom_text). 
> 
> # THIS DOESN'T
> waffle(
+   parts / 10, rows = 3, colors = c("#969696", "#1879bf", "#009bda"),
+   use_glyph = "child", size = 8
+ )
Warning message:
Removed 3 rows containing missing values (geom_text). 
>

Does anyone know why this happens?

Thanks!

Waffle creates legend but not actual waffle chart

I'm encountering an error where waffle creates the legend of my waffle chart but not the actual chart itself. This occurs irrespective of graphics device. An example: https://imgur.com/a/nYJqcm9

Here's my R version info in case that is helpful.

arch           x86_64                      
os             mingw32                     
system         x86_64, mingw32             
status                                     
major          3                           
minor          5.1                         
year           2018                        
month          07                          
day            02                          
svn rev        74947                       
language       R                           
version.string R version 3.5.1 (2018-07-02)
nickname       Feather Spray               

edit: this happens whether I install from CRAN or GitHub

as_rcdimple with new glyph feature

I have a new version of as_rcdimple that handles the new structure when using glyphs. Since rcdimple is not on CRAN, it should of course not be in the CRAN version. I'll copy it below in case you are someone else is interested.

as_rcdimple <- function( wf, height = NULL, width = NULL ) {

  # not import since optional dependency
  #  check here to see if rcdimple is available
  if(!requireNamespace("rcdimple", quietly=TRUE)) stop("please devtools::install_github('timelyportfolio/rcdimple')", call. = FALSE)

  # let ggplot2 do the work and build the chart
  gb <- ggplot_build(wf)


  if(length(wf$layers) > 1 && as.list(wf$layers[[3]])$geom_params$family == "FontAwesome" ){
    dimp <- rcdimple::dimple(
      na.omit(
        data.frame(
          group = wf$scales$scales[[1]]$labels[
            match(wf$data$value,unique(wf$data$value))
          ]
          ,gb$data[[1]]
          ,stringsAsFactors = F
        )
      )
      , y~x
      , type = "bar"
      , groups = "group"
      , width = width
      , height = height
      , xAxis = list( type = "addCategoryAxis", title  = "" )
      , yAxis = list( type = "addCategoryAxis", title = "" )
      , defaultColors = unique( na.omit(gb$data[[2]])$colour )
      , title = list( text = wf$labels$title )
      , tasks = list(
        htmlwidgets::JS(
          'function(){
          this.widgetDimple[0].axes.forEach(function(ax){
          ax.shapes.remove()
          })
  }'
          )
      )
      )
    } else {
      dimp <- rcdimple::dimple(
        na.omit(
          data.frame(
            group = wf$scales$scales[[1]]$labels[
              match(wf$data$value,unique(wf$data$value))
              ]
            ,gb$data[[1]]
            ,stringsAsFactors = F
          )
        )
        , y~x
        , type = "bar"
        , groups = "group"
        , width = width
        , height = height
        , xAxis = list( type = "addCategoryAxis", title  = "" )
        , yAxis = list( type = "addCategoryAxis", title = "" )
        , defaultColors = unique( na.omit(gb$data[[1]])$fill )
        , title = list( text = wf$labels$title )
        , tasks = list(
          htmlwidgets::JS(
            'function(){
            this.widgetDimple[0].axes.forEach(function(ax){
              ax.shapes.remove()
            })
          }'
          )
        )
      )
    }
  return(dimp)
}

For the ultimate in compatibility, I might work on getting the fonts in the dimple svg, but that will be down the road.

"panel.spacing" is not a valid theme element name.

I just tried to use your package on Linux (Ubuntu 16.04) and R Version 3.3.2 and unfortunately I got an error while I was trying to plot the waffle plot from the example.

Here is the log of my console, hopefully this can help you to fix it

> library(waffle)
> 
> # current verison
> packageVersion("waffle")
[1] ‘0.7.0> ## [1] '0.7.0'
> 
> # basic example
> parts <- c(80, 30, 20, 10)
> waffle(parts, rows=8)
Error in (function (el, elname)  : 
  "panel.spacing" is not a valid theme element name.

Let me know if you need further informations or probably know the reason for this error.

Readme shows wrong chart

Under "Keeps factor by default levels now", the second chart shows 100% thing1. It seems like it should show 100% thing2, just like the chart immediately above. That's what is in the data.

wrong architecture detection?

Hi,
While I am trying to install this package from git I get the following error

√  checking for file 'C:\Users\hoja4090\AppData\Local\Temp\RtmpUHZDmJ\filebf0683c345f/DESCRIPTION' ...
-  preparing 'waffle': (459ms)
√  checking DESCRIPTION meta-information ... 
-  checking for LF line-endings in source and make files and shell scripts
-  checking for empty or unneeded directories
-  building 'waffle_1.0.1.tar.gz'
   
Installing package into ‘C:/Users/hoja4090/Documents/R/win-library/3.6’
(as ‘lib’ is unspecified)
* installing *source* package 'waffle' ...
** using staged installation
** R
** inst
** byte-compile and prepare package for lazy loading
** help
*** installing help indices
  converting help for package 'waffle'
    finding HTML links ... done
    draw_key_pictogram                      html  
    fa5_brand                               html  
    fa5_solid                               html  
    fa_grep                                 html  
    fa_list                                 html  
    geom_pictogram                          html  
    geom_waffle                             html  
    install_fa_fonts                        html  
    iron                                    html  
    scale_label_pictogram                   html  
    theme_enhance_waffle                    html  
    waffle-package                          html  
    waffle                                  html  
** building package indices
** installing vignettes
** testing if installed package can be loaded from temporary location
*** arch - i386
Error: package or namespace load failed for 'ggplot2' in library.dynam(lib, package, package.lib):
 DLL 'lazyeval' not found: maybe not installed for this architecture?
Error : package 'ggplot2' could not be loaded
Error: loading failed
Execution halted
*** arch - x64
ERROR: loading failed for 'i386'

It seems it is detecting wrong architecture for setup, I have have ggplot2 installed on R.

Size legends to equal tiles

This is purely aesthetics, but it would be nice to have an option to make the tile size match the legend colour block size. Is this possible at the moment without manually fiddling with the export size?

3rd color in 2 part waffles?!

When I create a waffle with only two parts, ie parts=c(10,12), the plot forces a 3rd color to exist to completely fill the grid, why would it do this??

"FontAwesome" font family not found

When I try to use use_glyph, I get the following warnings (one warning for each of the glyphs that should have been plotted):

In grid.Call.graphics(C_text, as.graphicsAnnot(x$label), ... : no font could be found for family "FontAwesome"

How I got here:

  1. I downloaded the free .zip from https://use.fontawesome.com/releases/v5.1.1/fontawesome-free-5.1.1-web.zip and installed all of the .ttf files in the webfonts folder.

  2. I installed waffle (waffle_0.7.0) and extrafont (extrafont_0.17) and loaded them both in my session.

  3. I ran font_import(), which returned some warnings:

5: In grepl("^FamilyName", text) : input string 4 is invalid in this locale
6: In grepl("^FontName", text) : input string 4 is invalid in this locale
7: In grepl("^FullName", text) : input string 4 is invalid in this locale
8: In grepl("^Weight", text) : input string 4 is invalid in this locale
  1. I ran loadfonts().

  2. Running fonts() lists "Font Awesome 5 Brands" and "Font Awesome 5 Free"

  3. Running fa_list() shows a character vector of length 593

  4. Whenever I use the use_glyphs argument using any of those characters in the aforementioned vector, I get the warnings:

In grid.Call.graphics(C_text, as.graphicsAnnot(x$label), ... : no font could be found for family "FontAwesome"

And what appears is just a dot where the glyphs should be.

I'm on R 3.5.0 in RStudio on macOS High Sierra 10.13.5.

colors are not continuous.

Hi, When the are several categories, the little squares loss their color continuity, hindering the analyze step, the code is:

library(RColorBrewer)
library(waffle)
cl <- colors(distinct = TRUE)
set.seed(15887) # to set random generator seed
kolor <- sample(cl, 25)

waffle(c("organophosphate catabolic process"=8,"transition metal ion transport"=7,"multi-organism cellular process"=6,"growth"=6,"cellular biogenic amine biosynthetic process"=6,"protein maturation"=6,"indole-containing compound metabolic process"=6,"reactive oxygen species metabolic process"=5,"pyrimidine nucleobase metabolic process"=5,"carbohydrate phosphorylation"=4,"negative regulation of hydrolase activity"=4,"carbohydrate derivative transport"=4,"glutamate metabolic process"=4,"indole-containing compound biosynthetic process"=3,"protein oligomerization"=3,"regulation of cellular component movement"=3,"organophosphate ester transport"=3,"(obsolete) ATP catabolic process"=3,"response to acid chemical"=2,"hydrogen peroxide metabolic process"=2,"lipid oxidation"=2,"glycosyl compound catabolic process"=2,"positive regulation of translation"=2,"protein autophosphorylation"=2,"dicarboxylic acid transport"=2), 
       title = "Biological Proccess",
       colors = kolor

is there an solution ?, I attach the pdf
regards

biologicalP.pdf
)

Increase size of legend

Sorry to bother you,

Is it possible to increase the size of legend and xlab ?

best,
Liviu

Recommend Projects

  • React photo React

    A declarative, efficient, and flexible JavaScript library for building user interfaces.

  • Vue.js photo Vue.js

    🖖 Vue.js is a progressive, incrementally-adoptable JavaScript framework for building UI on the web.

  • Typescript photo Typescript

    TypeScript is a superset of JavaScript that compiles to clean JavaScript output.

  • TensorFlow photo TensorFlow

    An Open Source Machine Learning Framework for Everyone

  • Django photo Django

    The Web framework for perfectionists with deadlines.

  • D3 photo D3

    Bring data to life with SVG, Canvas and HTML. 📊📈🎉

Recommend Topics

  • javascript

    JavaScript (JS) is a lightweight interpreted programming language with first-class functions.

  • web

    Some thing interesting about web. New door for the world.

  • server

    A server is a program made to process requests and deliver data to clients.

  • Machine learning

    Machine learning is a way of modeling and interpreting data that allows a piece of software to respond intelligently.

  • Game

    Some thing interesting about game, make everyone happy.

Recommend Org

  • Facebook photo Facebook

    We are working to build community through open source technology. NB: members must have two-factor auth.

  • Microsoft photo Microsoft

    Open source projects and samples from Microsoft.

  • Google photo Google

    Google ❤️ Open Source for everyone.

  • D3 photo D3

    Data-Driven Documents codes.