Git Product home page Git Product logo

puncover's Introduction

puncover

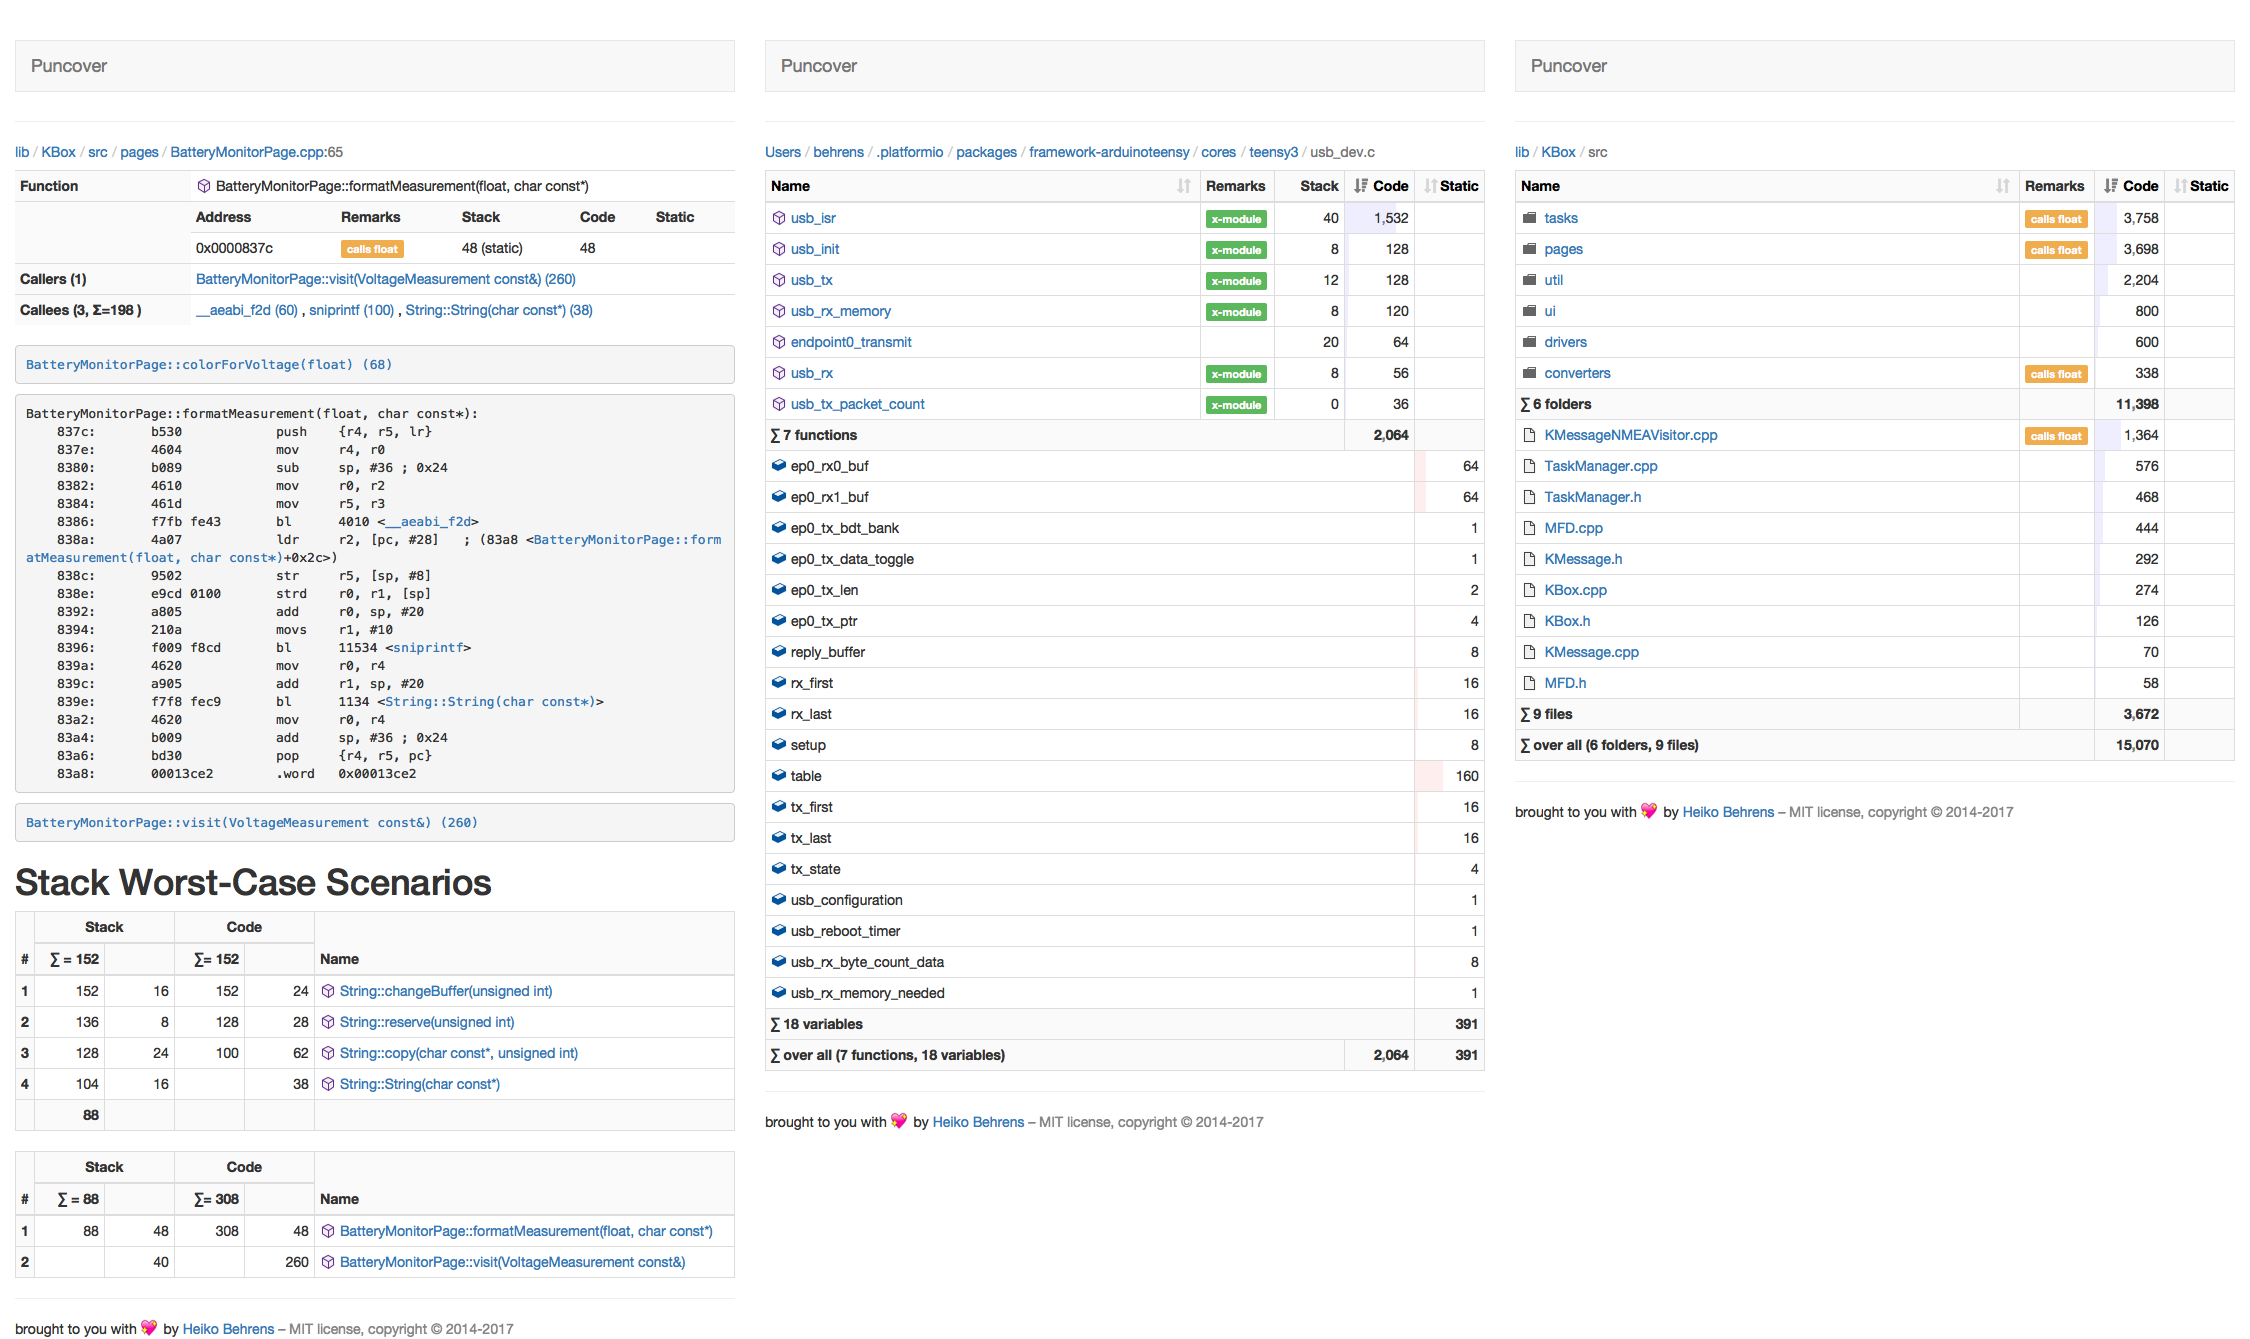
Analyzes C/C++ binaries for code size, static variables and stack usages. It creates a report with disassembler and call-stack analysis per directory, file, or function.

Installation and Usage

Install with pip:

pip install puncover

Run it by passing the binary to analyze:

puncover --elf_file project.elf
...
* Running on http://127.0.0.1:5000/ (Press CTRL+C to quit)

Open the link in your browser to view the analysis.

Running Tests Locally

Setup

To run the tests locally, you need to install the development dependencies:

  1. install pyenv: https://github.com/pyenv/pyenv

    curl https://pyenv.run | bash
  2. install all the python environments, using this bashism (this can take a few minutes):

    for _py in $(<.python-version ); do pyenv install ${_py}; done
  3. install the development dependencies:

    pip install -r requirements-dev.txt

Running Tests

Then you can run the tests with:

tox

or, to target only the current python on $PATH:

tox -e py

Publishing Release

Release Script

See release.sh for a script that automates the above steps. This example will work with the PyPi tokens (now required):

PUNCOVER_VERSION=0.3.5 TWINE_PASSWORD="<pypi token>" TWINE_USERNAME=__token__ ./release.sh

Manual Steps

Only for reference, the release script should take care of all of this.

Click to expand
  1. Update the version in puncover/__version__.py.

  2. Commit the version update:

    git add . && git commit -m "Bump version to x.y.z"
  3. Create an annotated tag:

    git tag -a {-m=,}x.y.z
  4. Push the commit and tag:

    git push && git push --tags
  5. Either wait for the GitHub Action to complete and download the release artifact for uploading: https://github.com/HBehrens/puncover/actions OR Build the package locally: python setup.py sdist bdist_wheel

  6. Upload the package to PyPI:

    twine upload dist/*
  7. Create GitHub releases:

    • gh release create --generate-notes x.y.z
    • attach the artifacts to the release too: gh release upload x.y.z dist/*

Contributing

Contributions are welcome! Please open an issue or pull request on GitHub.

puncover's People

Contributors

adleris avatar hbehrens avatar lykkeberg avatar maximevince avatar mayl avatar mjessome avatar noahp avatar sarfata avatar vchavezb avatar

Stargazers

 avatar  avatar  avatar  avatar  avatar  avatar  avatar  avatar  avatar  avatar  avatar  avatar  avatar  avatar  avatar  avatar  avatar  avatar  avatar  avatar  avatar  avatar  avatar  avatar  avatar  avatar  avatar  avatar  avatar  avatar  avatar  avatar  avatar  avatar  avatar  avatar  avatar  avatar  avatar  avatar  avatar  avatar  avatar  avatar  avatar  avatar  avatar  avatar  avatar  avatar  avatar  avatar  avatar  avatar  avatar  avatar  avatar  avatar  avatar  avatar  avatar  avatar  avatar  avatar  avatar  avatar  avatar  avatar  avatar  avatar  avatar  avatar  avatar  avatar  avatar  avatar  avatar  avatar  avatar  avatar  avatar  avatar  avatar  avatar  avatar  avatar  avatar  avatar  avatar  avatar  avatar  avatar  avatar  avatar  avatar  avatar  avatar  avatar  avatar  avatar

Watchers

 avatar  avatar  avatar  avatar  avatar  avatar  avatar  avatar  avatar  avatar  avatar  avatar  avatar  avatar  avatar  avatar  avatar

puncover's Issues

Review pinned dependency versions in `requirements.txt`

It may not be necessary to strictly pin them; we could loosen to only specify minor or major version.

Or we could switch to poetry so the test requirements would stay pinned and similarly loosen the install requirements.

Support Xtensa assembly

Collector.enhance_call_tree_from_assembly_line looks into specific ARM instructions to identify calls. This needs to be broadened to support Xtensa.

Also, it seems as if it's a common pattern for GCC to do relative calls where possible, https://gcc.gnu.org/onlinedocs/gcc/Xtensa-Options.html leading to two instructions and objdump doesn't desymbolize this (unlike ARM's relative jumps), so that it's necessary to analyze two instructions to derive a call:

jump (on instruction) followed by a call (two instructions)

40204418:	42cc      	bnez.n	a2, 40204420 <umm_info+0x20>
4020441a:	fff501        	l32r	a0, 402043f0 <__umoddi3+0x38c>
4020441d:	0000c0        	callx0	a0

Also, see #7

Stack usage not displayed correctly due to basefile not being parsed in files with extension .su

I was testing the stack usage feature of puncover but found out there is a bug in the code.

I enabled stack usage in the GCC compiler (-fstack-usage) but I was not getting any info on the puncover website. After debugging I noticed that the function parse_stack_usage_line does not parse correctly the so-called base_file_name

This is important because when you are adding the stack usage it compares the base_file_name that was added previously when looking for symbols... i.e., with arm-none-eabi-nm -Sl YOUR_ELF_FILE.elf. Specifically here

sym[BASE_FILE] = os.path.basename(file)

Therefore parse_stack_usage_line should also extract the base file name.

My suggestion:

  def parse_stack_usage_line(self, line):
       match = self.parse_stack_usage_line_pattern.match(line)
       if not match:
           return False

       file_name = match.group(1)
       base_file_name = os.path.basename(file_name)
       line = int(match.group(3))
       symbol_name = match.group(5)
       stack_size = int(match.group(6))
       stack_qualifier = match.group(7)

       return self.add_stack_usage(base_file_name, line, symbol_name, stack_size, stack_qualifier)

Crash during call tree enhancement "Exception has occured: KeyError 'callers'"

I have downloaded the Puncover tool (thanks for a great tool btw). I ran it on my code, which is running on a ARM Cortex M0 with som ROM code being called. This seems to cause this issue.

When parsing the "nm" output, the Puncover stumbles on an absolute address definition:
Example (there are several):
07f1d989 A __eaabi_uidivmod
...

These absolute values are actually entries into a ROM code section, so they are actually getting called from the application.

How can this be handled correctly in Puncover? I have made a quick-fix in Collector.py::parse_size_lines() method. Simply just add an entry in 'types' for the 'A' type as a TYPE_FUNCTION.

The commit ID is 9eaabf8

Improve C++ support

Would be nice to do some processing on C++ symbol names to make them look better.

This is what things look like right now with C++ (SDFat library):
screenshot from 2016-10-27 08 45 42

Very little output on unusual elf file

Got an elf file that was built for arm under windows with a proprietary compiler. I get very little information displayed from puncover. The paths do not work at all, possibly because of windows using backslashes etc. ?

Additionally I get the following error from nm and objdump hundreds of times for varying offsets:

DWARF error: could not find variable specification at offset 0xae4bc1

What does that mean exactly? Would it be necessary for the compiler to do something special? I would be mostly interested in the stack usage, but that info isn't there...

Provide way to structure projects by components

While many projects choose to map their logical components to their source folder hierarchy there are exceptions and cases where you want to provide an independent, hierarchical perspective. You also might want to look at cross-cutting aspects.
By describing a hierarchy of named nodes with a set of include/exclude file patterns and include/exclude symbol patterns per node you should be able to resolve this. There is the need of multiple of such hierarchies.

Similar to today's ability to browser the folder hierarchy you will be able to look at all the children of a node + an implicit "other" for all the unmatched symbols captured by the node itself.

Show assembly and source side-by-side

objdump -S or -l are a good starting point but aspects such as

  • accuracy of those logs,
  • non-contiguous source inclusion
  • macros and inlined functions
  • content from multiple files

make this nontrivial.

Ship with a set of GCC toolchains.

By leveraging the http://platformio.org toolchains, it is possible to download a set of binaries from multiple GCC toolchains for Ubuntu and macOS. Allowing puncover to probe until it finds a matching toolchain for a given ELF and shipping puncover with a set of these binaries would simplify the first-time experience.

Default port 5000 conflicts with widely used mDNSResponder

Many linuxes and macos has upnp service on port 5000 (mDNSRespnder from Bonjour / Rendezvous).
By default puncover tries to use same port what leads to conflict:

Traceback (most recent call last):
  File "/home/kayo/devel/zephyr/.venv/bin/puncover", line 33, in <module>
    sys.exit(load_entry_point('puncover==0.0.1', 'console_scripts', 'puncover')())
  File "/home/kayo/devel/zephyr/.venv/lib/python3.8/site-packages/puncover/puncover.py", line 65, in main
    app.run(host=args.host, port=args.port)
  File "/home/kayo/devel/zephyr/.venv/lib/python3.8/site-packages/flask/app.py", line 772, in run
    run_simple(host, port, self, **options)
  File "/home/kayo/devel/zephyr/.venv/lib/python3.8/site-packages/werkzeug/serving.py", line 1008, in run_simple
    inner()
  File "/home/kayo/devel/zephyr/.venv/lib/python3.8/site-packages/werkzeug/serving.py", line 948, in inner
    srv = make_server(
  File "/home/kayo/devel/zephyr/.venv/lib/python3.8/site-packages/werkzeug/serving.py", line 795, in make_server
    return BaseWSGIServer(
  File "/home/kayo/devel/zephyr/.venv/lib/python3.8/site-packages/werkzeug/serving.py", line 686, in __init__
    super().__init__(server_address, handler)  # type: ignore
  File "/nix/store/zv167zw7gwr9h0gpkfcikdfqnscrd0q6-python3-3.8.9/lib/python3.8/socketserver.py", line 452, in __init__
    self.server_bind()
  File "/nix/store/zv167zw7gwr9h0gpkfcikdfqnscrd0q6-python3-3.8.9/lib/python3.8/http/server.py", line 138, in server_bind
    socketserver.TCPServer.server_bind(self)
  File "/nix/store/zv167zw7gwr9h0gpkfcikdfqnscrd0q6-python3-3.8.9/lib/python3.8/socketserver.py", line 466, in server_bind
    self.socket.bind(self.server_address)
OSError: [Errno 98] Address already in use

Investigate if pyelftools + capstone can remove dependencies to GCC

Today, developers need to specify the path to the proper GCC toolchain and the code heavily relies on the specific text layout objdump and nm produce. This already breaks on macOS where the default GCC you can download via homebrew doesn't support either of these tools.

Instead of making the parsing more flexible it's worth looking into a solution based on libraries such as

Rust Support

So, I was hesitant about filing this, but on twitter you indicated that you weren't opposed to it.

I have a lot of cases where this would be insanely useful, in particular in size-restricted demos, compression code (in particular, often "ad-hoc" compression like that frequently used for unicode tables), and certain kinds of embedded code. Unfortunately, they're largely in Rust, as that's the language I use most these days.


At first I worried that it would be pretty difficult, but taking a look, a lot of this code is pretty general, so maybe it wouldn't be so bad, so I could probably help, and am completely willing to do the work for it (when I have time, although I do at the moment for a bit).

Some things that I think would be needed having looked at the code. Please correct me if I'm wrong, or with stuff I've inevitably missed.

Does that sound about right to you? Would you be interested in patches for this sort of thing?

Support Worst-Case Stack in symbol listings

Hi! Fantastic tool, thank you so much for your work.

I frequently use Puncover to find the worst case stack usage of a function. It would be exceptionally useful if I could see this information as a column in the symbol list, just like I can see the per-function stack usage.

This would let me easily identify functions in my binary that lead to a ton of stack pressure.

Add output info/files

Add a method to output files and/or info to a folder/files/pdf.
Would be beneficial in a CI job to have this type of analysis be used for diagnostic/historical reason, as well as for CI checks

A way to zip a folder of files, or preferably a PDF, or excel output could let sharing to other teammates a lot easier.

Getting unmangled names fails with path lenght exceeds limit

Running in cmd with Windows 10 and Python 3.8 results in the following error:

puncover --elf-file <some file>
parsing ELF at <some file>
enhancing function sizes
deriving folders
enhancing file elements
enhancing assembly
enhancing call tree
enhancing siblings
unmangling c++ symbols
Traceback (most recent call last):
  File "c:\python38\lib\runpy.py", line 194, in _run_module_as_main
    return _run_code(code, main_globals, None,
  File "c:\python38\lib\runpy.py", line 87, in _run_code
    exec(code, run_globals)
  File "C:\Python38\Scripts\puncover.exe\__main__.py", line 7, in <module>
  File "c:\python38\lib\site-packages\puncover\puncover.py", line 82, in main
    builder.build_if_needed()
  File "c:\python38\lib\site-packages\puncover\builders.py", line 32, in build_if_needed
    self.build()
  File "c:\python38\lib\site-packages\puncover\builders.py", line 23, in build
    self.collector.enhance(self.src_root)
  File "c:\python38\lib\site-packages\puncover\collector.py", line 435, in enhance
    self.unmangle_cpp_names()
  File "c:\python38\lib\site-packages\puncover\collector.py", line 319, in unmangle_cpp_names
    unmangled_names = self.gcc_tools.get_unmangled_names(symbol_names)
  File "c:\python38\lib\site-packages\puncover\gcc_tools.py", line 46, in get_unmangled_names
    lines_list =  [self.gcc_tool_lines('c++filt', c) for c in chunks(symbol_names)]
  File "c:\python38\lib\site-packages\puncover\gcc_tools.py", line 46, in <listcomp>
    lines_list =  [self.gcc_tool_lines('c++filt', c) for c in chunks(symbol_names)]
  File "c:\python38\lib\site-packages\puncover\gcc_tools.py", line 25, in gcc_tool_lines
    proc = subprocess.Popen([self.gcc_tool_path(name)] + args, stdout=subprocess.PIPE, cwd=cwd)
  File "c:\python38\lib\subprocess.py", line 858, in __init__
    self._execute_child(args, executable, preexec_fn, close_fds,
  File "c:\python38\lib\subprocess.py", line 1311, in _execute_child
    hp, ht, pid, tid = _winapi.CreateProcess(executable, args,
FileNotFoundError: [WinError 206] Der Dateiname oder die Erweiterung ist zu lang

Setting the default chunk_size form 1000 to 60 in gcc_tools.py -> get_unmangled_names() solved the issue for me. I do not know the exact limit that Windows enforces. For a permanent fix we could iterate the chunk_size until it fails again. It took me a while to figure out that it was the chunk_size. So we should include that fix so that others don't have to search as long.

Crashes if `arm-none-eabi-objdump` is missing.

Zephyr RTOS assume using it's own SDK with prefix arm-zephyr-eabi- not an arm-none-eabi-.
When I trying run puncover it fails with the following backtrace:

$ .venv/bin/puncover --gcc_tools_base /nix/store/l204mqmlaccq7njix0mxk5y26hvgh6js-zephyr-sdk-0.15.2/zephyr-sdk/arm-zephyr-eabi/bin/arm-zephyr-eabi-
Traceback (most recent call last):
  File ".venv/bin/puncover", line 33, in <module>
    sys.exit(load_entry_point('puncover==0.3.4', 'console_scripts', 'puncover')())
  File ".venv/lib/python3.10/site-packages/puncover/puncover.py", line 55, in main
    gcc_tools_base = os.path.join(find_arm_tools_location(), 'bin/arm-none-eabi-')
  File "/nix/store/5axq6aw8j3vcs2m7gi440cwpcckl7ql9-python3-3.10.9/lib/python3.10/posixpath.py", line 76, in join
    a = os.fspath(a)
TypeError: expected str, bytes or os.PathLike object, not NoneType
def find_arm_tools_location():
    obj_dump = find_executable("arm-none-eabi-objdump") # <--- gives None so function returns None
    return dirname(dirname(obj_dump)) if obj_dump else None

# ...

def main():
    gcc_tools_base = os.path.join(find_arm_tools_location(), 'bin/arm-none-eabi-') # <--- it fails because arg is None
    # ...

Meaning of x-module

I haven't been able to find an answer in the documentation.

What does x-module mean?

Thanks!

Support xc16 (pic) disassembler output

The disassembly generated by the xc16 toolchain (microchip) generates symbols for every label in the source code. For example, this is one function that gets transformed into multiple symbols: SetUsbChannel, .L3, .L4, .L6, .L2.

00007270 <_SetUsbChannel>:
SetUsbChannel():
/project/bootload.X/usb_switch.c:21
    7270:	88 1f 78    	mov.w     w8, [w15++]
    7272:	00 04 78    	mov.w     w0, w8
/project/bootload.X/usb_switch.c:25
    7274:	e1 0f 54    	sub.w     w8, #0x1, [w15]
    7276:	09 00 32    	bra       Z, 0x728a <.L4>
    7278:	03 00 39    	bra       NC, 0x7280 <.L3>
    727a:	e2 0f 54    	sub.w     w8, #0x2, [w15]
    727c:	0f 00 3a    	bra       NZ, 0x729c <.L2>
    727e:	0a 00 37    	bra       0x7294 <.L6>

00007280 <.L3>:
/project/bootload.X/usb_switch.c:28
    7280:	e0 00 20    	mov.w     #0xe, w0
    7282:	a0 ff 07    	rcall     0x71c4 <_output_high> <.LFB8> <.LFE7>
/project/bootload.X/usb_switch.c:29
    7284:	f0 00 20    	mov.w     #0xf, w0
    7286:	a8 ff 07    	rcall     0x71d8 <_output_low> <.LFB9> <.LFE8>
/project/bootload.X/usb_switch.c:30
    7288:	09 00 37    	bra       0x729c <.L2>

0000728a <.L4>:
/project/bootload.X/usb_switch.c:33
    728a:	e0 00 20    	mov.w     #0xe, w0
    728c:	a5 ff 07    	rcall     0x71d8 <_output_low> <.LFB9> <.LFE8>
/project/bootload.X/usb_switch.c:34
    728e:	f0 00 20    	mov.w     #0xf, w0
    7290:	a3 ff 07    	rcall     0x71d8 <_output_low> <.LFB9> <.LFE8>
/project/bootload.X/usb_switch.c:35
    7292:	04 00 37    	bra       0x729c <.L2>

00007294 <.L6>:
/project/bootload.X/usb_switch.c:38
    7294:	e0 00 20    	mov.w     #0xe, w0
    7296:	a0 ff 07    	rcall     0x71d8 <_output_low> <.LFB9> <.LFE8>
/project/bootload.X/usb_switch.c:39
    7298:	f0 00 20    	mov.w     #0xf, w0
    729a:	94 ff 07    	rcall     0x71c4 <_output_high> <.LFB8> <.LFE7>

0000729c <.L2>:
/project/bootload.X/usb_switch.c:43
    729c:	78 43 88    	mov.w     w8, 0x86e
/project/bootload.X/usb_switch.c:44
    729e:	4f 04 78    	mov.w     [--w15], w8
    72a0:	00 00 06    	return

The current result is that for a elf file disassembled with this toolset, 80% of the code size goes in <unknown>/<unknown> and looking at SetUsbChannel only shows the first few lines of the assembly. Callers/Callees counting is also broken (related to #7/#8/#20 probably).

Todo:

  • add some tests parsing this type of output
  • parse assembly all the way til the end of the function (until beginning of the next one is probably the only way to detect the end of one)
  • figure out a way to sum the size of all the symbols that make one function

HTML or PDF report

Is it possible to generate a pdf report or an HTML output instead of having to query the localhost server? I want to integrate it into a CI/CD and getting a report would be nice.

If not, which part of the script should I look into to try to implement this feature?

Error 'no module named collector'

Hi,
Thanks for the great tool. I am having issues making it work. Hope you can help with it

These are the steps I followed

  1. Clone the repo
  2. Cd into the repo and run python setup.py build and python setup.py install
  3. Run the following
    puncover --gcc_tools_base ~/.platformio/packages/toolchain-xtensa --elf /Users/developer/Code/testproject/.pio/build/esp01_1m/firmware.elf --build_dir /Users/developer/Code/testproject/.pio/build --src_root /Users/developer/Code/testproject

I get the following error:
Traceback (most recent call last): File "/usr/local/bin/puncover", line 11, in <module> load_entry_point('puncover==0.0.1', 'console_scripts', 'puncover')() File "/usr/local/lib/python3.7/site-packages/pkg_resources/__init__.py", line 489, in load_entry_point return get_distribution(dist).load_entry_point(group, name) File "/usr/local/lib/python3.7/site-packages/pkg_resources/__init__.py", line 2852, in load_entry_point return ep.load() File "/usr/local/lib/python3.7/site-packages/pkg_resources/__init__.py", line 2443, in load return self.resolve() File "/usr/local/lib/python3.7/site-packages/pkg_resources/__init__.py", line 2449, in resolve module = __import__(self.module_name, fromlist=['__name__'], level=0) File "/usr/local/lib/python3.7/site-packages/puncover-0.0.1-py3.7.egg/puncover/puncover.py", line 8, in <module> from collector import Collector

Overview page / sort by stack usage

Hi, nice tool. Had a could questions/requests:

  1. How do I get to the overview page that you have an example screenshot of? I did not get such overview page running the tool on my source code.

  2. Would it be possible to add sorting option on the "Stack" usage column?

Thanks!

Support C++ backtraces in "Analyze text snippet"

Here's a snippet provided by @sarfata . As you can see, it uses symbol names such as TaskManager::loop or tNMEA2000::ParseMessages:

GNU gdb (GNU Tools for ARM Embedded Processors 6-2017-q1-update) 7.12.1.20170215-git
Copyright (C) 2017 Free Software Foundation, Inc.
License GPLv3+: GNU GPL version 3 or later <http://gnu.org/licenses/gpl.html>
This is free software: you are free to change and redistribute it.
There is NO WARRANTY, to the extent permitted by law.  Type "show copying"
and "show warranty" for details.
This GDB was configured as "--host=x86_64-pc-linux-gnu --target=arm-none-eabi".
Type "show configuration" for configuration details.
For bug reporting instructions, please see:
<http://www.gnu.org/software/gdb/bugs/>.
Find the GDB manual and other documentation resources online at:
<http://www.gnu.org/software/gdb/documentation/>.
For help, type "help".
Type "apropos word" to search for commands related to "word".
warning: No executable has been specified and target does not support
determining executable automatically.  Try using the "file" command.
0x000001bc in ?? ()
MDM: Chip is unsecured. Continuing.
k40.cpu: target state: halted
target halted due to debug-request, current mode: Thread
xPSR: 0x01000000 pc: 0x000001bc msp: 0x20008000
(gdb) load
Loading section .text, size 0x17394 lma 0x0
Loading section .ARM.exidx, size 0x8 lma 0x17394
Loading section .data, size 0x7e8 lma 0x1739c
Start address 0x0, load size 97156
Transfer rate: 14 KB/sec, 12144 bytes/write.
(gdb) c
Continuing.
^C
Program received signal SIGINT, Interrupt.
0x00000ade in RunStat::recordRun (this=this@entry=0x1fffc500, runTimeUs=7) at src/common/os/TaskManager.h:73
73            runCount++;
(gdb) bt
#0  0x00000ade in RunStat::recordRun (this=this@entry=0x1fffc500, runTimeUs=7) at src/common/os/TaskManager.h:73
#1  0x00000c74 in TaskManager::loop (this=0x1fff9060 <taskManager>) at src/common/os/TaskManager.cpp:53
#2  0x000054e4 in main () at /home/thomas/.platformio/packages/framework-arduinoteensy/cores/teensy3/main.cpp:23
(gdb) c
Continuing.
^C
Program received signal SIGINT, Interrupt.
tNMEA2000::Open (this=this@entry=0x1fffa920) at lib/NMEA2000/NMEA2000.cpp:307
307     }
(gdb) bt
#0  tNMEA2000::Open (this=this@entry=0x1fffa920) at lib/NMEA2000/NMEA2000.cpp:307
#1  0x0000cbc6 in tNMEA2000::ParseMessages (this=0x1fffa920) at lib/NMEA2000/NMEA2000.cpp:872
#2  0x00000c5e in TaskManager::loop (this=0x1fff9060 <taskManager>) at src/common/os/TaskManager.cpp:51
#3  0x000054e4 in main () at /home/thomas/.platformio/packages/framework-arduinoteensy/cores/teensy3/main.cpp:23
(gdb) c
Continuing.
^C
Program received signal SIGINT, Interrupt.
0x00000c4a in TaskManager::loop (this=0x1fff9060 <taskManager>) at src/common/os/TaskManager.cpp:49
49          if ((*it)->ready()) {
(gdb) bt
#0  0x00000c4a in TaskManager::loop (this=0x1fff9060 <taskManager>) at src/common/os/TaskManager.cpp:49
#1  0x000054e4 in main () at /home/thomas/.platformio/packages/framework-arduinoteensy/cores/teensy3/main.cpp:23
(gdb) c
Continuing.
^C
Program received signal SIGINT, Interrupt.
0x0000f23c in tNMEA2000_teensy::CANSendFrame (this=0x1fffa920, id=<optimized out>, len=8 '\b', buf=0x1fffc28d "\004", wait_sent=false) at lib/NMEA2000_teensy/NMEA2000_teensy.cpp:46
46        for (int i=0; i<len && i<8; i++) out.buf[i] = buf[i];
(gdb) bt
#0  0x0000f23c in tNMEA2000_teensy::CANSendFrame (this=0x1fffa920, id=<optimized out>, len=8 '\b', buf=0x1fffc28d "\004", wait_sent=false)
    at lib/NMEA2000_teensy/NMEA2000_teensy.cpp:46
#1  0x0000bdc6 in tNMEA2000::SendFrames (this=this@entry=0x1fffa920) at lib/NMEA2000/NMEA2000.cpp:346
#2  0x0000cbd0 in tNMEA2000::ParseMessages (this=0x1fffa920) at lib/NMEA2000/NMEA2000.cpp:874
#3  0x00000c5e in TaskManager::loop (this=0x1fff9060 <taskManager>) at src/common/os/TaskManager.cpp:51
#4  0x000054e4 in main () at /home/thomas/.platformio/packages/framework-arduinoteensy/cores/teensy3/main.cpp:23

be explicit about python3 requirement

#28 changes the code to rely on Python 3. This should be made explicit in places such as

  • readme
  • shebang in runner.py
  • possibly setup.py
  • possibly a .python-version file

use map files instead of output from nm as a source of symbols and sizes

In my project I noted that using the map file generated during the linking is much mode accurate than using output of nm. nm does not provide size of the data placed in .rodata section which does not have own symbol e.g. text strings.

In my case puncover reports the size as ~75KB of code + 11.5KB of static. The size command reports ~125KB.

I'm aware that using map file has some disadvantages (like sometimes only elf file is available) and will require significant changes in the puncover, but I think it is worth to be at least considered.

support X86 assembly

Collector.enhance_call_tree_from_assembly_line looks into specific ARM instructions to identify calls. This needs to be broadened to support X86.

Cannot run python because version conflict

I have clone this project but I cannot run it because some of package is conflicting version. I'm using venv with python3. I didn't see requirement.txt file in the project so I don't know hove to fix it. Please someone give me some advices.

First time use not working

Hi all maybe someone can help me here. I tried to use puncover on a fresh debian 11 installation.
I installed puncover with

apt-get install pip
pip3 install puncover

When I try it with a simple little program, this is what I get (same result when setting --arm_tools_dir or --gcc_tools_base to the appropriate correct subdir (using xPacks arm-none-eabi for bare metal here):

dev@qemuarm:~/project_dir$ puncover --elf_file main.elf
DEPRECATED: argument --arm_tools_dir will be removed, use --gcc_tools_base instead.
parsing ELF at main.elf
Traceback (most recent call last):
File "/usr/local/bin/puncover", line 8, in
sys.exit(main())
File "/usr/local/lib/python3.9/dist-packages/puncover/puncover.py", line 69, in main
builder.build_if_needed()
File "/usr/local/lib/python3.9/dist-packages/puncover/builders.py", line 32, in build_if_needed
self.build()
File "/usr/local/lib/python3.9/dist-packages/puncover/builders.py", line 22, in build
self.collector.parse_elf(self.get_elf_path())
File "/usr/local/lib/python3.9/dist-packages/puncover/collector.py", line 306, in parse_elf
self.parse_assembly_text("".join(self.gcc_tools.get_assembly_lines(elf_file)))
File "/usr/local/lib/python3.9/dist-packages/puncover/gcc_tools.py", line 28, in get_assembly_lines
return self.gcc_tool_lines('objdump', ['-dslw', os.path.basename(elf_file)], os.path.dirname(elf_file))
File "/usr/local/lib/python3.9/dist-packages/puncover/gcc_tools.py", line 24, in gcc_tool_lines
proc = subprocess.Popen([self.gcc_tool_path(name)] + args, stdout=subprocess.PIPE, cwd=cwd)
File "/usr/lib/python3.9/subprocess.py", line 951, in init
self._execute_child(args, executable, preexec_fn, close_fds,
File "/usr/lib/python3.9/subprocess.py", line 1823, in _execute_child
raise child_exception_type(errno_num, err_msg, err_filename)
FileNotFoundError: [Errno 2] No such file or directory: ''

I am not a python expert. But searching around in the code a little makes me feel that the subprocess.Popen interface has changed and the "objcopy" executable parameter is not forwarded into this call??? I also have added some prints to gcc_tools.py and the subprocces call that is built up there can be executed on the command line without any problems...

Hope someone can help me with this

Didi

Downloading the entire site for viewing later or sending

Heiko, Thanks a lot for the wonderful tool. Would it be possible to save the entire website a particular build ?
Asking this for 1. sharing with anyone else 2. viewing later 3. comparing with build with another configuration.

Support memory map

Many ELFs separate their sections into logical groups such as RAM, internal flash, external flash, etc. As the sections coming from readelf are not carrying enough and at the same time can be too detailed, a simple description file seems to be a good way to help puncover to provide more insights (e.g. "all const variables in internal flash" vs. "all variables in external RAM".

Make reference detection in assembly view generic

Today's parsing step of assembly and the approach described in #7 and #8 make it difficult for puncover to support new instruction sets. Instead of looking at the actual opcodes it might be sufficient to only look at the symbols referred to although this could lead to false positives.

Slow analyzing large elf files (parallelize?)

I find that puncover is really slow analyzing my elf files, significantly slower than e.g. bloaty. Is there any way to speed up the analysis? E.g. can it run the objdump in parallel?

Windows compatibility (.exe ARM tools)

I managed to build and install puncover on my Windows 10 machine.
When I try to run it, I get the following error :

parsing ELF at firmware.elf Traceback (most recent call last): File "C:\Python\Python37-32\Scripts\puncover-script.py", line 11, in <module> load_entry_point('puncover==0.0.1', 'console_scripts', 'puncover')() File "C:\Python\Python37-32\lib\site-packages\puncover-0.0.1-py3.7.egg\puncover\puncover.py", line 58, in main builder.build_if_needed() File "C:\Python\Python37-32\lib\site-packages\puncover-0.0.1-py3.7.egg\puncover\builders.py", line 32, in build_if_needed self.build() File "C:\Python\Python37-32\lib\site-packages\puncover-0.0.1-py3.7.egg\puncover\builders.py", line 22, in build self.collector.parse_elf(self.get_elf_path()) File "C:\Python\Python37-32\lib\site-packages\puncover-0.0.1-py3.7.egg\puncover\collector.py", line 306, in parse_elf self.parse_assembly_text("".join(self.gcc_tools.get_assembly_lines(elf_file))) File "C:\Python\Python37-32\lib\site-packages\puncover-0.0.1-py3.7.egg\puncover\gcc_tools.py", line 27, in get_assembly_lines return self.gcc_tool_lines('objdump', ['-dslw', os.path.basename(elf_file)], os.path.dirname(elf_file)) File "C:\Python\Python37-32\lib\site-packages\puncover-0.0.1-py3.7.egg\puncover\gcc_tools.py", line 23, in gcc_tool_lines proc = subprocess.Popen([self.gcc_tool_path(name)] + args, stdout=subprocess.PIPE, cwd=cwd) File "C:\Python\Python37-32\lib\site-packages\puncover-0.0.1-py3.7.egg\puncover\gcc_tools.py", line 18, in gcc_tool_path raise Exception("Could not find %s" % path) Exception: Could not find C:\Program Files\...\gcc\arm-none-eabi\bin\objdump

As this is Windows, the objdump tool do exist but as a 'objdump.exe' file, not as 'objdump'.

Would it be possible to check for .exe file and use them for Windows users ?

nothing in stack column

Hi there,
Recently I came across Puncover. It is a very nice and useful tool.
But unfortunately, it doesn’t show me anything in the stack column. Folders are also unknown!
image
So would you please help me with this?

.rodata is not added in code size

Hi,

Using arm-none-eabi-size I'm getting the code size of a random file containning .rodata

arm-none-eabi-size "autogen/sl_iostream_init_eusart_instances.o" -A
autogen/sl_iostream_init_eusart_instances.o  :
section                                            size   addr
.text                                                 0      0
.data                                                 0      0
.bss                                                  0      0
.rodata.sl_iostream_eusart_init_vcom.str1.1          47      0
.text.sl_iostream_eusart_init_vcom                  176      0
.text.events_handler                                 24      0
.text.sl_iostream_eusart_init_instances              28      0
.text.EUART0_RX_IRQHandler                           12      0
.text.EUART0_TX_IRQHandler                            4      0
.text.sl_iostream_eusart_vcom_sleep_on_isr_exit      12      0
.rodata.str1.1                                        5      0
.rodata                                              32      0
.bss.context_vcom                                   112      0
.bss.events_handle                                    8      0
.bss.rx_buffer_vcom                                  32      0
.bss.sl_iostream_vcom                                36      0
.data.events_info                                     8      0
.data.sl_iostream_instance_vcom_info                 16      0
.data.sl_iostream_uart_vcom_handle                    4      0
.data.sl_iostream_vcom_handle                         4      0
(...)
arm-none-eabi-size "autogen/sl_iostream_init_eusart_instances.o"
   text    data     bss     dec     hex filename
    340      32     188     560     230 autogen/sl_iostream_init_eusart_instances.o

Using puncover I have this values :

image

Here is the source file if needed :
sl_iostream_init_eusart_instances.zip

For bss and static : the value seems to be correct.
But for .text I've a gap of 80.
I think .rodata is not taken into account in the calculation.

Please can you check this ?
Morever what about .data section ?

BR

Kasimashi

empty info when opening web window

I run it on x86_64 in virtualbox, but it shows empty. Don't know what's wrong.

gcc and other tools are located /usr/bin, so I have to use --gcc-tools-base , or error will be reported:

Unable to find gcc tools base dir (tried searching for 'arm-none-eabi-objdump' on PATH), please specify --gcc-tools-base

puncover --gcc-tools-base /usr/bin/ --elf_file a.out

image

Recommend Projects

  • React photo React

    A declarative, efficient, and flexible JavaScript library for building user interfaces.

  • Vue.js photo Vue.js

    🖖 Vue.js is a progressive, incrementally-adoptable JavaScript framework for building UI on the web.

  • Typescript photo Typescript

    TypeScript is a superset of JavaScript that compiles to clean JavaScript output.

  • TensorFlow photo TensorFlow

    An Open Source Machine Learning Framework for Everyone

  • Django photo Django

    The Web framework for perfectionists with deadlines.

  • D3 photo D3

    Bring data to life with SVG, Canvas and HTML. 📊📈🎉

Recommend Topics

  • javascript

    JavaScript (JS) is a lightweight interpreted programming language with first-class functions.

  • web

    Some thing interesting about web. New door for the world.

  • server

    A server is a program made to process requests and deliver data to clients.

  • Machine learning

    Machine learning is a way of modeling and interpreting data that allows a piece of software to respond intelligently.

  • Game

    Some thing interesting about game, make everyone happy.

Recommend Org

  • Facebook photo Facebook

    We are working to build community through open source technology. NB: members must have two-factor auth.

  • Microsoft photo Microsoft

    Open source projects and samples from Microsoft.

  • Google photo Google

    Google ❤️ Open Source for everyone.

  • D3 photo D3

    Data-Driven Documents codes.