Git Product home page Git Product logo

grafana-treemap-panel's Introduction

Treemap for Grafana

Build Release Marketplace Downloads License

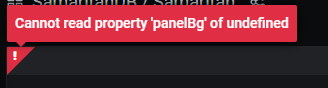
Maintenance: Now the plugin is being maintained by Grafana Labs. Big thanks to Marcus Olsson for the awesome work!

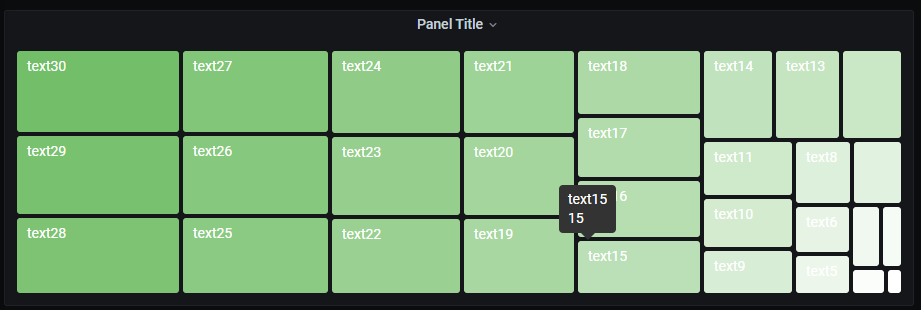
A panel plugin for Grafana to visualize tree maps.

Screenshot

Configuration

This section lists the available configuration options for the Treemap panel.

Panel options

Dimensions

The dimension options determines what fields to use for each dimension of the visualization.

Option Description
Label by Field to use for the text label. Defaults to the first textual field. All values must be unique.
Size by Field to use for size. Defaults to the first numeric field.
Color by Field to use for color. Defaults to the first numeric field.
Group by Field to group by.
Additional labels Fields to use as labels in the tooltip.

Display

Option Description
Tiling algorithm Determines where to make each split.

Field options

Option Description
Separator Set this value to a non-empty string to create a hierarchy as defined by the path defined by the separator.

grafana-treemap-panel's People

Contributors

darrenjaneczek avatar dependabot[bot] avatar gguillotte-grafana avatar marcusolsson avatar tolzhabayev avatar yesoreyeram avatar

Stargazers

 avatar  avatar  avatar  avatar  avatar  avatar  avatar  avatar  avatar  avatar  avatar  avatar  avatar  avatar  avatar  avatar  avatar  avatar  avatar  avatar  avatar  avatar  avatar  avatar  avatar  avatar  avatar  avatar  avatar  avatar  avatar  avatar

Watchers

 avatar  avatar  avatar  avatar  avatar  avatar  avatar  avatar  avatar

grafana-treemap-panel's Issues

tiles do not respect field override value mappings

I'm trying to use field overrides to make my treemap more human-friendly, and I'm getting inconsistent results.

For demo purposes I made two field overrides, with one value mapping in each. The mapping just adds a ! suffix to make it clear when the override is being respected:

image

I also added those fields to the tooltip:
image

When rendering the labels for each tile, the override is not respected:

image

I expected to see kube-system! and coredns! there.

However, the tooltip does show the expected value mappings:

image

Looking briefly at the code, I think the difference is in <TreemapPanel>. It calls a display() function for the tooltip:

https://github.com/grafana/grafana-treemap-panel/blob/main/src/TreemapPanel.tsx#L101

but not for the node name:

https://github.com/grafana/grafana-treemap-panel/blob/main/src/TreemapPanel.tsx#L133

Key Value
Panel marcusolsson-treemap-panel @ 9.3.2-45041 (07be773161)
Grafana 9.3.2-45041 (07be773161) // Pro
Panel debug snapshot dashboard
{
  "panels": [
    {
      "id": 2,
      "gridPos": {
        "h": 13,
        "w": 15,
        "x": 0,
        "y": 0
      },
      "type": "marcusolsson-treemap-panel",
      "title": "Reproduced with embedded data",
      "datasource": {
        "type": "grafana",
        "uid": "grafana"
      },
      "description": "overrides value mappings are not respected",
      "fieldConfig": {
        "defaults": {
          "mappings": [],
          "thresholds": {
            "mode": "absolute",
            "steps": [
              {
                "color": "green",
                "value": null
              },
              {
                "color": "red",
                "value": 80
              }
            ]
          },
          "color": {
            "mode": "thresholds"
          }
        },
        "overrides": [
          {
            "matcher": {
              "id": "byName",
              "options": "namespace"
            },
            "properties": [
              {
                "id": "mappings",
                "value": [
                  {
                    "type": "value",
                    "options": {
                      "kube-system": {
                        "text": "kube-system!",
                        "index": 0
                      }
                    }
                  }
                ]
              }
            ]
          },
          {
            "matcher": {
              "id": "byName",
              "options": "deployment"
            },
            "properties": [
              {
                "id": "mappings",
                "value": [
                  {
                    "type": "value",
                    "options": {
                      "coredns": {
                        "text": "coredns!",
                        "index": 0
                      }
                    }
                  }
                ]
              }
            ]
          }
        ]
      },
      "options": {
        "tiling": "treemapSquarify",
        "colorByField": "Value",
        "groupByField": "namespace",
        "labelFields": [
          "namespace",
          "deployment"
        ],
        "sizeField": "Value",
        "textField": "deployment"
      },
      "targets": [
        {
          "refId": "A",
          "datasource": {
            "type": "grafana",
            "uid": "grafana"
          },
          "queryType": "snapshot",
          "snapshot": [
            {
              "schema": {
                "refId": "A",
                "meta": {
                  "type": "timeseries-many",
                  "custom": {
                    "resultType": "matrix"
                  },
                  "executedQueryString": "Expr: sum by (namespace, deployment) (kube_deployment_spec_replicas{namespace!=\"nalb-cp\"})\nStep: 1m0s",
                  "preferredVisualisationType": "table"
                },
                "fields": [
                  {
                    "name": "Time",
                    "type": "time",
                    "config": {}
                  },
                  {
                    "name": "deployment",
                    "config": {
                      "filterable": true
                    },
                    "type": "string"
                  },
                  {
                    "name": "namespace",
                    "config": {
                      "filterable": true
                    },
                    "type": "string"
                  },
                  {
                    "name": "Value",
                    "type": "number",
                    "config": {}
                  }
                ]
              },
              "data": {
                "values": [
                  [
                    1671032640000,
                    1671032700000,
                    1671032760000,
                    1671032820000,
                    1671032880000,
                    1671032940000,
                    1671032640000,
                    1671032700000,
                    1671032760000,
                    1671032820000,
                    1671032880000,
                    1671032940000,
                    1671032640000,
                    1671032700000,
                    1671032760000,
                    1671032820000,
                    1671032880000,
                    1671032940000,
                    1671032640000,
                    1671032700000,
                    1671032760000,
                    1671032820000,
                    1671032880000,
                    1671032940000,
                    1671032640000,
                    1671032700000,
                    1671032760000,
                    1671032820000,
                    1671032880000,
                    1671032940000,
                    1671032640000,
                    1671032700000,
                    1671032760000,
                    1671032820000,
                    1671032880000,
                    1671032940000,
                    1671032640000,
                    1671032700000,
                    1671032760000,
                    1671032820000,
                    1671032880000,
                    1671032940000,
                    1671032640000,
                    1671032700000,
                    1671032760000,
                    1671032820000,
                    1671032880000,
                    1671032940000,
                    1671032640000,
                    1671032700000,
                    1671032760000,
                    1671032820000,
                    1671032880000,
                    1671032940000,
                    1671032640000,
                    1671032700000,
                    1671032760000,
                    1671032820000,
                    1671032880000,
                    1671032940000,
                    1671032640000,
                    1671032700000,
                    1671032760000,
                    1671032820000,
                    1671032880000,
                    1671032940000,
                    1671032640000,
                    1671032700000,
                    1671032760000,
                    1671032820000,
                    1671032880000,
                    1671032940000,
                    1671032640000,
                    1671032700000,
                    1671032760000,
                    1671032820000,
                    1671032880000,
                    1671032940000,
                    1671032640000,
                    1671032700000,
                    1671032760000,
                    1671032820000,
                    1671032880000,
                    1671032940000,
                    1671032640000,
                    1671032700000,
                    1671032760000,
                    1671032820000,
                    1671032880000,
                    1671032940000,
                    1671032640000,
                    1671032700000,
                    1671032760000,
                    1671032820000,
                    1671032880000,
                    1671032940000,
                    1671032640000,
                    1671032700000,
                    1671032760000,
                    1671032820000,
                    1671032880000,
                    1671032940000,
                    1671032640000,
                    1671032700000,
                    1671032760000,
                    1671032820000,
                    1671032880000,
                    1671032940000
                  ],
                  [
                    "aad-pod-identity-mic",
                    "aad-pod-identity-mic",
                    "aad-pod-identity-mic",
                    "aad-pod-identity-mic",
                    "aad-pod-identity-mic",
                    "aad-pod-identity-mic",
                    "cert-manager",
                    "cert-manager",
                    "cert-manager",
                    "cert-manager",
                    "cert-manager",
                    "cert-manager",
                    "cert-manager-cainjector",
                    "cert-manager-cainjector",
                    "cert-manager-cainjector",
                    "cert-manager-cainjector",
                    "cert-manager-cainjector",
                    "cert-manager-cainjector",
                    "cert-manager-webhook",
                    "cert-manager-webhook",
                    "cert-manager-webhook",
                    "cert-manager-webhook",
                    "cert-manager-webhook",
                    "cert-manager-webhook",
                    "coredns",
                    "coredns",
                    "coredns",
                    "coredns",
                    "coredns",
                    "coredns",
                    "coredns-autoscaler",
                    "coredns-autoscaler",
                    "coredns-autoscaler",
                    "coredns-autoscaler",
                    "coredns-autoscaler",
                    "coredns-autoscaler",
                    "grafana-agent-traces",
                    "grafana-agent-traces",
                    "grafana-agent-traces",
                    "grafana-agent-traces",
                    "grafana-agent-traces",
                    "grafana-agent-traces",
                    "helm-controller",
                    "helm-controller",
                    "helm-controller",
                    "helm-controller",
                    "helm-controller",
                    "helm-controller",
                    "image-automation-controller",
                    "image-automation-controller",
                    "image-automation-controller",
                    "image-automation-controller",
                    "image-automation-controller",
                    "image-automation-controller",
                    "image-reflector-controller",
                    "image-reflector-controller",
                    "image-reflector-controller",
                    "image-reflector-controller",
                    "image-reflector-controller",
                    "image-reflector-controller",
                    "ingress-nginx-controller",
                    "ingress-nginx-controller",
                    "ingress-nginx-controller",
                    "ingress-nginx-controller",
                    "ingress-nginx-controller",
                    "ingress-nginx-controller",
                    "konnectivity-agent",
                    "konnectivity-agent",
                    "konnectivity-agent",
                    "konnectivity-agent",
                    "konnectivity-agent",
                    "konnectivity-agent",
                    "kustomize-controller",
                    "kustomize-controller",
                    "kustomize-controller",
                    "kustomize-controller",
                    "kustomize-controller",
                    "kustomize-controller",
                    "metrics-server",
                    "metrics-server",
                    "metrics-server",
                    "metrics-server",
                    "metrics-server",
                    "metrics-server",
                    "monitoring-kube-prometheus-operator",
                    "monitoring-kube-prometheus-operator",
                    "monitoring-kube-prometheus-operator",
                    "monitoring-kube-prometheus-operator",
                    "monitoring-kube-prometheus-operator",
                    "monitoring-kube-prometheus-operator",
                    "monitoring-kube-prometheus-stack-kube-state-metrics",
                    "monitoring-kube-prometheus-stack-kube-state-metrics",
                    "monitoring-kube-prometheus-stack-kube-state-metrics",
                    "monitoring-kube-prometheus-stack-kube-state-metrics",
                    "monitoring-kube-prometheus-stack-kube-state-metrics",
                    "monitoring-kube-prometheus-stack-kube-state-metrics",
                    "notification-controller",
                    "notification-controller",
                    "notification-controller",
                    "notification-controller",
                    "notification-controller",
                    "notification-controller",
                    "source-controller",
                    "source-controller",
                    "source-controller",
                    "source-controller",
                    "source-controller",
                    "source-controller"
                  ],
                  [
                    "aad-pod-identity",
                    "aad-pod-identity",
                    "aad-pod-identity",
                    "aad-pod-identity",
                    "aad-pod-identity",
                    "aad-pod-identity",
                    "cert-manager",
                    "cert-manager",
                    "cert-manager",
                    "cert-manager",
                    "cert-manager",
                    "cert-manager",
                    "cert-manager",
                    "cert-manager",
                    "cert-manager",
                    "cert-manager",
                    "cert-manager",
                    "cert-manager",
                    "cert-manager",
                    "cert-manager",
                    "cert-manager",
                    "cert-manager",
                    "cert-manager",
                    "cert-manager",
                    "kube-system",
                    "kube-system",
                    "kube-system",
                    "kube-system",
                    "kube-system",
                    "kube-system",
                    "kube-system",
                    "kube-system",
                    "kube-system",
                    "kube-system",
                    "kube-system",
                    "kube-system",
                    "monitoring",
                    "monitoring",
                    "monitoring",
                    "monitoring",
                    "monitoring",
                    "monitoring",
                    "flux-system",
                    "flux-system",
                    "flux-system",
                    "flux-system",
                    "flux-system",
                    "flux-system",
                    "flux-system",
                    "flux-system",
                    "flux-system",
                    "flux-system",
                    "flux-system",
                    "flux-system",
                    "flux-system",
                    "flux-system",
                    "flux-system",
                    "flux-system",
                    "flux-system",
                    "flux-system",
                    "ingress-nginx",
                    "ingress-nginx",
                    "ingress-nginx",
                    "ingress-nginx",
                    "ingress-nginx",
                    "ingress-nginx",
                    "kube-system",
                    "kube-system",
                    "kube-system",
                    "kube-system",
                    "kube-system",
                    "kube-system",
                    "flux-system",
                    "flux-system",
                    "flux-system",
                    "flux-system",
                    "flux-system",
                    "flux-system",
                    "kube-system",
                    "kube-system",
                    "kube-system",
                    "kube-system",
                    "kube-system",
                    "kube-system",
                    "monitoring",
                    "monitoring",
                    "monitoring",
                    "monitoring",
                    "monitoring",
                    "monitoring",
                    "monitoring",
                    "monitoring",
                    "monitoring",
                    "monitoring",
                    "monitoring",
                    "monitoring",
                    "flux-system",
                    "flux-system",
                    "flux-system",
                    "flux-system",
                    "flux-system",
                    "flux-system",
                    "flux-system",
                    "flux-system",
                    "flux-system",
                    "flux-system",
                    "flux-system",
                    "flux-system"
                  ],
                  [
                    21,
                    21,
                    21,
                    21,
                    21,
                    21,
                    11,
                    11,
                    11,
                    11,
                    11,
                    11,
                    11,
                    11,
                    11,
                    11,
                    11,
                    11,
                    11,
                    11,
                    11,
                    11,
                    11,
                    11,
                    22,
                    22,
                    22,
                    22,
                    22,
                    22,
                    11,
                    11,
                    11,
                    11,
                    11,
                    11,
                    11,
                    11,
                    11,
                    11,
                    11,
                    11,
                    11,
                    11,
                    11,
                    11,
                    11,
                    11,
                    11,
                    11,
                    11,
                    11,
                    11,
                    11,
                    11,
                    11,
                    11,
                    11,
                    11,
                    11,
                    21,
                    21,
                    21,
                    21,
                    21,
                    21,
                    22,
                    22,
                    22,
                    22,
                    22,
                    22,
                    11,
                    11,
                    11,
                    11,
                    11,
                    11,
                    22,
                    22,
                    22,
                    22,
                    22,
                    22,
                    11,
                    11,
                    11,
                    11,
                    11,
                    11,
                    11,
                    11,
                    11,
                    11,
                    11,
                    11,
                    11,
                    11,
                    11,
                    11,
                    11,
                    11,
                    11,
                    11,
                    11,
                    11,
                    11,
                    11
                  ]
                ]
              }
            }
          ]
        }
      ]
    },
    {
      "gridPos": {
        "h": 7,
        "w": 9,
        "x": 15,
        "y": 0
      },
      "id": 5,
      "options": {
        "content": "<table width=\"100%\">\n    <tr>\n      <th width=\"2%\">Panel</th>\n      <td >marcusolsson-treemap-panel @ 9.3.2-45041 (07be773161)</td>\n    </tr>\n    <tr>\n      <th>Queries</th>\n      <td>A[prometheus]</td>\n    </tr>\n    \n    <tr><th>Data</th><td> 1 frames, 4 fields, 108 rows </td></tr>\n    \n    <tr>\n      <th>Grafana</th>\n      <td>9.3.2-45041 (07be773161) // Pro</td>\n    </tr>\n  </table>",
        "mode": "html"
      },
      "title": "Debug info",
      "type": "text"
    },
    {
      "id": 6,
      "title": "Original Panel JSON",
      "type": "text",
      "gridPos": {
        "h": 13,
        "w": 9,
        "x": 15,
        "y": 7
      },
      "options": {
        "content": "{\n  \"id\": 96,\n  \"gridPos\": {\n    \"h\": 8,\n    \"w\": 24,\n    \"x\": 0,\n    \"y\": 47\n  },\n  \"type\": \"marcusolsson-treemap-panel\",\n  \"title\": \"Treemap override demo\",\n  \"datasource\": {\n    \"uid\": \"grafanacloud-prom\",\n    \"type\": \"prometheus\"\n  },\n  \"description\": \"overrides value mappings are not respected\",\n  \"fieldConfig\": {\n    \"defaults\": {\n      \"mappings\": [],\n      \"thresholds\": {\n        \"mode\": \"absolute\",\n        \"steps\": [\n          {\n            \"color\": \"green\",\n            \"value\": null\n          },\n          {\n            \"color\": \"red\",\n            \"value\": 80\n          }\n        ]\n      },\n      \"color\": {\n        \"mode\": \"thresholds\"\n      }\n    },\n    \"overrides\": [\n      {\n        \"matcher\": {\n          \"id\": \"byName\",\n          \"options\": \"namespace\"\n        },\n        \"properties\": [\n          {\n            \"id\": \"mappings\",\n            \"value\": [\n              {\n                \"type\": \"value\",\n                \"options\": {\n                  \"kube-system\": {\n                    \"text\": \"kube-system!\",\n                    \"index\": 0\n                  }\n                }\n              }\n            ]\n          }\n        ]\n      },\n      {\n        \"matcher\": {\n          \"id\": \"byName\",\n          \"options\": \"deployment\"\n        },\n        \"properties\": [\n          {\n            \"id\": \"mappings\",\n            \"value\": [\n              {\n                \"type\": \"value\",\n                \"options\": {\n                  \"coredns\": {\n                    \"text\": \"coredns!\",\n                    \"index\": 0\n                  }\n                }\n              }\n            ]\n          }\n        ]\n      }\n    ]\n  },\n  \"options\": {\n    \"tiling\": \"treemapSquarify\",\n    \"colorByField\": \"Value\",\n    \"groupByField\": \"namespace\",\n    \"labelFields\": [\n      \"namespace\",\n      \"deployment\"\n    ],\n    \"sizeField\": \"Value\",\n    \"textField\": \"deployment\"\n  },\n  \"targets\": [\n    {\n      \"datasource\": {\n        \"type\": \"prometheus\",\n        \"uid\": \"grafanacloud-prom\"\n      },\n      \"editorMode\": \"code\",\n      \"expr\": \"sum by (namespace, deployment) (kube_deployment_spec_replicas{namespace!=\\\"nalb-cp\\\"})\",\n      \"format\": \"table\",\n      \"legendFormat\": \"__auto\",\n      \"range\": true,\n      \"refId\": \"A\"\n    }\n  ]\n}",
        "mode": "code",
        "code": {
          "language": "json",
          "showLineNumbers": true,
          "showMiniMap": true
        }
      }
    },
    {
      "id": 3,
      "title": "Data from panel above",
      "type": "table",
      "datasource": {
        "type": "datasource",
        "uid": "-- Dashboard --"
      },
      "gridPos": {
        "h": 7,
        "w": 15,
        "x": 0,
        "y": 13
      },
      "options": {
        "showTypeIcons": true
      },
      "targets": [
        {
          "datasource": {
            "type": "datasource",
            "uid": "-- Dashboard --"
          },
          "panelId": 2,
          "withTransforms": true,
          "refId": "A"
        }
      ]
    }
  ],
  "schemaVersion": 37,
  "title": "Debug: Treemap override demo // 2022-12-14 15:50:02",
  "tags": [
    "debug",
    "debug-marcusolsson-treemap-panel"
  ],
  "time": {
    "from": "2022-12-14T15:45:02.104Z",
    "to": "2022-12-14T15:50:02.104Z"
  }
}

Feature Request: Percentages

Discussed in #27

Originally posted by gg-g October 4, 2021
Thanks for the plug-in - totally use it.

I wonder if it is worth adding options to show values as percentages in the tile (see 1 in attached picture) and/or in the hover info (2).

percentages

Value mappings

Would it be possible to set value mappings to be displayed in the panel ?

This will avoid many queries updates / data modification.
Anyway having this type of panel is amazing !
Thanks

elasticsearch tips:"A number field"

this is my mapping

{ "test.first" : { "mappings" : { "properties" : { "age" : { "type" : "long" }, "birth" : { "type" : "date" }, "married" : { "type" : "boolean" }, "uid" : { "type" : "text", "fields" : { "keyword" : { "type" : "keyword", "ignore_above" : 256 } } }, "username" : { "type" : "text", "fields" : { "keyword" : { "type" : "keyword", "ignore_above" : 256 } } } } } } }

Allow color spectrum selection

It seems the only color assignment available is white->green. This doesn't look great, especially when combined with white text.

Setting the color to use the text field doesn't work (it claims the text is "ambiguous").

minimum size for small values

Small values completely disappear on the treemap. It would be great if there was an option to keep everything visible, ie enforce a minimum size for each tile.

Define positions of sub-treemaps within the whole treemap visualization

I have a treemap chart which is divided into three sub-groups ("Group by"). The sizes of the squares refer to percent values, so they add up to 100 in each of the sub-treemaps.

Since the size of all sub-treemaps is identical, they are positioned arbitrarily within the whole treemap chart. As a result, they often swap positions after reloading the dashboard, which is confusing for the user.

grafik
Next time:
grafik

I tried to establish a fixed order of the sub-charts by ordering the underlying data. The following order by clause in the SQL query allows ordering categorical data in a determined way:

ORDER BY (
        CASE WHEN category ='system1' THEN 1
             WHEN category ='system5' THEN 2
             WHEN category ='system2' THEN 3
             ELSE 4
        END
    )

This, indeed, orders the data table as expected, but the sub-treemaps are still randomly distributed.

I would love to have the possibility to define the position of the sub-treemaps in the whole treemap. I think this would also be beneficial in case the sub-treemaps have different sizes to get an individual design of the whole treemap.

Plugin doesnt see Tile label

Grafana v7.4.3, MySQL DataSource.
I made simple test select, like this: select dat.time, dat.metric, dat.value from (select now() as "time", "fgf" as "metric", 31300 as "value") as dat
but plugin doesnt see label field.
See the picture:
image

Treemap visible only to authenticated users

Hello, I used your plugin to create a treemap, but only the authenticated users are able to visualize it.

I'd like to build a dashboard available to guest (e.g. not authenticated) users.

Not authenticated users get a "Error loading: marcusolsson-treemap-panel" in the panel, while other plugins show correctly their data.

I'm using Grafana 7.4.3 on Ubuntu 20.04.

Thanks.

Error

Error seen when trying to use treemap plugin with docker image grafana:latest

Reproduction Steps:

  • Use grafana base image grafana/grafana:latest
  • Install grafana-treemap-panal
    ** RUN grafana-cli plugins install marcusolsson-treemap-panel
    ** - GF_INSTALL_PLUGINS: marcusolsson-treemap-panel
  • Configure a data source
    EXPECTED: Tree Map renders. Functions as expected in grafana/grafana:7.2.2
    image
    ACTUAL: An error is seen in the treemap panal. Broken in grafana/grafana:7.3.0
    image
    image

Data links don't work in the Treemap panel

What happened vs what I expected/hoped for:

The panel has data-links defined:
image

And these work fine when the panel type is "Table":
image

But not when the panel-type is Treemap:
image

As far as I can tell, the "Data links" text in that popover is just hard-coded text, and a placeholder for this feature to be implemented.

Panel Help bug report

I gathered the below bug-report data using the New panel help option

Key Value
Panel marcusolsson-treemap-panel @ 9.4.0-42921pre
Grafana 9.4.0-42921pre (d5274dfdda) // Enterprise
Panel debug snapshot dashboard
{
  "panels": [
    {
      "id": 2,
      "gridPos": {
        "h": 13,
        "w": 15,
        "x": 0,
        "y": 0
      },
      "type": "marcusolsson-treemap-panel",
      "title": "Reproduced with embedded data",
      "datasource": {
        "type": "grafana",
        "uid": "grafana"
      },
      "pluginVersion": "9.4.0-42921pre",
      "description": "Shows the labels attached to metric ${metric}. You see both the label name and then the number of values for each label name. Label names are sorted by the number of values they have in descending order.",
      "fieldConfig": {
        "defaults": {
          "mappings": [],
          "thresholds": {
            "mode": "absolute",
            "steps": [
              {
                "color": "green",
                "value": null
              },
              {
                "color": "red",
                "value": 80
              }
            ]
          },
          "color": {
            "mode": "fixed"
          }
        },
        "overrides": [
          {
            "matcher": {
              "id": "byName",
              "options": "Label"
            },
            "properties": [
              {
                "id": "links",
                "value": [
                  {
                    "title": "View detailed cardinality dashboard for label: ${__data.fields.Label}",
                    "url": "d/cardinality-management-label-detail/?var-label=${__data.fields.Label}&${datasource:queryparam}&${filter:queryparam}"
                  }
                ]
              }
            ]
          }
        ]
      },
      "targets": [
        {
          "refId": "A",
          "datasource": {
            "type": "grafana",
            "uid": "grafana"
          },
          "queryType": "snapshot",
          "snapshot": [
            {
              "schema": {
                "refId": "A",
                "fields": [
                  {
                    "name": "frvue",
                    "type": "string",
                    "config": {
                      "displayName": "Label"
                    }
                  },
                  {
                    "name": "cjjhr",
                    "type": "number",
                    "config": {
                      "displayName": "Number of values"
                    }
                  },
                  {
                    "name": "qhjktsvc",
                    "type": "other",
                    "config": {
                      "displayName": "Example label values"
                    }
                  }
                ]
              },
              "data": {
                "values": [
                  [
                    "ijlac",
                    "gf",
                    "zfgpms_aklwsnv",
                    "ahucyfqh",
                    "dyj",
                    "__sjir__"
                  ],
                  [
                    22,
                    12,
                    7,
                    7,
                    7,
                    1
                  ],
                  [
                    [
                      "Amsterdam",
                      "Atlanta",
                      "Dallas"
                    ],
                    [
                      "+Inf",
                      "0.005",
                      "0.01"
                    ],
                    [
                      "1646328570523959552",
                      "1646328570551495168",
                      "1646328570558905600"
                    ],
                    [
                      "giraffe-reader.com",
                      "grafana.com",
                      "https://giraffe-reader.com"
                    ],
                    [
                      "Giraffe Reader http",
                      "Giraffe Reader ping",
                      "Giraffe Reader staging site http"
                    ],
                    [
                      "probe_all_duration_seconds_bucket"
                    ]
                  ]
                ]
              }
            }
          ]
        }
      ],
      "options": {
        "tiling": "treemapSquarify"
      }
    },
    {
      "gridPos": {
        "h": 7,
        "w": 9,
        "x": 15,
        "y": 0
      },
      "id": 5,
      "options": {
        "content": "<table width=\"100%\">\n    <tr>\n      <th width=\"2%\">Panel</th>\n      <td >marcusolsson-treemap-panel @ 9.4.0-42921pre</td>\n    </tr>\n    <tr>\n      <th>Queries</th>\n      <td>A[undefined]</td>\n    </tr>\n    \n    <tr><th>Data</th><td> 1 frames, 3 fields, 6 rows </td></tr>\n    \n    <tr>\n      <th>Grafana</th>\n      <td>9.4.0-42921pre (d5274dfdda) // Enterprise</td>\n    </tr>\n  </table>",
        "mode": "html"
      },
      "title": "Debug info",
      "type": "text"
    },
    {
      "id": 6,
      "title": "Original Panel JSON",
      "type": "text",
      "gridPos": {
        "h": 13,
        "w": 9,
        "x": 15,
        "y": 7
      },
      "options": {
        "content": "{\n  \"id\": 21,\n  \"gridPos\": {\n    \"h\": 9,\n    \"w\": 24,\n    \"x\": 0,\n    \"y\": 12\n  },\n  \"type\": \"marcusolsson-treemap-panel\",\n  \"title\": \"Labels attached to metric ${metric}\",\n  \"datasource\": {\n    \"uid\": \"${cardinality}\"\n  },\n  \"pluginVersion\": \"9.4.0-42921pre\",\n  \"description\": \"Shows the labels attached to metric ${metric}. You see both the label name and then the number of values for each label name. Label names are sorted by the number of values they have in descending order.\",\n  \"fieldConfig\": {\n    \"defaults\": {\n      \"mappings\": [],\n      \"thresholds\": {\n        \"mode\": \"absolute\",\n        \"steps\": [\n          {\n            \"color\": \"green\",\n            \"value\": null\n          },\n          {\n            \"color\": \"red\",\n            \"value\": 80\n          }\n        ]\n      },\n      \"color\": {\n        \"mode\": \"fixed\"\n      }\n    },\n    \"overrides\": [\n      {\n        \"matcher\": {\n          \"id\": \"byName\",\n          \"options\": \"Label\"\n        },\n        \"properties\": [\n          {\n            \"id\": \"links\",\n            \"value\": [\n              {\n                \"title\": \"View detailed cardinality dashboard for label: ${__data.fields.Label}\",\n                \"url\": \"d/cardinality-management-label-detail/?var-label=${__data.fields.Label}&${datasource:queryparam}&${filter:queryparam}\"\n              }\n            ]\n          }\n        ]\n      }\n    ]\n  },\n  \"targets\": [\n    {\n      \"cardinalityType\": \"metrics\",\n      \"exampleCount\": \"3\",\n      \"parameterList\": [\n        \"${metric}\"\n      ],\n      \"refId\": \"A\",\n      \"resultType\": \"details\",\n      \"targetDatasource\": \"${datasource}\",\n      \"datasource\": {\n        \"uid\": \"${cardinality}\"\n      },\n      \"selector\": \"\"\n    }\n  ],\n  \"options\": {\n    \"tiling\": \"treemapSquarify\"\n  }\n}",
        "mode": "code",
        "code": {
          "language": "json",
          "showLineNumbers": true,
          "showMiniMap": true
        }
      }
    },
    {
      "id": 3,
      "title": "Data from panel above",
      "type": "table",
      "datasource": {
        "type": "datasource",
        "uid": "-- Dashboard --"
      },
      "gridPos": {
        "h": 7,
        "w": 15,
        "x": 0,
        "y": 13
      },
      "options": {
        "showTypeIcons": true
      },
      "targets": [
        {
          "datasource": {
            "type": "datasource",
            "uid": "-- Dashboard --"
          },
          "panelId": 2,
          "withTransforms": true,
          "refId": "A"
        }
      ]
    }
  ],
  "schemaVersion": 37,
  "title": "Debug: Labels attached to metric ${metric} // 2022-11-30 14:58:51",
  "tags": [
    "debug",
    "debug-marcusolsson-treemap-panel"
  ],
  "time": {
    "from": "2022-11-29T14:58:51.110Z",
    "to": "2022-11-30T14:58:51.110Z"
  }
}

Size and colour by different values

Thanks for nice plugin.
We have an issue when trying to configure size of rectangles and colour by different values. Whan value is the same all works:
image
For different values it breaks:
image

Hierarchical grouping of data

Hello, I've imported little amout of stats from elasticsearch into grafana and chose this plugin to draw a treemap panel.

Grafana version: 7.0.6
Treemap plugin version: 0.2.0
Display: Squarify
Dimensions:

  • Text: asset
  • Size: size
  • Color: _index

It performs as below:
image

Expected result: The 'Engine/' tier will include its subdirectories instead of taking a bulk standing alone.

Just like the visualization of the treemap lib in echarts.
Is there anything wrong with my settings or it's just an uncompleted function of treemap plugin?

My stats in elasticsearch:

{
  "_index" : "game-resource-pirates-1",
  "_type" : "_doc",
  "_id" : "1",
  "_version" : 8,
  "_seq_no" : 17,
  "_primary_term" : 3,
  "found" : true,
  "_source" : {
    "asset" : "Engine/Content/xxx/1.uasset",
    "offset" : 0,
    "size" : 413,
    "sha1" : "154E806131D7C77245C00088593979C510407E7C",
    "@timestamp" : "2020-08-12T10:06:56Z"
  }
}
{
  "_index" : "game-resource-pirates-1",
  "_type" : "_doc",
  "_id" : "2",
  "_version" : 4,
  "_seq_no" : 18,
  "_primary_term" : 3,
  "found" : true,
  "_source" : {
    "asset" : "Engine/Content/yyy/2.uasset",
    "offset" : 486,
    "size" : 435,
    "sha1" : "DB784BF38D47A6EFDA1E131064D45065584EA8A5",
    "@timestamp" : "2020-08-12T10:06:59Z"
  }
}
{
  "_index" : "game-resource-pirates-1",
  "_type" : "_doc",
  "_id" : "3",
  "_version" : 4,
  "_seq_no" : 19,
  "_primary_term" : 3,
  "found" : true,
  "_source" : {
    "asset" : "Engine/Content/zzz/3.uasset",
    "offset" : 994,
    "size" : 443,
    "sha1" : "F4BD3E99142AF63A07A871562070F09130B93CC3",
    "@timestamp" : "2020-08-12T10:07:04Z"
  }
}
{
  "_index" : "game-resource-pirates-1",
  "_type" : "_doc",
  "_id" : "5",
  "_version" : 3,
  "_seq_no" : 20,
  "_primary_term" : 3,
  "found" : true,
  "_source" : {
    "@timestamp" : "2020-08-12T10:07:08Z",
    "asset" : "Engine/Content/xyz/5.uasset",
    "offset" : 71302,
    "size" : 1048,
    "sha1" : "253084F0D6206E5DCE7540E06A156BB740187A13"
  }
}
{
  "_index" : "game-resource-pirates-1",
  "_type" : "_doc",
  "_id" : "6",
  "_version" : 2,
  "_seq_no" : 21,
  "_primary_term" : 3,
  "found" : true,
  "_source" : {
    "@timestamp" : "2020-08-12T10:07:08Z",
    "asset" : "Engine/",
    "offset" : 87054,
    "size" : 2339,
    "sha1" : "BEC945B4758C4D2E57CDBEF6FF12D205A4014A1E"
  }
}

My query in grafana:
image

Display total on first level cell's tooltip

Thanks for this amazing plugin !
The first level cell's tooltip just display the label and the second level cell's tooltip display label: value by default as linked on the capture.
I couldn't find a way to add the total beside renaming the value with the correct syntax which isn't preferable, thanks by advance I hope you had a nice holyday!
treemap_tooltip

Recommend Projects

  • React photo React

    A declarative, efficient, and flexible JavaScript library for building user interfaces.

  • Vue.js photo Vue.js

    ๐Ÿ–– Vue.js is a progressive, incrementally-adoptable JavaScript framework for building UI on the web.

  • Typescript photo Typescript

    TypeScript is a superset of JavaScript that compiles to clean JavaScript output.

  • TensorFlow photo TensorFlow

    An Open Source Machine Learning Framework for Everyone

  • Django photo Django

    The Web framework for perfectionists with deadlines.

  • D3 photo D3

    Bring data to life with SVG, Canvas and HTML. ๐Ÿ“Š๐Ÿ“ˆ๐ŸŽ‰

Recommend Topics

  • javascript

    JavaScript (JS) is a lightweight interpreted programming language with first-class functions.

  • web

    Some thing interesting about web. New door for the world.

  • server

    A server is a program made to process requests and deliver data to clients.

  • Machine learning

    Machine learning is a way of modeling and interpreting data that allows a piece of software to respond intelligently.

  • Game

    Some thing interesting about game, make everyone happy.

Recommend Org

  • Facebook photo Facebook

    We are working to build community through open source technology. NB: members must have two-factor auth.

  • Microsoft photo Microsoft

    Open source projects and samples from Microsoft.

  • Google photo Google

    Google โค๏ธ Open Source for everyone.

  • D3 photo D3

    Data-Driven Documents codes.