Comments (15)
 marcusolsson
commented on June 5, 2024
1
marcusolsson
commented on June 5, 2024
1
This is definitely something that the plugin should support.
I did a proof-of-concept on this a while back, but unfortunately got stuck and decided to spend time on easier wins for a while. But I'd like to revisit this again at some point.
One of the thing I believe I couldn't decide on was how you'd actually configure it. For example, would you want to configure a field that would define the parent for each row, or would you rather select fields that you'd like to group by?
from grafana-treemap-panel.
 MaxMcGlinnPoole
commented on June 5, 2024
1
MaxMcGlinnPoole
commented on June 5, 2024
1
Yeah a field defining the parent for each row would be the best for my use case. Kinda like the sunburst viz: https://github.com/Dikshita25/sunburst-grafana-plugin
Its a very important feature for our use case. We’re using another plugin in the mean time to visualize our data but we like this plugin a lot more. If you have time to get to this it would be greatly appreciated.
Thanks so much!
…Sent from my iPhone
On May 5, 2021, at 10:58 AM, Marcus Olsson ***@***.***> wrote:
This is definitely something that the plugin should support.
I did a proof-of-concept on this a while back, but unfortunately got stuck and decided to spend time on easier wins for a while. But I'd like to revisit this again at some point.
One of the thing I believe I couldn't decide on was how you'd actually configure it. For example, would you want to configure a field that would define the parent for each row, or would you rather select fields that you'd like to group by?
—
You are receiving this because you commented.
Reply to this email directly, view it on GitHub, or unsubscribe.
from grafana-treemap-panel.
MaxMcGlinnPoole
commented on June 5, 2024
1
My thought is that if the parent value is different than the sum of its children, then the parent value should override the sum of the children. As you say, you can make that configurable later and before making that configurable users do have a work around. They can just format their data differently so that the parent value is equal to the sum of its child value. In the other approach (overriding parent value for sum of children) there isn’t really a workaround to that if a user wants the parent value to override the sum of its children.
… On May 14, 2021, at 2:21 AM, Marcus Olsson ***@***.***> wrote:
I’d expect a way to look at values at different parts of the tree.
I think this would be a good feature to have, though I think it should be out of scope for now. I think we can scope this feature request down to a static presentation of hierarchical data, and add a "drill-down" feature as a follow-up.
I have values for my parent that are almost equal to the sum of the children but aren’t exactly the same.
This is more of the problem I've having right now. In the case where the sum of the children doesn't equal the value of the parent. Should one override the other? We can always make this configurable, but I'd like to find a good default for now.
—
You are receiving this because you commented.
Reply to this email directly, view it on GitHub <#5 (comment)>, or unsubscribe <https://github.com/notifications/unsubscribe-auth/AE4ZBWPGPUXTTAXUA7ETEJ3TNTTQDANCNFSM4QESM66Q>.
from grafana-treemap-panel.
marcusolsson
commented on June 5, 2024
Thank you for taking the time to report this! This is indeed a limitation of the current treemap: It only supports one level. The underlying function from the D3 library supports this so it should be straightforward to add.
I assume this would require adding a parent field to the query that specifies which box to add it under.
from grafana-treemap-panel.
 Void9711
commented on June 5, 2024
Void9711
commented on June 5, 2024
Got it. Thanks!
How long could this to be added into treemap plugin and release?
And is it possible to attach a clickable property on each data bulk to provide a partial zoom in/out (locate and focus view on its neighbor, maybe useful in situation which has a large amount of data)?
: )
from grafana-treemap-panel.
marcusolsson
commented on June 5, 2024
I don't know when I can look at this at the moment unfortunately. If anyone wants to contribute this, I'd happily help out!
from grafana-treemap-panel.
 jermudgeon
commented on June 5, 2024
jermudgeon
commented on June 5, 2024
I've been using https://grafana.com/grafana/plugins/digrich-bubblechart-panel/ for a similar purpose when what I really want is a hierarchical squarified treemap. That plugin uses a fairly simple single concatenated field: "root,hierarchy1,hierarchy2,node" for example, allowing arbitrary depths and nesting. Perhaps that would help? Currently when I try to use Group here I get an error.
from grafana-treemap-panel.
MaxMcGlinnPoole
commented on June 5, 2024
+1 to this, this would be an extremely helpful addition. We're looking at using this at my work but the lack of support for hierarchical data is limiting.
from grafana-treemap-panel.
jermudgeon
commented on June 5, 2024
Re: how to configure parent/child relationships, I was picturing something like
https://grafana.com/grafana/plugins/digrich-bubblechart-panel/
Bubble Chart uses a single field with a user-defined separator for (presumably) arbitrary depths of aggregation.
"Level1,Level2",metric,data
"Level 1,Level2,Level3",metric,data
I find that this makes it easy to pass arbitrary depths without having to have a complex graph-assembling data source. I can do the field concatenation in the query (BigQuery, in my case).
from grafana-treemap-panel.
marcusolsson
commented on June 5, 2024
Made some progress on this, but there are still work to be done. Is this what you'd expect from the data in the issue description?
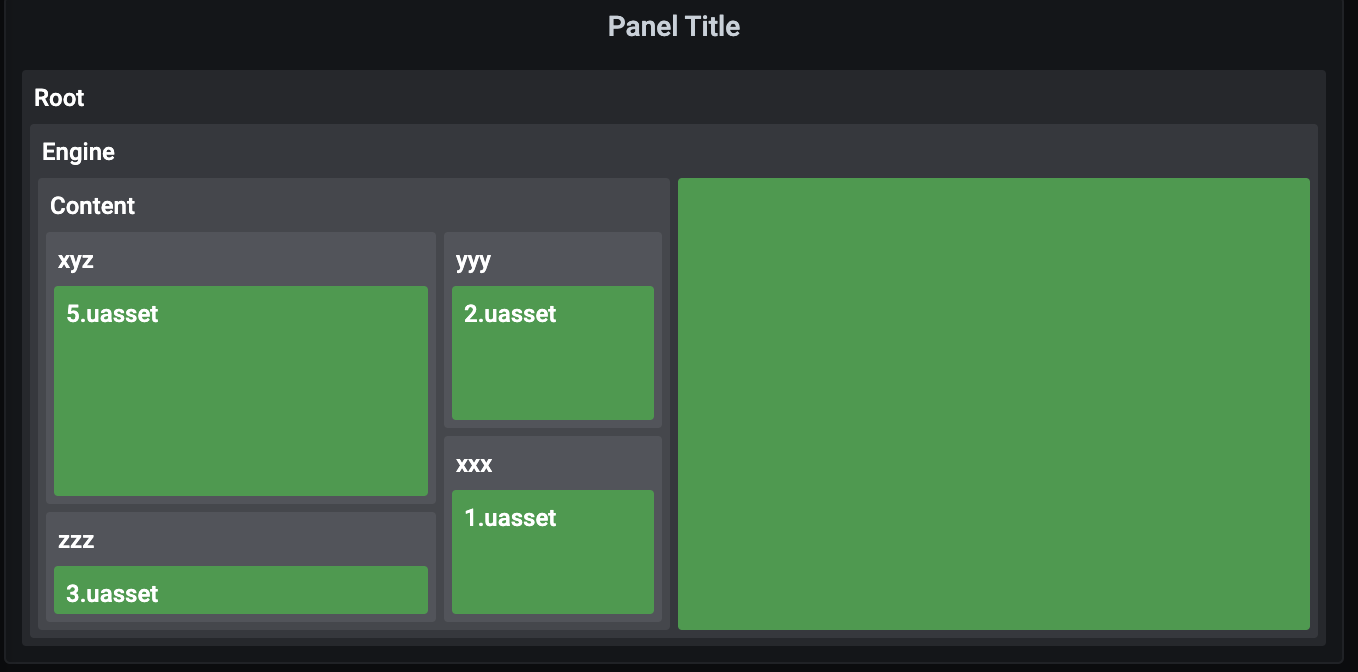
One thing I've run into though: In the example in the issue description, Engine/ has a size even though it's not a leaf node. The way D3.js works is that it sums the value for each node. If the parent has it's own value, it will be added to the sum of all its children, which is probably not what you want in this case.
Those of you who've been using other treemaps, how would you expect this to be handled? Should parent values be ignored instead?
from grafana-treemap-panel.
MaxMcGlinnPoole
commented on June 5, 2024
I’d expect a way to look at values at different parts of the tree. So I’m focusing on the lowest level of my hierarchy I would want parent values to be ignored. If I’m at the next step up the tree I would expect the parent’s child values to be ignored. I have values for my parent that are almost equal to the sum of the children but aren’t exactly the same.
…Sent from my iPhone
On May 12, 2021, at 2:11 PM, Marcus Olsson ***@***.***> wrote:
Made some progress on this, but there are still work to be done. Is this what you'd expect from the data in the issue description?
One thing I've run into though: In the example in the issue description, Engine/ has a size even though it's not a leaf node. The way D3.js works is that it sums the value for each node. If the parent has it's own value, it will be added to the sum of all its children, which is probably not what you want in this case.
Those of you who've been using other treemaps, how would you expect this to be handled? Should parent values be ignored instead?
—
You are receiving this because you commented.
Reply to this email directly, view it on GitHub, or unsubscribe.
from grafana-treemap-panel.
marcusolsson
commented on June 5, 2024
I’d expect a way to look at values at different parts of the tree.
I think this would be a good feature to have, though I think it should be out of scope for now. I think we can scope this feature request down to a static presentation of hierarchical data, and add a "drill-down" feature as a follow-up.
I have values for my parent that are almost equal to the sum of the children but aren’t exactly the same.
This is more of the problem I've having right now. In the case where the sum of the children doesn't equal the value of the parent. Should one override the other? We can always make this configurable, but I'd like to find a good default for now.
from grafana-treemap-panel.
marcusolsson
commented on June 5, 2024
Another status update. I decided to go with configuring by specifying a path in the text dimension with a configurable separator. A couple reasons:
- Using paths keeps reuses the text dimension. An empty separator value recreates the current functionality.
- Users don't have to "engineer" the data source query for the visualization. The hierarchy is configured in the panel rather than in the data.
This solution also continues to work nicely with the Group by dimension. We can discuss adding a Parent dimension in a later pull request, but I think this is a good start. I'll clean this up and hopefully we can release this during the week.
from grafana-treemap-panel.
MaxMcGlinnPoole
commented on June 5, 2024
Great! Thanks for the update
…Sent from my iPhone
On May 17, 2021, at 11:58 AM, Marcus Olsson ***@***.***> wrote:
Another status update. I decided to go with configuring by specifying a path in the text dimension with a configurable separator. A couple reasons:
Using paths keeps reuses the text dimension. An empty separator value recreates the current functionality.
Users don't have to "engineer" the data source query for the visualization. The hierarchy is configured in the panel rather than in the data.
This solution also continues to work nicely with the Group by dimension. We can discuss adding a Parent dimension in a later pull request, but I think this is a good start. I'll clean this up and hopefully we can release this during the week.
—
You are receiving this because you commented.
Reply to this email directly, view it on GitHub, or unsubscribe.
from grafana-treemap-panel.
marcusolsson
commented on June 5, 2024
Available in 0.9.0
from grafana-treemap-panel.
Related Issues (18)
- Allow color spectrum selection HOT 4
- Plugin doesnt see Tile label HOT 2
- Treemap visible only to authenticated users HOT 2
- How to use it with Prometheus?
- Value mappings HOT 1
- Treemap panel not working with Grafana version 8.0.6 HOT 1
- Data link support is broken in Grafana 8.0 HOT 1
- Feature Request: Percentages HOT 1
- Size and colour by different values HOT 2
- Display total on first level cell's tooltip HOT 1
- Data links don't work in the Treemap panel HOT 1
- tiles do not respect field override value mappings HOT 1
- elasticsearch tips:"A number field" HOT 1
- minimum size for small values
- Feature: Font adjustment for long labels
- Define positions of sub-treemaps within the whole treemap visualization
- Error seen when trying to use treemap plugin with docker image grafana:latest HOT 5
Recommend Projects
-
 React
React
A declarative, efficient, and flexible JavaScript library for building user interfaces.
-
Vue.js
🖖 Vue.js is a progressive, incrementally-adoptable JavaScript framework for building UI on the web.
-
 Typescript
TypeScript is a superset of JavaScript that compiles to clean JavaScript output.
-
TensorFlow
An Open Source Machine Learning Framework for Everyone
-
Django
The Web framework for perfectionists with deadlines.
-
 Laravel
A PHP framework for web artisans
-
D3
Bring data to life with SVG, Canvas and HTML. 📊📈🎉
-
Recommend Topics
-
javascript
JavaScript (JS) is a lightweight interpreted programming language with first-class functions.
-
web
Some thing interesting about web. New door for the world.
-
server
A server is a program made to process requests and deliver data to clients.
-
Machine learning
Machine learning is a way of modeling and interpreting data that allows a piece of software to respond intelligently.
-
Visualization
Some thing interesting about visualization, use data art
-
Game
Some thing interesting about game, make everyone happy.
Recommend Org
-
Facebook
We are working to build community through open source technology. NB: members must have two-factor auth.
-
Microsoft
Open source projects and samples from Microsoft.
-
Google
Google ❤️ Open Source for everyone.
-
Alibaba
Alibaba Open Source for everyone
-
D3
Data-Driven Documents codes.
-
Tencent
China tencent open source team.
from grafana-treemap-panel.