By Daniel Himmelstein and Casey Greene
SNP to gene translation is a hallmark of modern bioinformatics. Genomic technologies often produce data on the nucleotide level. Downstream analyses, however, often operate on the gene level. Therefore, condensing nucleotide-level measurements to a gene-based value is a common and essential practice.
Many technologies and applications focus on single nucleotides that vary between individuals, which are called SNPs. Here, we investigate whether the number of SNPs contained by a gene is correlated with other types of gene centric information. Specifically, we evaluate the relationship between SNP abundance and network connectivity for a variety of network types.
When translating measurements from SNP to gene, a skilled bioinformatician will appreciate the correlations uncovered herein. Why? Gene scores from SNP-based experimentation are often analyzed in the context of other gene based information sources. Frequently, such analyses assume independence of the two datasets. However, if the SNP-to-gene conversion is biased by SNP abundance — which generally occurs absent painstaking consideration and adjustment — independence ceases to exist.
SNP abundance: We calculated the number of SNPs per gene for 3 genotyping arrays (Affymetrix 500K Set, Illumina HumanHap550, Illumina HumanOmni1), exome sequencing (ExAC), and whole genome sequencing (1000 Genomes Phase 3). We limited analyses to genes that were consistent between databases and extended each gene boundary by 10,000 basepairs in both directions. The 10,000 basepair window is frequently adopted to capture unmeasured but highly linked SNPs underlying the association and to cover nearby regulatory variants.
Network degree: Hetnets are networks with multiple types of nodes and edges. We extracted gene degrees from hetio-ind, a hetnet developed for drug repurposing. The network contained 26 types of edges (metaedges) that originate with a gene. Thus, for each gene we calculated 26 metaedge-specific degrees.
Transformation: Both SNP abundances and network degrees were transformed by adding 1 and taking the logarithm with base 10. Figure axes report untransformed values, but model fitting occurs on the tranformed data.
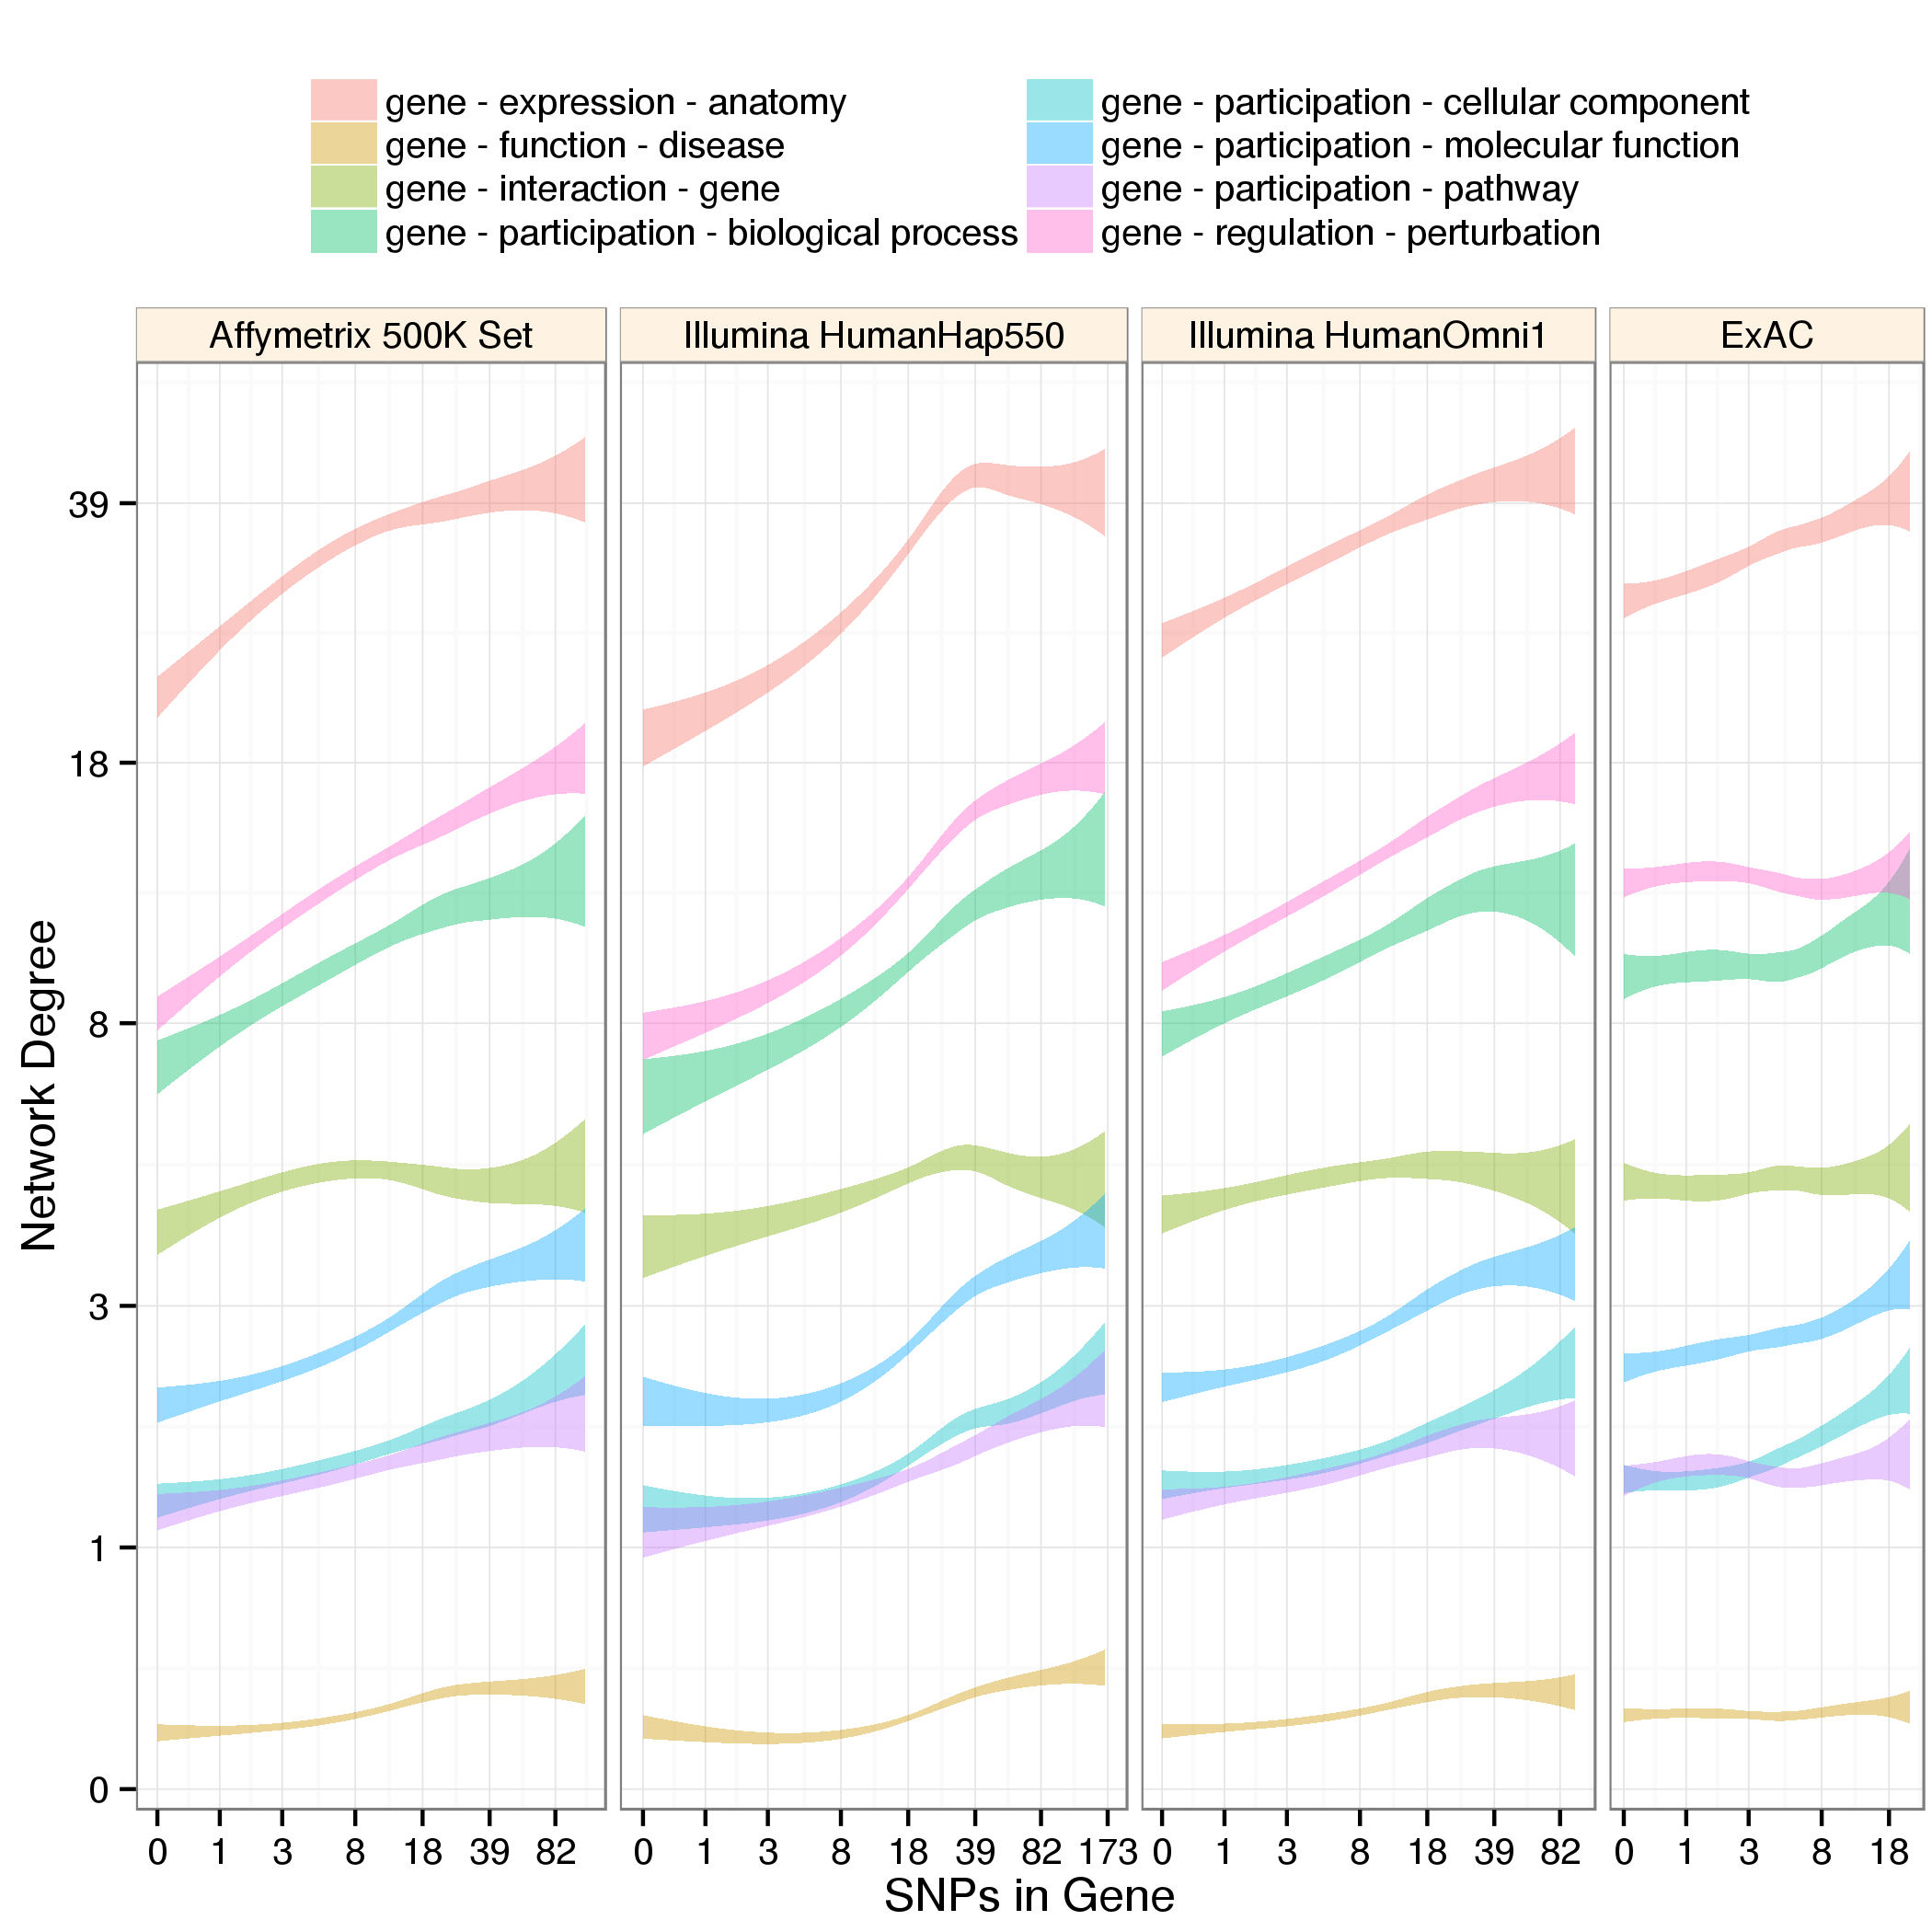
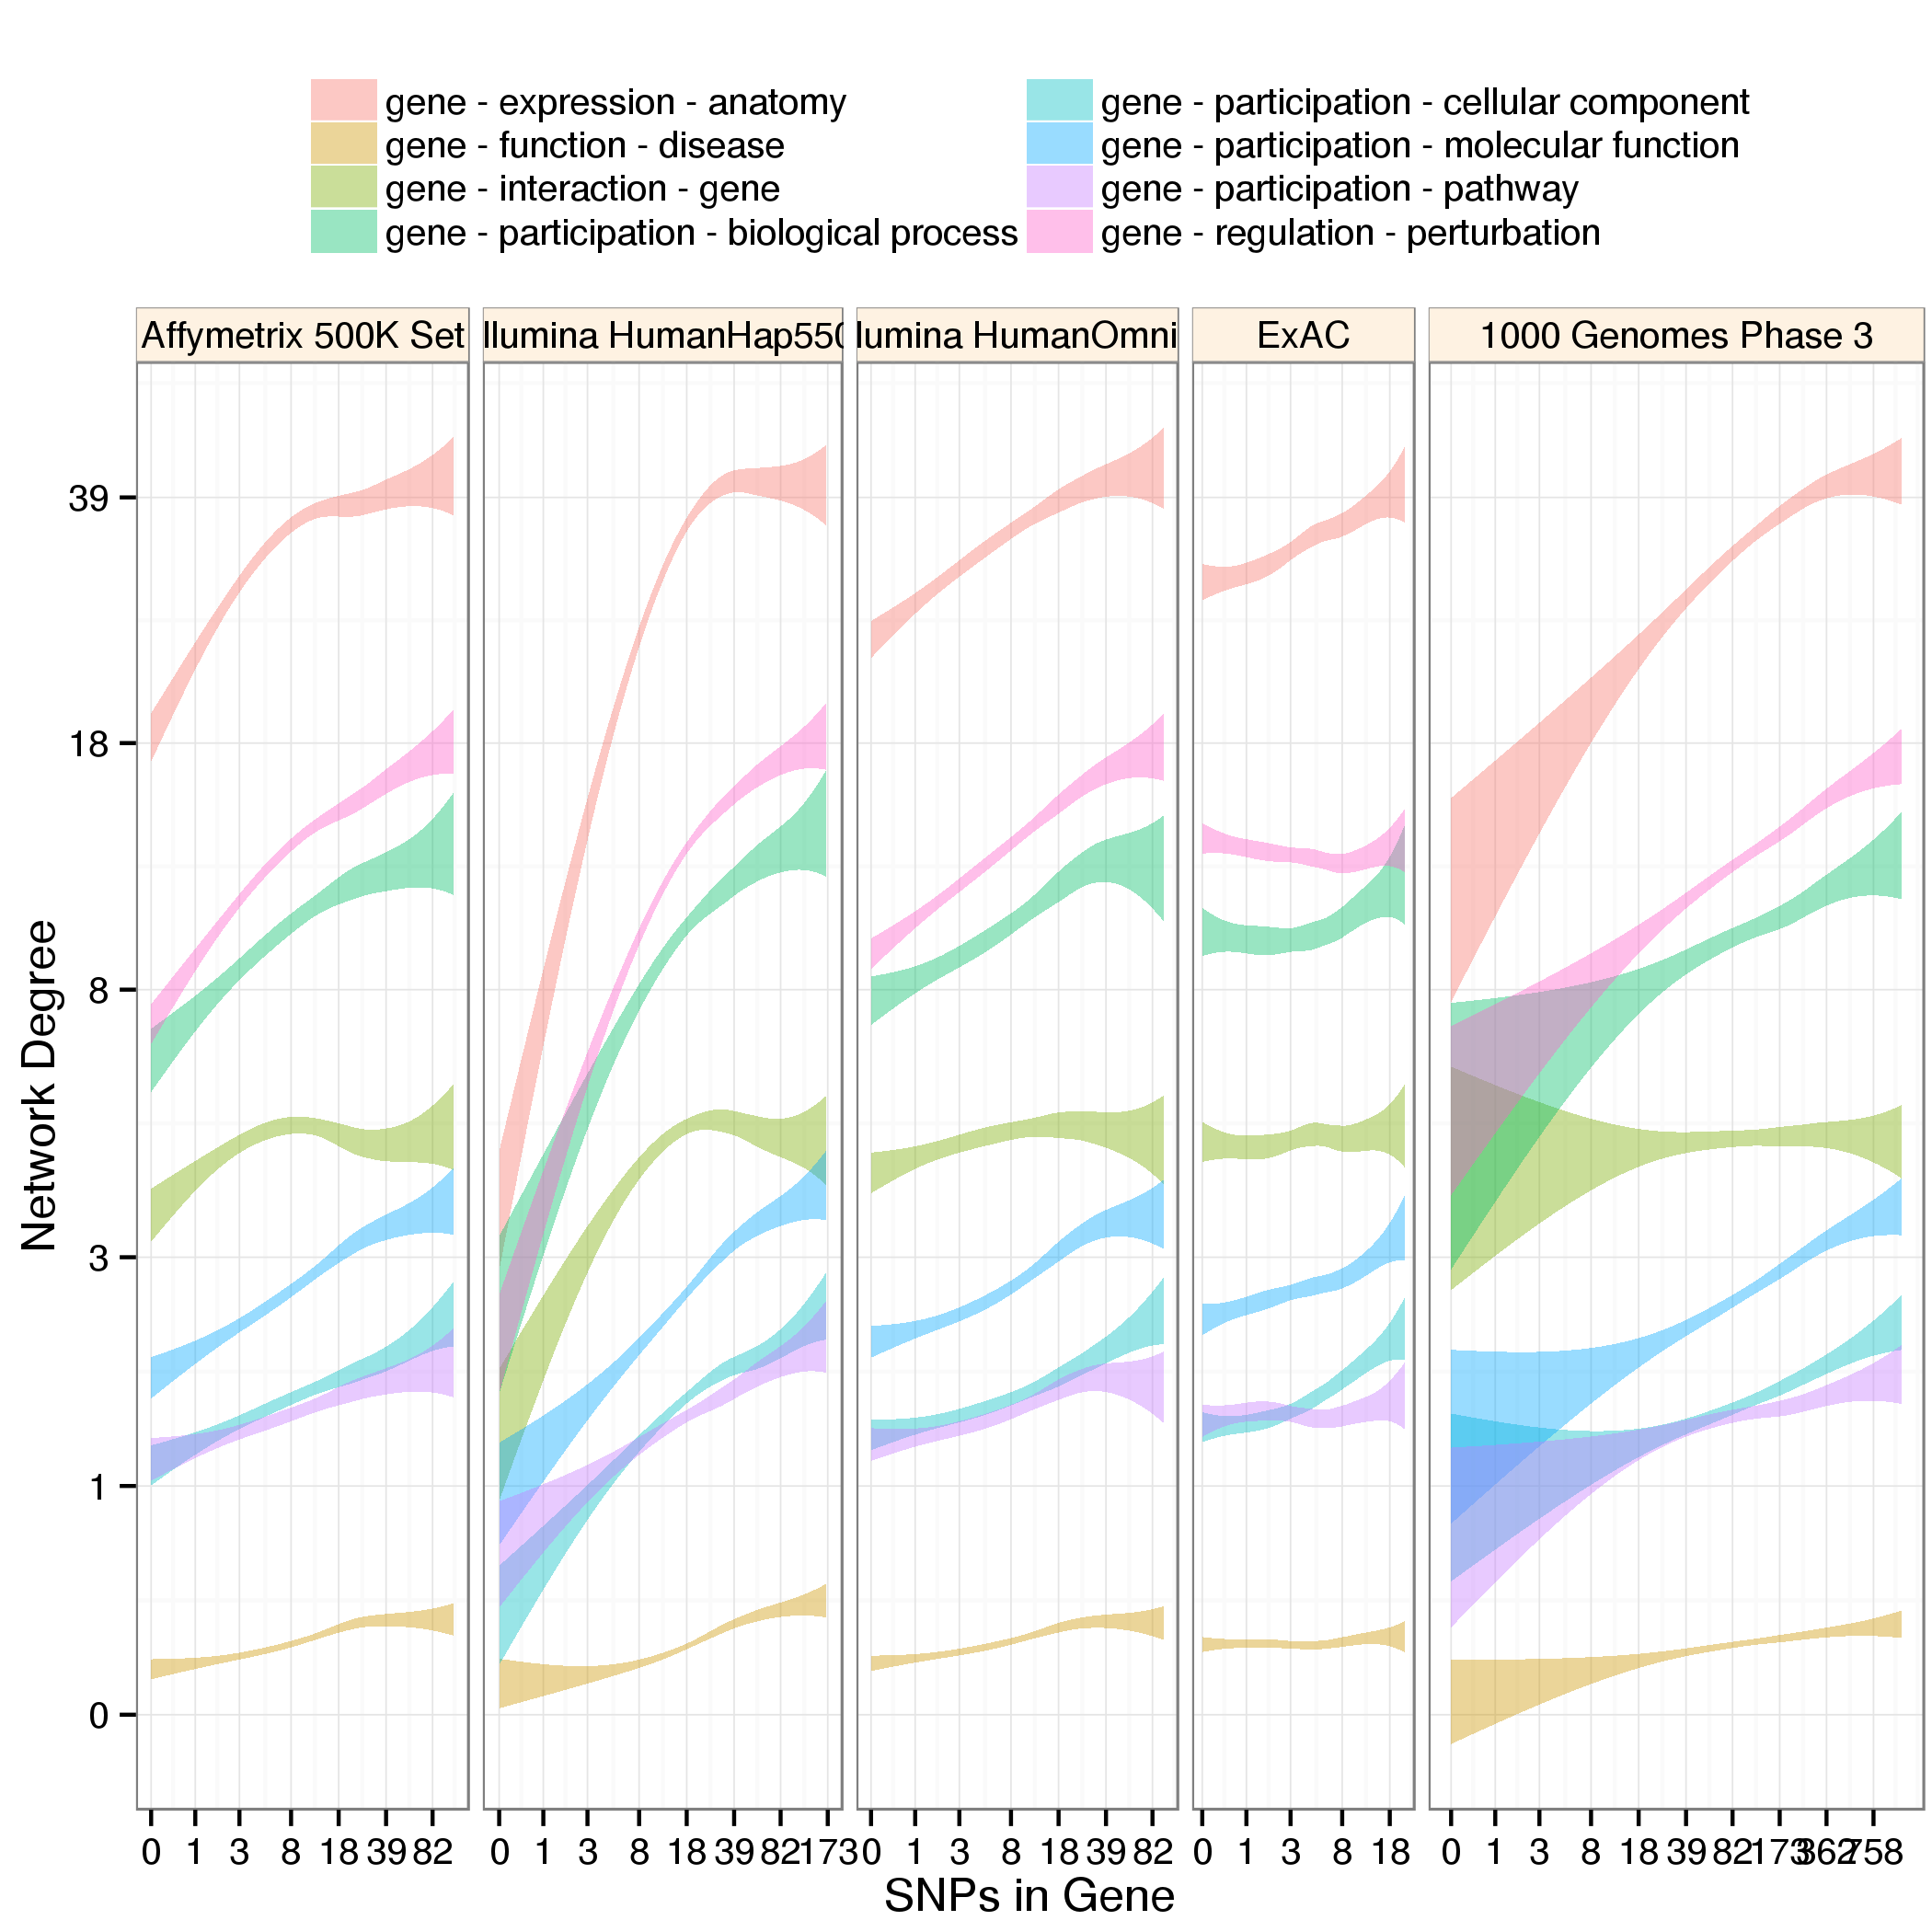
Correlations between SNP abundance and network degree are commonplace. These correlations affect genotyping arrays as well as sequencing indicating that effects are not solely due to biased coverage of genotyping arrays. Physical protein interactions — a popular input for GWAS prioritization techniques — shows less correlation than other types. However, GO annotations — a community favorite for gene set enrichment techniques — increase sharply with SNP abundance. Expression datasets also preferentially report genes with high SNP abundance.
Beware! The potential for erroneous conclusions when gene scores are biased by SNP abundance is high. Ideally, permutation testing should be applied on the SNP level to ensure that SNP to gene conversion biases are not the cause of any positive results. Since access to the raw SNP level data needed for permutation is often impractical or unavailable, care should be taken to use unbiased SNP to gene conversion methods.
A summary of this analysis which includes Figure 1 is published in:
Genetic Association–Guided Analysis of Gene Networks for the Study of Complex Traits
Casey S. Greene, Daniel S. Himmelstein
Circulation: Cardiovascular Genetics (2016-04) https://doi.org/bffr
DOI: 10.1161/circgenetics.115.001181 · PMID: 27094199
 Figure 1: Network degree versus SNP abundance for common data types. Platform and metaedge specific models were fit. Models are drawn as their 95% confidence band. The genes with extreme SNP abundances (bottom and top two percentiles) are omitted for visual clarity.
 Figure 2: Mean-adjusted network degree versus SNP abundance for common data types. The same as Figure 1 except that degree was divided by the mean degree for each metaedge.
 Figure 3: Network degree versus SNP abundance for all metaedges. The same as Figure 1 except that all metaedges with over 1,000 edges are shown. Additionally, genes with extreme SNP abundances were not removed. See
 download/network-summary.tsv for abbreviation lookup and additional metaedge information.
This analysis can be reproduced by running the Jupyter notebooks in the following order:
network-degrees.ipynbto extract gene degrees from hetio-ind, a hetnet that includes many gene metaedges.SNP-to-Gene.ipynbto download data and perform processing for SNP chips.exac.ipynbto process the ExAC sequencing variants.combine-SNPs-and-degrees.ipynbto combine SNPs per Gene measurements from all platforms and hetnet degrees.visualization.ipynbto create visualizations. This is an R notebook.
This material is based upon work supported by the National Science Foundation Graduate Research Fellowship under Grant Number 1144247 to @dhimmel. This material is funded in part by the Gordon and Betty Moore Foundation’s Data-Driven Discovery Initiative through Grant GBMF4552 to @cgreene.