constantinoschillebeeckx / meowcow Goto Github PK
View Code? Open in Web Editor NEWQuickly visualize multidimensional data.
Home Page: https://constantinoschillebeeckx.github.io/meowcow/
Quickly visualize multidimensional data.
Home Page: https://constantinoschillebeeckx.github.io/meowcow/
NVD3 has multiple different bar charts
implement the focus chart (see bottom of example)? might get busy with facets
when you first render a scatter (without colorGroups) and then do an update by adding colorGroups, the chart doesn't update properly.
i've investigated a little bit and it looks like the var data doesn't properly get sent from scatterChart.js to scatter.js
http://meepmoop.com/tijden_werk/
-> render
colorGroup: none
-> render
swarm
showOnlyOutliers: false
-> render
filter out two rooms
-> render, BUG! (point x pos & object constancy)
http://meepmoop.com/tijden_werk/
-> render
swarm
showOnlyOutliers: false
-> render
filter out two rooms
-> render, BUG! (object constancy)
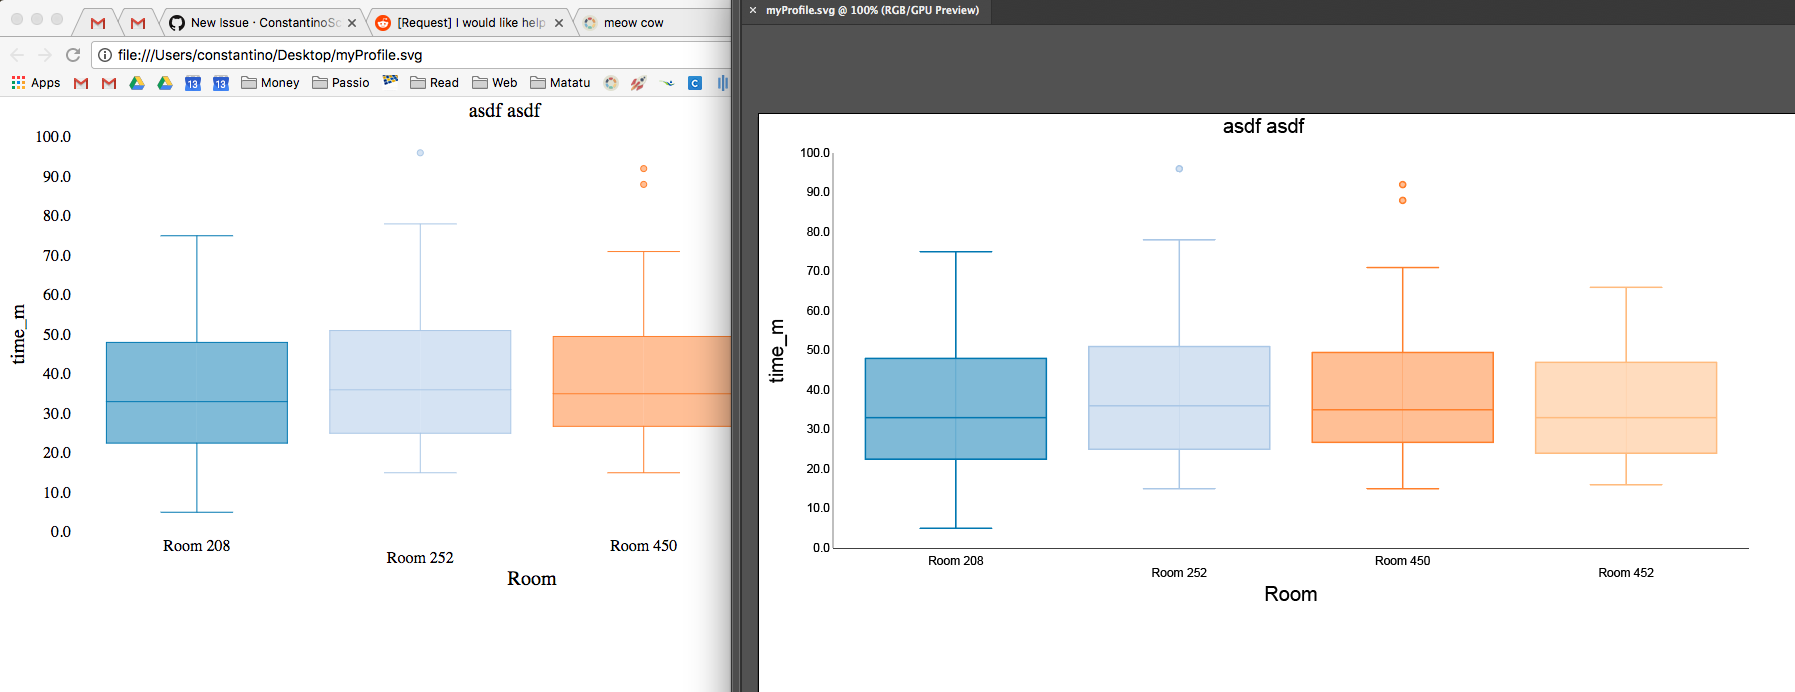
http://meepmoop.com/tijden_werk/
-> render
colorGroup: none
-> render
filter out Room 208 & Room 452
-> render, BUG (point x pos & object constancy)
The issue with this is that, even if there is a large enough margin at the top of the chart, the legend is coded in such a way that it always sticks to the top of the svg

Ideally, the legend NVD3 model would be the one that does that positioning (instead of each chart model). Or, each of the chart models will need to be updated.
NOTE: lineChart and scatterChart have a legendPosition option
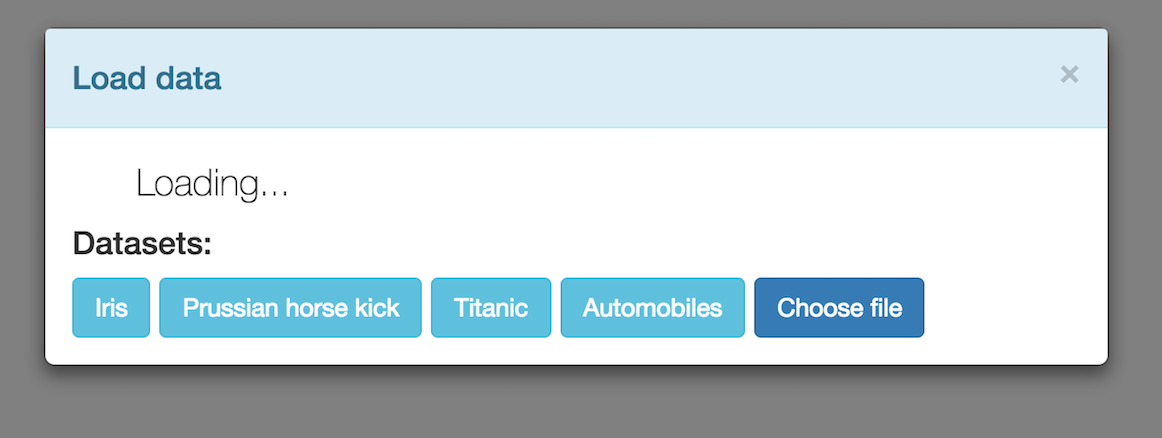
GUI can be initialized through the config; currently can't get the auto-render to generate the plot with config.init to work.
scatter plot type won't change after setting new plot options and updating.
NVD3 has multiple different bar charts
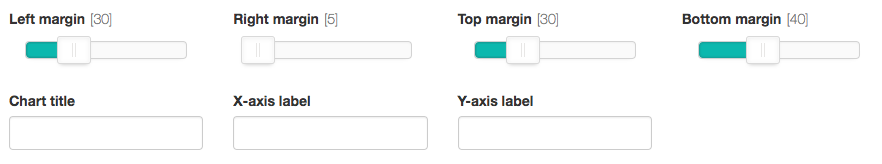
move setup for axes and title to separate tab
in the "data" tab, add buttons to download data as CSV or JSON.
for example, if you choose X & Y first, and then change the plot type, the X & Y choices change, even if the same options are available. should probably cache the chosen options, then set them to the same if available.
right now we do a lazy d3.select('svg') - how do we want to save facets?
the help tooltip in the GUI tabs are not showing anymore
There seems to be an object constancy problem when updating the distrocharts:

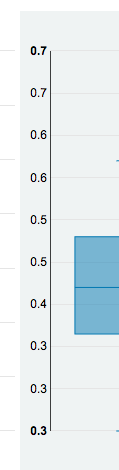
this is the default render (with central tendency line at mean [should change this to median BTW])
once I update the central tendency to median I get:
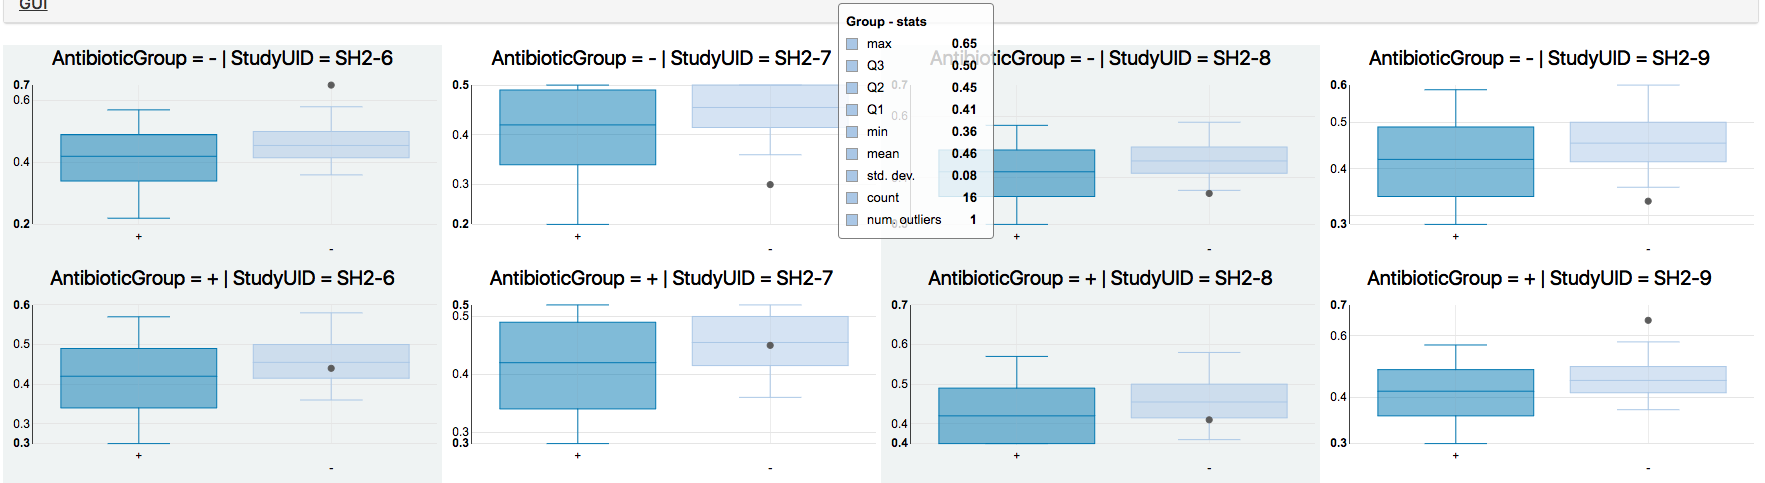
Top row, second panel, stats change completely ...
generated with this data.
input box in gui for chart title isn't getting displayed on plots
generate plots with facets, then adjust a margin (e.g. top) and render - this does not update the plots.

The scatter style for distribution plot is not working. I think it's because the False setting of plottype is being parsed as a literal string instead of a bool

generated with this data.
https://longreads.com/2018/01/11/the-encylopedia-of-the-missing/
http://charleyproject.org/
https://namus.gov/
https://www.fbi.gov/services/cjis/ncic
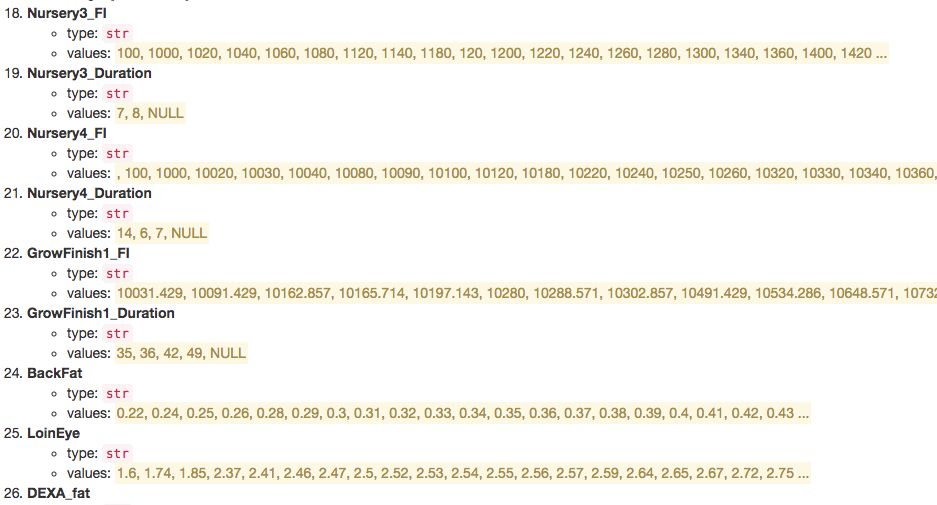
especially for data sets that get truncated (...) it might be nice to know how many categorical levels there are.
might want to all say "Type: categorical" instead of str. and for the numbers do "Type: ordinal" "Format: int"

finish coding out setGUIvals() function for other input types
probably due to blank data getting counted as a str and thus converting entire field to str; generated with this data.

when using facets; generated with this data.
Error message isn't very useful since both row and col are empty; message should be more like: "Columns cannot be empty when specifying col wrap"

make sure users can't do any injection type nasty stuff with text box input.
need to also check all instances of d3 .html() e.g. https://github.com/ConstantinoSchillebeeckx/meowcow/blob/master/js/gui.js#L376
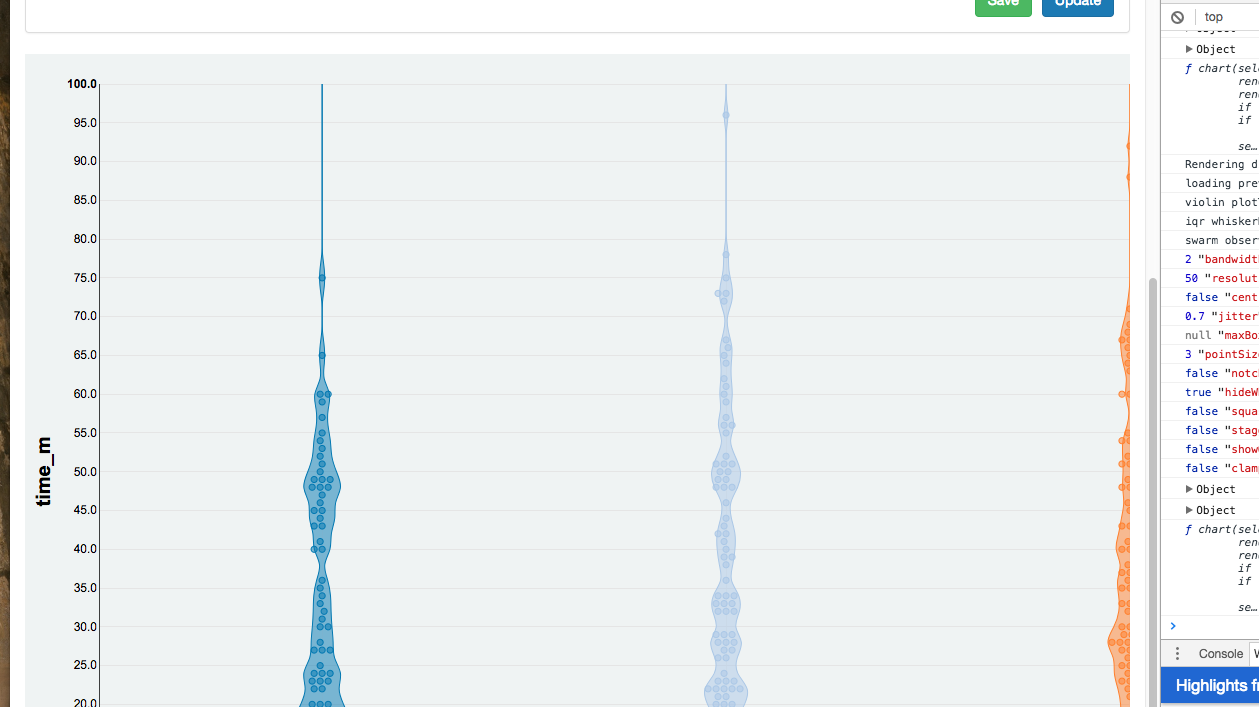
it's either the violin, or the scatter points aren't being placed in the proper y position.

when switching from "centered" to "swarm" layout, y-position is completely wrong
generated with this data.
does not work when colTypes() or ignoreCol() are undefined

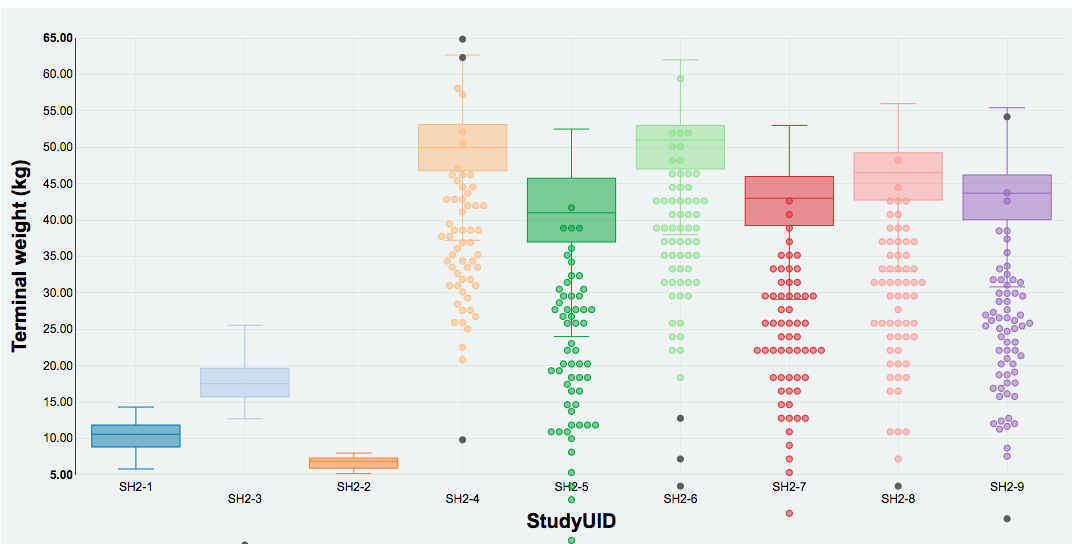
distroplot
x: study
y: terminal wt
-> render
color group: sex id
-> render
show only outliers: false
-> render, bug!

right now, you can render without all chart options set, and it just causes a JS error

implement the focus chart (see bottom of example)? might get busy with facets
distribution plot
x: studyUID
y: WT_end
row: sexID
render
then change an option like "show only outliers" and the rows won't update properly.
I think this is the same bug as #10
furthermore, it doesn't look like the background grid is showing in either.
All facets below should show all observations, whereas only the top row (first two facets) were actually updated.

A declarative, efficient, and flexible JavaScript library for building user interfaces.
🖖 Vue.js is a progressive, incrementally-adoptable JavaScript framework for building UI on the web.
TypeScript is a superset of JavaScript that compiles to clean JavaScript output.
An Open Source Machine Learning Framework for Everyone
The Web framework for perfectionists with deadlines.
A PHP framework for web artisans
Bring data to life with SVG, Canvas and HTML. 📊📈🎉
JavaScript (JS) is a lightweight interpreted programming language with first-class functions.
Some thing interesting about web. New door for the world.
A server is a program made to process requests and deliver data to clients.
Machine learning is a way of modeling and interpreting data that allows a piece of software to respond intelligently.
Some thing interesting about visualization, use data art
Some thing interesting about game, make everyone happy.
We are working to build community through open source technology. NB: members must have two-factor auth.
Open source projects and samples from Microsoft.
Google ❤️ Open Source for everyone.
Alibaba Open Source for everyone
Data-Driven Documents codes.
China tencent open source team.