Quickly visualize multi-dimensional data through various charting types such as:
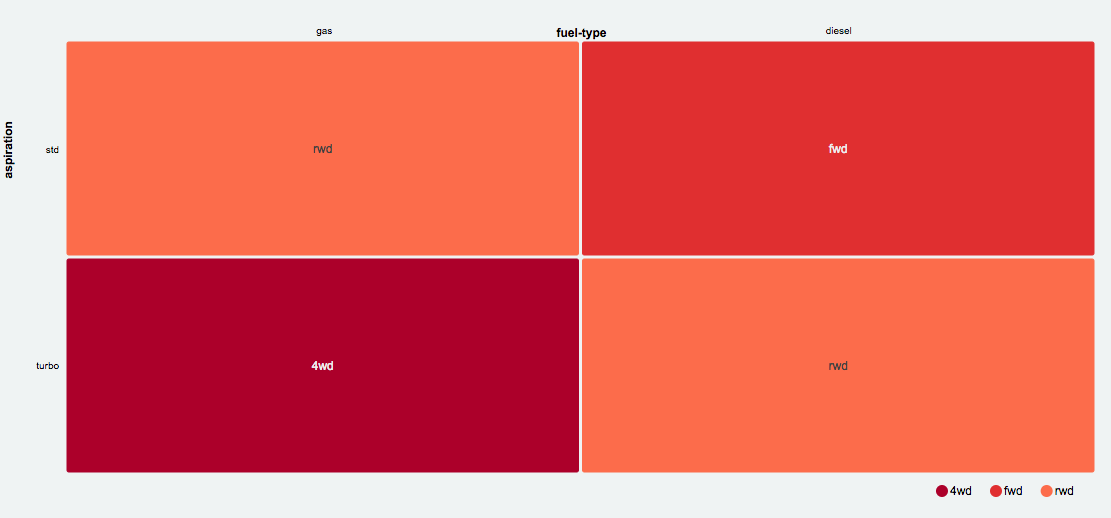
- bar
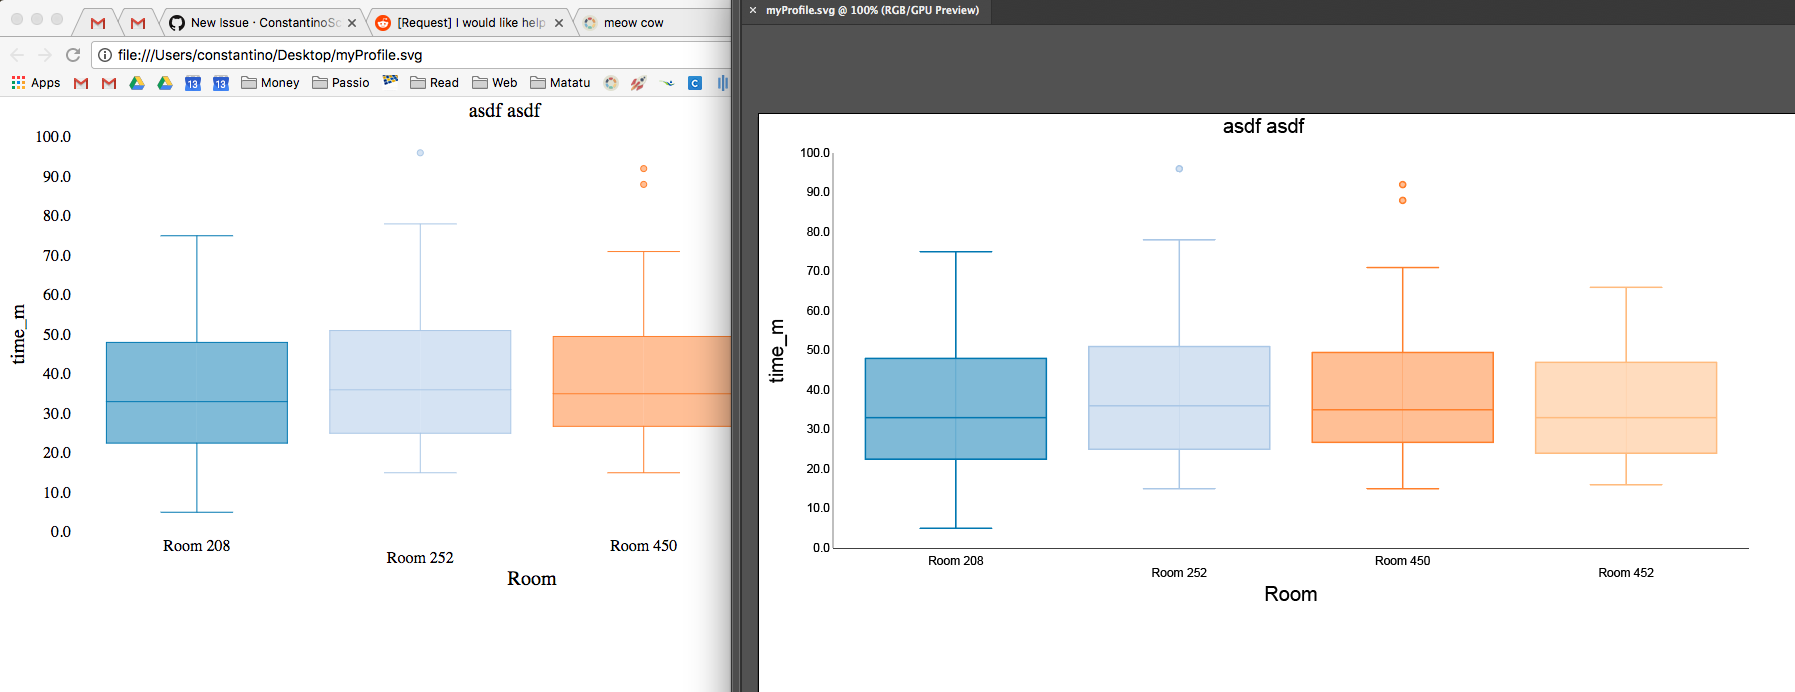
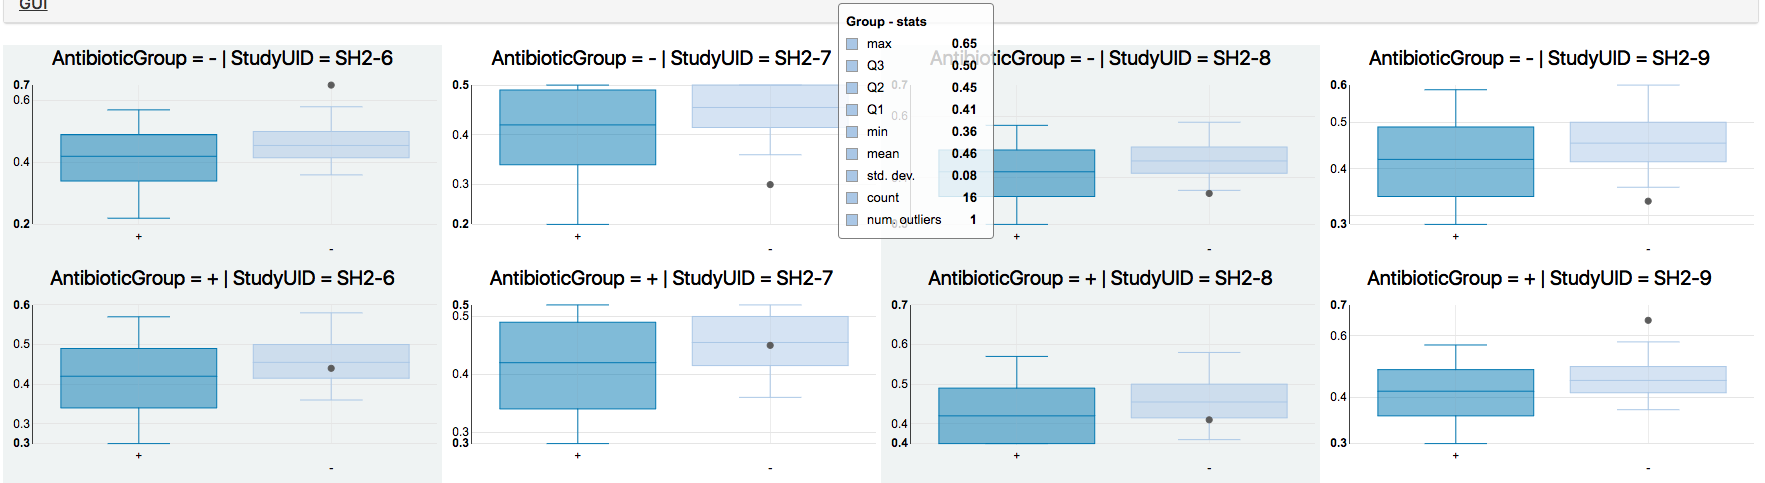
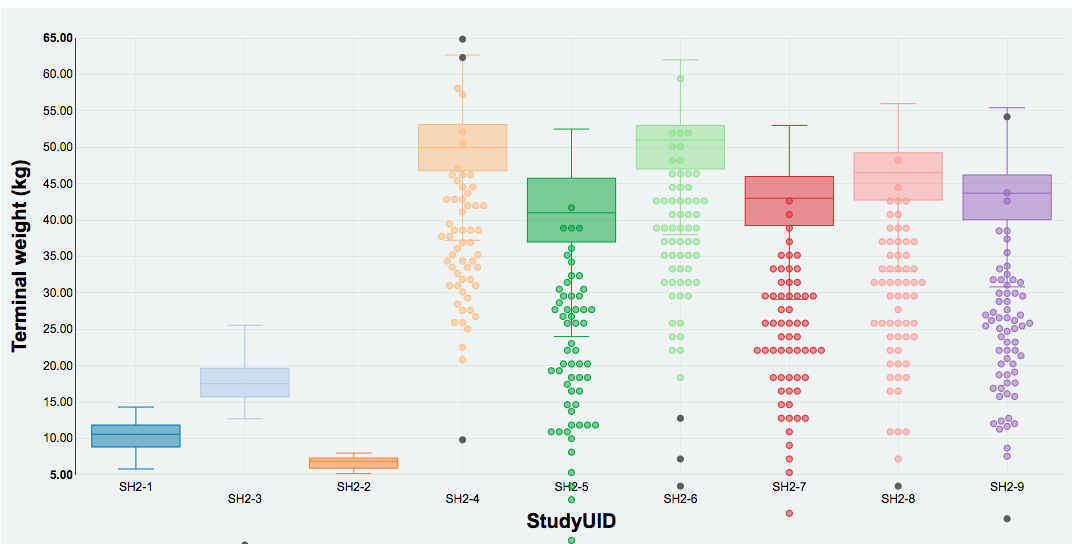
- box
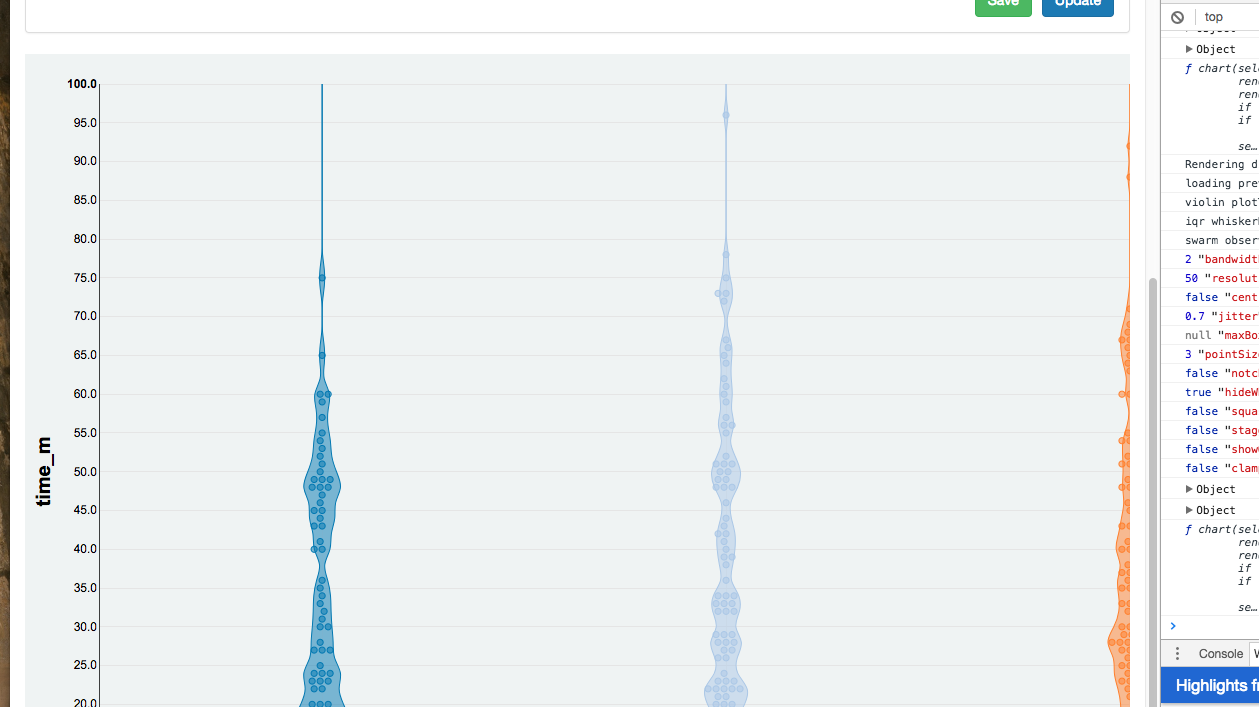
- violin
- scatter
- line
- docs
- readme
- help modal for each plot type showing an example SVG - should make this a config option too
- plot options for line plot: isArea, defined; data options: area, classed,
- save svg button
- order all the filters by type (e.g. group all sliders together)
- resize width on width resize (updateColWidth())
overal chart options:
- log scale axes
- show labels
- manually define labels
- axis left/right or top/bottom
- tick format?
- title
- focus
Data should be provided in a tidy format where each row represents and observation and each column represents a data attribute to be visualizied.
It should be formatted as a list of objects, for example:
var inputData = {
description: 'Lorem ipsum dolor sit amet, consectetur adipisicing elit, sed do eiusmod tempor incididunt ut labore et dolore magna aliqua. Ut enim ad minim veniam, quis nostrud exercitation ullamco laboris nisi ut aliquip ex ea commodo consequat. Duis aute irure dolor in reprehenderit in voluptate velit esse cillum dolore eu fugiat nulla pariatur. Excepteur sint occaecat cupidatat non proident, sunt in culpa qui officia deserunt mollit anim id est laborum.',
meta: null,
source: 'source data goes here',
colDescription: {
Subject:'identifier for study subject',
Study:'study name',
...
},
data : [
{Subject: 157418, Study: 'I', Weight: 11.7, Date: '2016-07-26', Protocol: 'control', Drug: 'zeta', Isolator: 'A'},
{Subject: 157418, Study: 'I', Weight: 10.9, Date: '2016-07-27', Protocol: 'control', Drug: 'zeta', Isolator: 'A'},
{Subject: 157418, Study: 'I', Weight: 12.9, Date: '2016-07-29', Protocol: 'control', Drug: 'zeta', Isolator: 'A'},
{Subject: 157418, Study: 'I', Weight: 14.4, Date: '2016-08-02', Protocol: 'control', Drug: 'zeta', Isolator: 'A'},
{Subject: 157418, Study: 'I', Weight: 16.6, Date: '2016-08-09', Protocol: 'control', Drug: 'zeta', Isolator: 'A'},
{Subject: 157418, Study: 'I', Weight: 17.1, Date: '2016-08-16', Protocol: 'control', Drug: 'zeta', Isolator: 'A'},
...
]
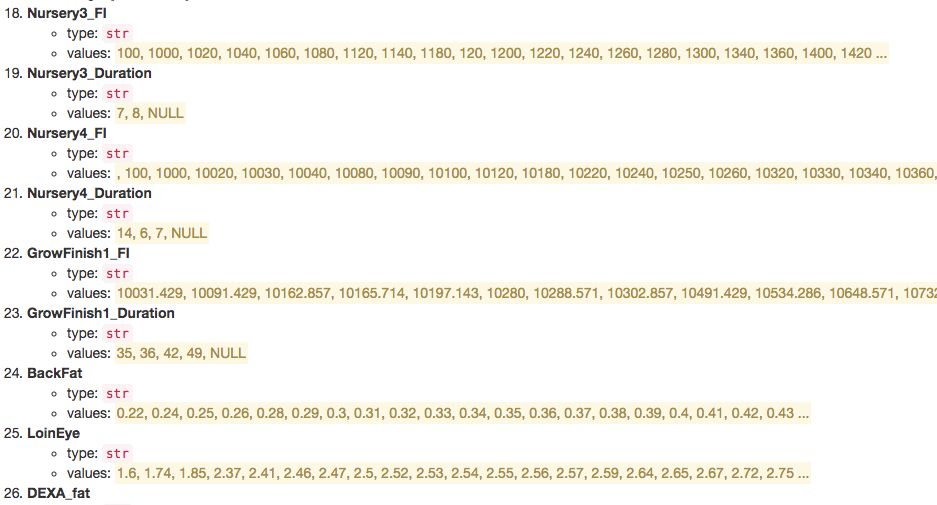
}Note that data can be input as strings and will be converted to the proper type (int of float) automatically; furthermore, the data type can be overwritten with the option .colTypes. For example, in the dataset shown above, the Subject attribute should be treated as an ordinal datatype as opposed to a quantitative one; this can be specified with .colTypes({Subject: 'str'}).
Designate a DOM element into which the GUI and plots should be rendered, e.g. <body class='container-fluid' id='renderHere'></body>
Then, instantiate everything (on load) with something like:
<script>
    $(function() {

        var moo = meowcow()
            .container('#renderHere')
            .data(inputDat) // declared in js/tall.js - if left unspecified, a modal will be loaded which allows user to upload a delimited file
            .config(guiSetup) // declared in js/config.js
            .ignoreCol(['_UID']) // ignore these columns in input data
            .colTypes({Subject: 'str'}) // overwrite column type
            .run();
    });
</script>The following options are available:
- .container(str) - DOM selector into which to render both the GUI and the eventual plots.
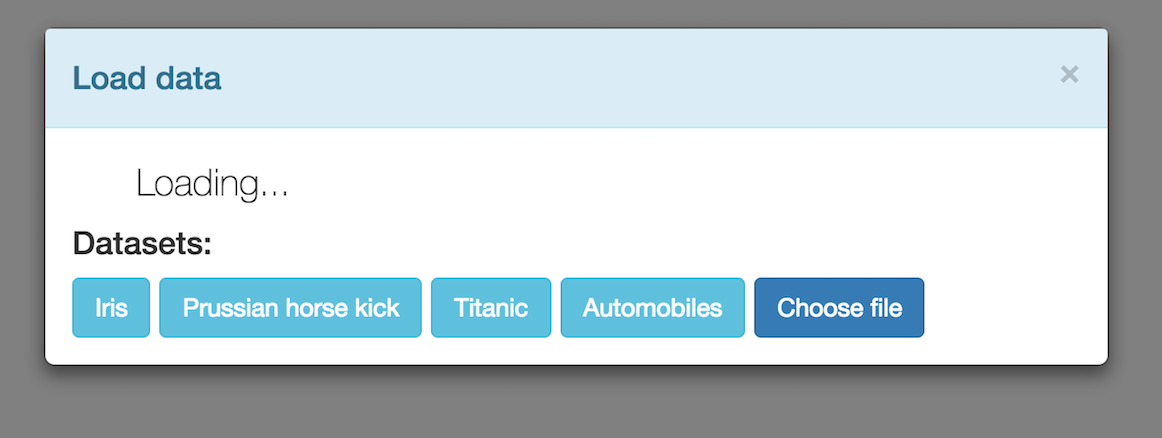
- .data(list, optional) - data to be visualized; if not specified, a modal will be presented with an option to upload a delimited file.
- .config(JSON) - configuration file for the app which includes options for the GUI as well as for the various plot types.
- .ignoreCol(list, optional) - list of attributes that should be excluded from the GUI, must be present in
dataif provided. - .colTypes(obj, optional) - overwrite the automatically detected attribute type, types must be one of str, float, date or datetime, e.g. {Subject: 'str'}
- .run(void) - initialize the app.
This configuration file sets all the proper options for both the GUI and each of the plot types to be rendered; an example file can be found in js/config.js.
- useToyData - bool, whether to provide use option to select from several toy datasets from the file upload modal in cases where the
.data()attribute hasn't been specified. OPTIONAL, default false - missing - list, datum to treat as missing from loaded dataset, e.g. 'NA'. OPTIONAL, default "" (empty string)
- plotTypes - object, the available plot types to provide select for in GUI; object keys are plot type name and must be an available model in NVD3, object values are formatted as an object and specify the configuration for each plot type.
Each of the keys in this entry will populate the plot type select input located in the setup tab of the GUI. The keys for this object defines a particular plot type and must be available as a model in NVD3; the value for an entry in this object is also an object and must have the following entries:
- allowFacets - bool, whether to allow faceting of data for this plot type - OPTIONAL, default true
- parseData - TODO
- label -str, label to use in select option for this plot type; if not provided, plot type key will be used - OPTIONAL
- axes - list of objects, bind the proper data attribute to the plot's primary axes - REQUIRED
- options - list of objects, customization options for plot type
Each entry in this list will generate a select input in the setup tab of the GUI and will bind the proper data attribute to the plot's primary axes; must be formatted as an object with the following entries:
- type - str, the data attribute's data type, either
quantitativeorordinal; if not provided, it is assumed any data type will do - OPTIONAL - accessor - str, accessor with which to bind data attribute, must be a NVD3 model option for the given plot type - REQUIRED
- label - str, label to give to axes select; if not provided, accessor value will be used - OPTIONAL
- skipCheck - bool, when passed as
truethis accessor won't be checked against the NVD3 model; this is normally set when specifying aparseDatafunction.
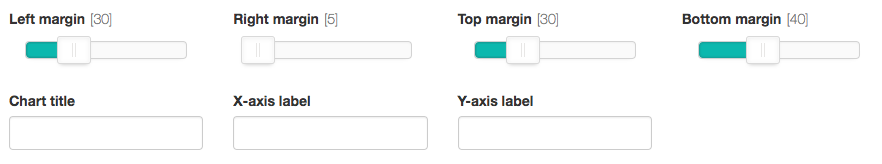
Each of the items listed in this entry will generate a form input in the options tab of the GUI and is used to set the corresponding option for the given plot type. The items are formatted as objects with the following entries:
- type - str, the type of form input to render, must be one of
select,textandslider- REQUIRED - accessor - str, accessor with which to set plot option, must be a NVD3 model option for the given plot type - REQUIRED
- label - str, label to give to form input; if not provided, accessor value will be used - OPTIONAL
- help - obj, if provided, a help icon will be rendered next to the form input which serves as a bootstrap popover for provided the user with details regarding the specific option. It uses the same format as the bootstrap popover options, see docs - OPTIONAL
- domClass str, class to give to input group e.g. col-sm-4
- required - bool, whether to set the form input as required - OPTIONAL, default false
Along with the entries shown above, each input type has specific options.
select
- values - array or object, populate the select input with these values; if an object is provided, the keys will set the select labels and the values will set the select values - REQUIRED
- addOption - array or object, additional option to prepend to select options, formatted similarly to
values- OPTIONAL - setDefault - str, default value used to set default option - OPTIONAL
toggle
- options - obj, options for toggle, must have same format as the bootstrap toggle options, see docs - REQUIRED
- setDefault - bool, default value used to pre-populate text input - OPTIONAL, default false
text
- setDefault - str, default value used to pre-populate text input - OPTIONAL
slider
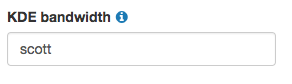
- options - obj, options for slider, must have same format as the noUIslider options, see docs - REQUIRED
- format - function, if provided, function is used to format the slider value displayed in the input label - OPTIONAL