camptocamp / grafana-prometheus-alertmanager-datasource Goto Github PK
View Code? Open in Web Editor NEWGrafana Datasource for the Prometheus Alertmanager
License: Apache License 2.0
Grafana Datasource for the Prometheus Alertmanager
License: Apache License 2.0
Hello,
I've been able to create single panel but what is the query for the table view?
I've tried alertname="DeadMansSwitch" (same query as single) but it returns: no data to show
I have configured Alertmanager data source in K8s ConfigMap:
data:
  datasource.yaml: |-
    apiVersion: 1
    datasources:
    - name: AlertManager
      type: camptocamp-prometheus-alertmanager-datasource
      url: http://{{ template "prometheus-operator.fullname" . }}-alertmanager:9093/{{ trimPrefix "/" .Values.prometheus.prometheusSpec.routePrefix }}
      access: proxy
It does load fine and I see the data source in the Grafana UI.
When I go to the dashboard nothing loads and get the following error:
AlertManager plugin failed TypeError: Cannot read property 'toLowerCase' of undefined
If I configure the data source manually via the Kibana UI and make the dashboard point to it everything loads fine and I'm able to see all stats in the dashboard.
What am I missing the in the ConfigMap to make it work?
Hi,
As I switch over grafana to use this datasource for a more accurate alert figures I am trying to re-create the following graph that shows the rate of alerts over a period of time so i can look back historically, however struggling to re-create this with grafana-prometheus-alertmanager-datasource
count (irate(ALERTS{instance=~"$server"}[2m]))
Hello there
We've been using your datasource for a few weeks now and have run into some minor issues.
One that I'd like to discuss here is the coloring of alerts/rows.
What we want:
We added a rule for Column Styles to color the rows according to their severity (critical = red, warning = orange etc.). There are three colors predefined and a box to put the thresholds. How can this be done? We have four severity levels and I'm not quite sure what to put into the Threshold box in order to get the coloring right.
I'd be grateful for some help/insight here. Thanks.
Dimi
With this version of grafana, we have this plugin error:
Error: Failed to fetch Instantiating public/vendor/plugin-css/css.js Loading /public/vendor/plugin-css/css.js Instantiating public/plugins/camptocamp-prometheus-alertmanager-datasource/css/query-editor.css!/public/vendor/plugin-css/css.js Loading /public/plugins/camptocamp-prometheus-alertmanager-datasource/query_ctrl.js Loading plugins/camptocamp-prometheus-alertmanager-datasource/module
Grafana Version: v6.2.0 (5d16da7)
Prometheus Alertmanager Version: 20190503-09:10:07
Here is my setup:


And here, you see, that the datasource is working, because the query result is holding alerts:

When I have alert without annotations the rendering results in
can't convert null to object
stacktrace:
query/<@https://foo.bar:3000/public/plugins/camptocamp-prometheus-alertmanager-datasource/datasource.js:130:67
u@https://foo.bar:3000/public/build/vendor.2c3c591224fb193f7fd3.js:92:69119
l/<@https://foo.bar:3000/public/build/vendor.2c3c591224fb193f7fd3.js:92:69565
$digest@https://foo.bar:3000/public/build/vendor.2c3c591224fb193f7fd3.js:92:75262
$apply@https://foo.bar:3000/public/build/vendor.2c3c591224fb193f7fd3.js:92:77074
A/s<@https://foo.bar:3000/public/build/vendor.2c3c591224fb193f7fd3.js:92:73133
i@https://foo.bar:3000/public/build/vendor.2c3c591224fb193f7fd3.js:92:21976
me/l.defer/n<@https://foo.bar:3000/public/build/vendor.2c3c591224fb193f7fd3.js:92:23440
here is output of the query inspector
{
  "xhrStatus": "complete",
  "request": {
    "method": "GET",
    "url": "api/datasources/proxy/6/api/v1/alerts?silenced=false&inhibited=false&filter=",
    "data": {
      "timezone": "browser",
      "panelId": 2,
      "range": {
        "from": "2018-06-08T02:48:53.609Z",
        "to": "2018-06-08T08:48:53.609Z",
        "raw": {
          "from": "now-6h",
          "to": "now"
        }
      },
      "rangeRaw": {
        "from": "now-6h",
        "to": "now"
      },
      "interval": "20s",
      "intervalMs": 20000,
      "targets": [
        {
          "annotations": false,
          "expr": "",
          "format": "table",
          "intervalFactor": 1,
          "labelSelector": "alertname,description,severity",
          "legendFormat": "",
          "refId": "A",
          "target": "Query",
          "type": "table",
          "$$hashKey": "object:105"
        }
      ],
      "maxDataPoints": 960,
      "scopedVars": {
        "__interval": {
          "text": "20s",
          "value": "20s"
        },
        "__interval_ms": {
          "text": 20000,
          "value": 20000
        }
      },
      "targetss": [
        {
          "target": "Query",
          "expr": "",
          "refId": "A",
          "type": "table",
          "legendFormat": ""
        }
      ]
    }
  },
  "response": {
    "status": "success",
    "data": [
      {
        "labels": {
          "alertname": "PagerDuty Test #1",
          "severity": "critical"
        },
        "annotations": null,
        "startsAt": "2018-06-08T10:43:11.847818158+02:00",
        "endsAt": "2018-06-08T10:50:16.506373092+02:00",
        "generatorURL": "",
        "status": {
          "state": "active",
          "silencedBy": [],
          "inhibitedBy": []
        },
        "receivers": [
          "PagerDuty"
        ],
        "fingerprint": "da316be2cf22511d"
      },
      {
        "labels": {
          "Alertname": "PagerDuty Test #1"
        },
        "annotations": null,
        "startsAt": "2018-06-08T10:44:56.366261482+02:00",
        "endsAt": "2018-06-08T10:49:56.366261482+02:00",
        "generatorURL": "",
        "status": {
          "state": "active",
          "silencedBy": [],
          "inhibitedBy": []
        },
        "receivers": [
          "PagerDuty"
        ],
        "fingerprint": "ff0e71b643bc495f"
      }
    ]
  }
}Please add a dashboard sample json with maximum data available.
I've tried a few different things but don't appear to be able to return the value for number of silenced alerts in a stat panel.
Can you advise how I would achieve this?
Cheers.
Pete
Hello!
I've installed the latest version of your plugin (0.0.7) but severity field is still blank.
Here is my config:
Critical 4
High 3
Warning 2
Info 1

Both in Alertmanager and Prometheus alert marked as "severity=critical"
Any insights on how to fix this?
Thanks in advance!
JFYI: No error text in latest grafana. In my case -- I forgot to start alertmanager.

I have some labels as you can see here:

When I try a filter expression like context="PSP-T" still all alarms are visisble in Grafana. Also a filter like instance="IP-ADDRESS" which should only hit one single alarm is not working.
I always get all alarms.
I propose an implementation of the metricFindQuery method used by variable queries.
For instance it could be used to get a list of all the hosts with open alerts as a variable.
Alertmanager always gives 1 as value for all active alarms.
for example
alert: high_load
expr: (1
  - (avg(irate(node_cpu{job="node",mode="idle"}[5m])) WITHOUT (cpu)))
  > 0.6
for: 1m
labels:
  severity: warning
annotations:
  description: Instance {{ $labels.instance }} cpu over 60%
  resolved: Instance {{ $labels.instance }} cpu is ok
  summary: Instance {{ $labels.instance }} cpu over 60%
  value: '{{$value}}'
I can add value to description, bun can't set value to separated field in grafana table.
I noticed that regardless of the setting "Access" being Direct or Proxy, Grafana will always access alertmanager from the client browser.
Hello,
I think it would be nice to fetch data about silences from api/v1/silences endpoint. It will allow to observe not only active alerts but also silence rules (I believe this is also very important thing to monitor as incorrectly defined silence may mute important alerts which should not be covered by silence etc.)
Related issues #6 and #35 will only give ability to show silenced alerts but this feature request aims on giving ability to show list of silence rules instead.
Hi,
I found that this data source only support single and table panel, I'm now trying to count alert numbers for different severity level in one panel, the status panel seems feasible for that, but it can't be archived by using current alertmanager datasource. I guess it's because current datasource only support single data serial, is it possible to implement to support multiple data series for query? thanks in advance.
best regards.
Grafana 5.1.3
Prometheus 2.2.1
Alertmanager 0.15.0
Alertmanager Plugin 0.0.5
When I try to display alerts in a table (the table transform is "time series to column") akin to the example in the documentation, I get the following error (shown in the top left corner):
Panel data error: TypeError: Cannot read property 'match' of undefined

Has anyone else experienced this issue? I tried a few things such as editing the 'column styles' options to try and resolve the error but so far nothing has worked. There are currently no query expressions, and I a simply trying to display all alerts from prometheus in a table.
Why the alarms are not marked in color? Example:

What I have to do? Please help
Is it relevant to keep severity management in the datasource or would it be better to let the user manage this by itself?
Does it work with prometheus 2.x alert rules format?
Version 0.0.7 with severity related enhancements and fixes is not available in grafana plugins page yet.
https://grafana.com/plugins/camptocamp-prometheus-alertmanager-datasource/installation
Can you please update the plugin version in the plugin-repository? Thanks!
hi
i'd like to get the configured datasource url and use it as drill-down detail link in the alerts panel

the workaround, in the image, is by adding a hard-coded URL. But, obviously I can't deliver such dashboard configuration to production. and also people in production don't have rights to modify the dashboard.
thanks
Currently you are not able to query with variable from templates.
It would be nice to add variables to your queries. For example like that:
Please add support for using template variables in queries with the alertmanager datasource.
Regards,
Jonas
Hi, at first thank's for the plugin!
I'm wondering if you plan releasing the 0.0.4 version on Grafna.com so it can be installed using the
grafana-cli plugins install camptocamp-prometheus-alertmanager-datasourceThat would be really great. I'm looking forward the manual severity levels.
Hi,
with grafana-5.3.1 i get the following error after upgrading:
Plugin Error
Failed to fetch Instantiating https://status.chefkoch.net/public/plugins/camptocamp-prometheus-alertmanager-datasource/module.js Loading plugins/camptocamp-prometheus-alertmanager-datasource/module
When trying to delete and readd a alertmanager-datasource, i can't specify the severities..
looks like #39
At the first time to config:
Severity levels
Critical 4
High 3
Warning 2
Info 1
In readme, it seems severity desribe severity levels.
Then i set severity in first_rule.yaml and it can show in grafana, but those level can not convert to text as above config.
Is it a misunderstanding or a feature does not achieve?
Getting this error when "Save and Test""
TypeError: Cannot read property 'toLowerCase' of undefined
Have I misconfigured or is this a KP?
I couldn't see any examples on configuring the plugin via the provisioning method.
So I played around until I got a working example:
datasources:
 - name: alertmanager
   type: camptocamp-prometheus-alertmanager-datasource
   access: proxy
   org_id: 1
   url: http://alertmanager-main.monitoring:9093
   version: 1
   editable: false
   json_data:
     severity_critical: critical
     severity_high: error
     severity_warning: warning
     severity_info: information
In my case I am running Grafana as a pod in K8s talking to prometheus - and now alertmanager. The datasources file is provided on pod startup via a configmap.
Sharing my example incase its useful to anyone else.
Apologies, I wasn't sure how best to make a PR. clone, or just branch on repository.
Hi @cryptobioz,
First of all, thanks for your job here!
This is an issue, but I just wanted to ask you some things,
grafana.com.Version number was not updated, therefore grafana says the version is 0.0.3.
I would like to have a plugin not only show the current alerts, also can find the history of alerts. Can I set the time range in this plugin to search the old alerts?
There is a known security risk with nwmatcher. The current version used is too old.
Please update.
More about the issue:
https://snyk.io/vuln/npm:nwmatcher:20180305
First, thanks for the plugin!
I've just installed grafana 4.6 and the camptocamp-prometheus-alertmanager-datasource plugin. But I cant' find where to define the alertmanager url for the datasource.
Grafana only prompts for a name, ant when save it shows an error:
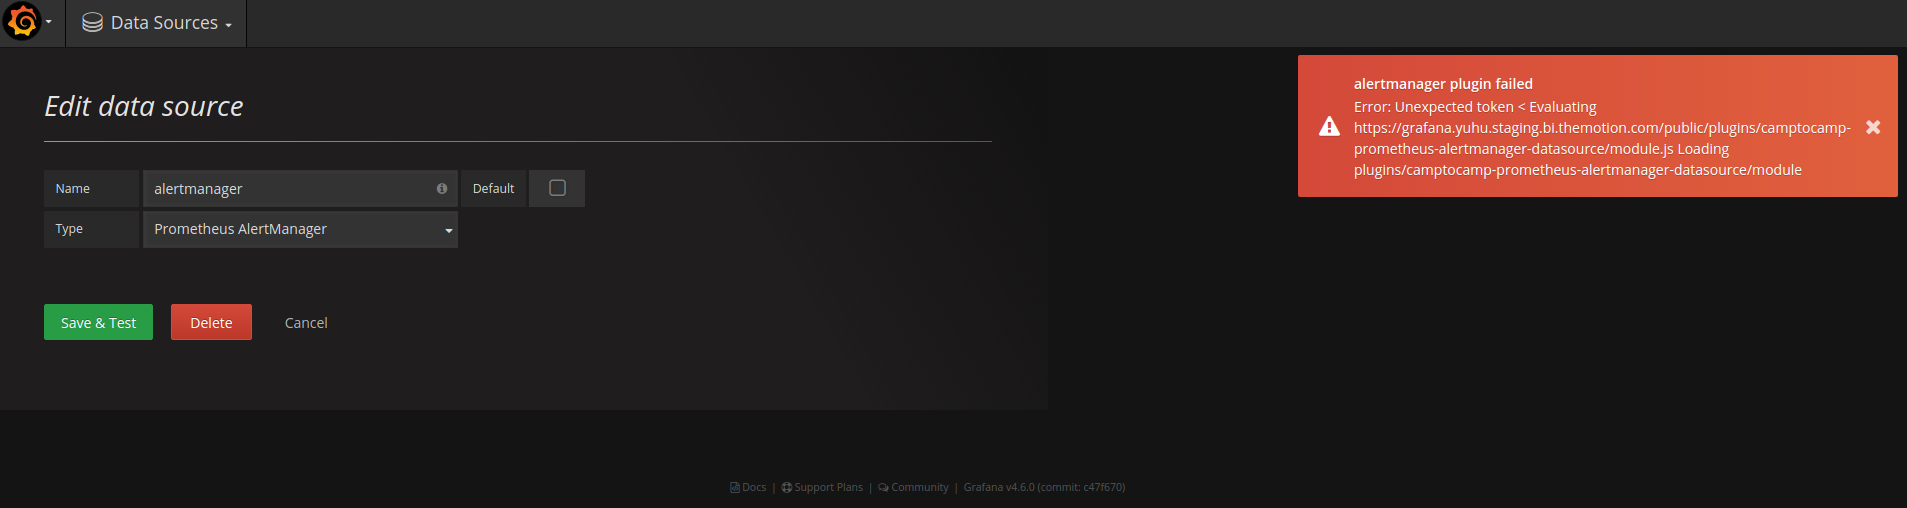
Please add docs on how to configure the datasource.
Hi There
First off... nice plugin!
Severity cannot be displayed as we do not use a numeric representation. The Prometheus documentation does not prescribe this field to be an integer. In our case we use keywords like "Critical", "Warning" or "Info".
Is there a possibility to have this label parsed without converting it to int?
apiVersion: 1
datasources:
- name: AlertManager
type: camptocamp-prometheus-alertmanager-datasource
access: proxy
url: http://alertmanager:9093/alertmanager
orgId: 1
version: 1
editable: true
jsonData:
severity:
critical: 3
warning: 2
info: 1
I have json configuration for alertmanger plugin, but while start grafana, i get below errors:
t=2018-05-10T00:06:10+0000 lvl=eror msg="Startup failed" error="Failed to provision Grafana from config. error: json: unsupported type: map[interface {}]interface {}"
t=2018-05-10T00:06:10+0000 lvl=info msg="Shutdown started" logger=server code=1 reason="startup error"
panic: runtime error: invalid memory address or nil pointer dereference
[signal SIGSEGV: segmentation violation code=0x1 addr=0x38 pc=0xef1f56]
goroutine 21 [running]:
github.com/grafana/grafana/pkg/api.(*HttpServer).Shutdown(0x0, 0x1f87fe0, 0xc42023bc80, 0xc42023b400, 0x4)
/go/src/github.com/grafana/grafana/pkg/api/http_server.go:97 +0x26
main.(*GrafanaServerImpl).Shutdown(0xc42023bd00, 0x1, 0x144d9cf, 0xd)
/go/src/github.com/grafana/grafana/pkg/cmd/grafana-server/server.go:137 +0x19f
main.listenToSystemSignals(0xc42023bd00, 0xc420126660)
/go/src/github.com/grafana/grafana/pkg/cmd/grafana-server/main.go:118 +0x291
created by main.main
/go/src/github.com/grafana/grafana/pkg/cmd/grafana-server/main.go:85 +0x2a3
I tried to remove jsonData section, then grafana can be started correctly, but severity information is not there, may i know how to process jsonData section ?
With version 0.0.3 the ability to use variables queries has been added.
Unfortunately i can't get this to work for me in Grafana.
When I'm using my variables in the query the datasource won't regonize them as a variable and just prints "$variable" in the url to get the data from the alertmanager.
Is there something im doing wrong here?

A dashboard we have that renders some data from Prometheus suddenly started to fail to work with the error seen on the above screenshot.
I tracked the error to https://github.com/camptocamp/grafana-prometheus-alertmanager-datasource/blob/master/dist/datasource.js#L45 file, the instanceSettings.jsonData is for some reason empty ({}).
Hello,
I am unable to configure the plugin in Grafana.
What is the correct url to configure ? is it http://localhost:9090 or http://localhost:9093
With the first URL (URL for Prometheus) I have :

With the second URL :

Thank you for your help
Best regards
Hi There,
Using Prometheus Alert Manager as a datasource and configuring a single stat panel doesn't display the "Spark lines" when the option is checked.
When I revert back to the Prometheus data source then spark lines display as expected.
Can you please advise?
Hi,
I don't appear to be able to use sort_desc or the likes in the query to sort the data in the table.
I would like to order severity to display critical alerts at the top.
cheers.
Pete
Hi.
If I hard code a query for example
region="eu-west-1" it will filter as expected, however if I define a variable;
region="$region" then this does not work.
Can you please advise how this should work ?
I am using plugin version 0.0.4 under Grafana 5.1.0 and using Firefox 59.0.2. The datasource installs and validates successfully, but when attempting to add a Table panel I get the error: e.text is undefined with the following stack trace:
[1623]/l</t.prototype.initColumns@http://localhost:3000/public/build/0.a84ed159b378acd7d9f2.js:7:302119
t@http://localhost:3000/public/build/0.a84ed159b378acd7d9f2.js:7:301793
[1620]/h</e.prototype.render@http://localhost:3000/public/build/0.a84ed159b378acd7d9f2.js:7:295060
[1620]/h</e.prototype.onDataReceived@http://localhost:3000/public/build/0.a84ed159b378acd7d9f2.js:7:294913
o.prototype.emit@http://localhost:3000/public/build/vendor.1f6280f6c83004ef1bab.js:44:25316
a</e.prototype.emit@http://localhost:3000/public/build/app.3095c117813e1134f897.js:1:13165
[1534]/f</e.prototype.handleQueryResult@http://localhost:3000/public/build/0.a84ed159b378acd7d9f2.js:7:18149
u@http://localhost:3000/public/build/vendor.1f6280f6c83004ef1bab.js:87:69119
l/<@http://localhost:3000/public/build/vendor.1f6280f6c83004ef1bab.js:87:69565
$digest@http://localhost:3000/public/build/vendor.1f6280f6c83004ef1bab.js:87:75262
$apply@http://localhost:3000/public/build/vendor.1f6280f6c83004ef1bab.js:87:77074
A/s<@http://localhost:3000/public/build/vendor.1f6280f6c83004ef1bab.js:87:73133
i@http://localhost:3000/public/build/vendor.1f6280f6c83004ef1bab.js:87:21976
me/l.defer/n<@http://localhost:3000/public/build/vendor.1f6280f6c83004ef1bab.js:87:23440
Hello,
Thank you for your great plugin, is there a way to have a graph history (like the number of alerts from the beginning) ?
Regards,
Calange
Hi,
In my dashboard I have variable $instance containing IP address of monitored host, for example 127.0.0.1
If I specify filter expression instance="$instance" then empty resultset is returned from the prometheus alert manager. In query inspector I can see that all dots in IP address escaped with two backslashes and than URI-encoded:
api/datasources/proxy/2/api/v1/alerts?silenced=false&inhibited=false&filter=instance%3D%22127%5C%5C.0%5C%5C.0%5C%5C.1%22"
and of course alert manager is unable to find alerts with instance=127\\.0\\.0\\.1
Investigating the issue I found that fix #40 added new function interpolateQueryExpr calling dsSpecialRegexEscape with very string escape functionality. I have no idea why so many escapes are required, but seems those escape function is the root cause of my issue.
Any chance getting it published?
Thanks!
Currently, only the labels are shown, but the annotations not. Typically, labels are used for the possibility to group items (in this case - alerts), not for displaying error messages, descriptions or URLs (for example: a link to a Wiki page).
Please add support for the alert annotations as well.
Thanks,
Alex
What happened:
On prometheus alertmanager, there are alerts, severity values are "MINOR".
On Grafana, set datasource is prometheus alertmanager, create a dashboard to show alerts got from alertmanager. Alerts are shown, but severity values are "-".
What you expected to happen:
On Grafana, in alerts table, severity values are the same with those on alertmanager, not "-".
How to reproduce it (as minimally and precisely as possible):
1.On Prometheus, there are pre-defined rules, including "severity: MINOR", "severity: MAJOR", "severity: CRITICAL".
2.Triger alerts, there are alerts shown on alertmanager.
3.On Grafana, set datasource is prometheus alertmanager, create a dashboard to show alerts got from alertmanager. Alerts are shown, but severity values are "-".
Anything else we need to know?:
I also modified Prometheus pre-defined rules severity value to number, such as "3".
Triger alerts, on Grafana, Alerts are shown, severity values are "3". That's correct.
So, I guess severity values only support number, not support string, need to enhance.
Environment:
•Grafana version: v6.2.2
•Grafana plugins: prometheus alertmanager v0.0.7
I've a panel with type table but severity column is blank. Is there a configuration on the datasource for severity?
On the Grafana plugins page for this plugin, the license is stated as MIT. However if you click the link, the license text is Apache v2.
How is this project actually licensed??
A declarative, efficient, and flexible JavaScript library for building user interfaces.
🖖 Vue.js is a progressive, incrementally-adoptable JavaScript framework for building UI on the web.
TypeScript is a superset of JavaScript that compiles to clean JavaScript output.
An Open Source Machine Learning Framework for Everyone
The Web framework for perfectionists with deadlines.
A PHP framework for web artisans
Bring data to life with SVG, Canvas and HTML. 📊📈🎉
JavaScript (JS) is a lightweight interpreted programming language with first-class functions.
Some thing interesting about web. New door for the world.
A server is a program made to process requests and deliver data to clients.
Machine learning is a way of modeling and interpreting data that allows a piece of software to respond intelligently.
Some thing interesting about visualization, use data art
Some thing interesting about game, make everyone happy.
We are working to build community through open source technology. NB: members must have two-factor auth.
Open source projects and samples from Microsoft.
Google ❤️ Open Source for everyone.
Alibaba Open Source for everyone
Data-Driven Documents codes.
China tencent open source team.