altinity / clickhouse-grafana Goto Github PK
View Code? Open in Web Editor NEWClickhouse datasource for grafana
License: MIT License
Clickhouse datasource for grafana
License: MIT License
Hello,
is it possible to add AdHoc filters similar to InfluxDB plugin?
Regards,
Vladimir
Hi, I have a click house table with the following schema:
UserID UInt32 lat Float64 lon Float64 city String country String countryCode String day Date DateTimeValue DateTime
Data Sample:

I will like to set WorldMap based on countryCode field.
So I did this:

I am getting the following answer in the Query Inspector:

{ "xhrStatus": "complete", "request": { "method": "GET", "url": "api/datasources/proxy/1/?query=select%20countryCode%2C%20%20count(*)%20%20from%20rizk.userlogin%20%20where%20day%20%3E%3D%20toDate(1525085178)%20AND%20DateTimeValue%20%3E%3D%20toDateTime(1525085178)%20group%20by%20countryCode%20%20%20FORMAT%20JSON" }, "response": { "meta": [ { "name": "countryCode", "type": "String" }, { "name": "count()", "type": "UInt64" } ], "data": [ { "countryCode": "GB", "count()": "5" }, { "countryCode": "NO", "count()": "13" }, { "countryCode": "NL", "count()": "8" }, { "countryCode": "AT", "count()": "1" }, { "countryCode": "DE", "count()": "17" }, { "countryCode": "FI", "count()": "27" }, { "countryCode": "SE", "count()": "15" }, { "countryCode": "NZ", "count()": "2" } ], "rows": 8, "statistics": { "elapsed": 0.001184305, "rows_read": 11146, "bytes_read": 137586 } } }
But as you can see the point are not displayed on the map.
Add autocomplete for columns while using sql editor
When doing joins like this
ANY LEFT JOIN table USING `column`The generated part of query is
ANY LEFT JOIN table USING FORMAT JSONInstead it should be
ANY LEFT JOIN table USING `column` FORMAT JSONI believe it has something to do with https://github.com/Vertamedia/clickhouse-grafana/blob/f56fb8d0d257d067dc22925ab0e573547224b64b/src/scanner.ts#L252
It doesn't skip double quoted identifiers.
ANY LEFT JOIN table USING "column"
->
ANY LEFT JOIN table USING "column" FORMAT JSON
But when stringRe value is modified to "('[^']*')|(`[^`]*`)|(\"[^\"]*\")", it skips them too. However reversed quotation marks should be used anyway http://clickhouse-docs.readthedocs.io/en/latest/query_language/syntax.html#identifiers
Changes introduced in #60 introduce a regression. Maybe make it configurable? Really useful otherwise, thanks for this!
(ping @vavrusa)
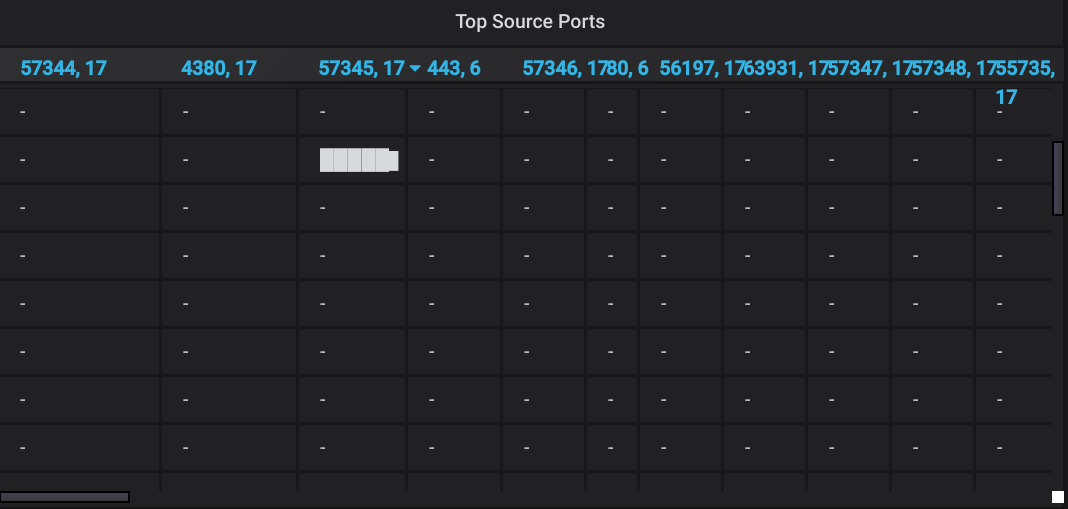
Example query:
SELECT
    1,
    srcPort,
    ipProto,
    count(*) * anyLast(sampleRate) AS packets,
    uniqHLL12(ipv4Dst) AS numDst,
    bar(packets, 0, 100000000, 10) AS bar
FROM $table
WHERE $timeFilter
GROUP BY srcPort, ipProto
ORDER BY packets DESC
LIMIT 100
Please consider adding support for alerts
May be it was broken in 1.4.1 or in 1.4.0.
Plugin got query and send it to Clickhouse without some symbols.
See resulting query. There is no comma here "AS t toRelativeMinuteNum"
Settings

Query
SELECT
    concat( smsc_id, ' (', server, ')' ) AS t,
    toRelativeMinuteNum(now()) - toRelativeMinuteNum(max(dt)) AS c
FROM $table
WHERE
    dt_part >= toDate(now()) - 1
    AND dt >= now() - 86400 * 1
    AND status = 'online'
GROUP BY t
HAVING c > 10
UNION ALL
SELECT
  concat( smsc_id, ' (', server, ')' ) AS t,
  toRelativeMinuteNum(now()) - toRelativeMinuteNum(min(dt)) AS c
FROM $table WHERE dt_part >= toDate(now()) - 7 AND dt >= now() - 86400 * 7 AND smsc_id NOT IN (
    SELECT smsc_id
    FROM $table
    WHERE
        dt_part >= toDate(now()) - 7
        AND dt >= now() - 86400 * 7
        AND status = 'online'
    GROUP BY smsc_id)
    GROUP BY t
Resulting query
SELECT concat(smsc_id, ' (', server, ')') AS t, toRelativeMinuteNum(now()) - toRelativeMinuteNum(max(dt)) AS c FROM gate.kannel_status WHERE dt_part >= toDate(now()) - 1 AND dt >= now() - 86400 * 1 AND status = 'online' GROUP BY t HAVING c > 10 UNION ALL SELECT concat(smsc_id, ' (', server, ')') AS t toRelativeMinuteNum(now()) - toRelativeMinuteNum(min(dt)) AS c FROM gate.kannel_status WHERE dt_part >= toDate(now()) - 7 AND dt >= now() - 86400 * 7 AND smsc_id NOT IN ( SELECT smsc_id FROM gate.kannel_status WHERE dt_part >= toDate(now()) - 7 AND dt >= now() - 86400 * 7 AND status = 'online' GROUP BY smsc_id) GROUP BY t
Target table
CREATE TABLE gate.kannel_status ( dt_part Date, dt DateTime, server String, smsc_id String, status Enum8(\'online\' = 1, \'connecting\' = 2, \'reconnecting\' = 3, \'dead\' = 4)) ENGINE = MergeTree(dt_part, dt, 8192)
There should be an additional "Minimum step" field that sets a lower bound for the auto interval/step.
Depending on timestamp precision, it can be necessary to specify a minimum step - there's no point in doing per-second aggregates when the precision of the underlying data is a multiple of that.
The latest clickhouse support customized partition, so date column is not a must, but the plugin data ranger filter is still based on date column if we don't have data column and use datatime column for both Colum:date and Column:datetime variable, so for range fiter:
where (event_time >= toDate(1518030541)) AND (event_time <= toDate(1522869530)) always return 0 records, should change to
where (event_time >= toDateTime(1518030541)) AND (event_time <= toDateTime(1522869530))
event_time is datetime column.
Thanks
I think it's easier to explain what I mean by example.
We are trying to store graphite data in clickhouse, but because if clickhouse's nature we need to construct our queries in something like that:
SELECT Path, Value, Time from graphite where Path IN ('path1', 'path2', 'path3')
Those 'path1', 'path2' stored in clickhouse in another table.
What we do now:
select groupUniqArray(Path) from graphite_tree where Path like 'path%'
and then use the results in an 'IN' clause.
With current grafana clickhouse plugin I was unable to find a way to get data and then reuse it in another query.
Hi, it seems you forgot to push sql_series.ts and the repo only contains generated .js and .d.js files.
Hello guys,
We installed Grafana and your plugin. We can successfully create a data source, but can't find the query editor. Any suggestions?
For
SELECT
  *
FROM (
  SELECT
    (
      SELECT sum(cnt)
      FROM $table
      WHERE $timeFilter
    ) as cnt
)
Generate
SELECT * FROM ( SELECT (SELECT sum(cnt)FROM DB.TableWHERE date >= toDate(1519467969) AND dateTime >= toDateTime(1519467969)) as cnt )Missing white space between 'DB.Table' and 'WHERE'
The doc has shown an example of $columns:
$columns(OSName, count(*) c) FROM requests
Sometimes, I need to group multi columns to find out differences, such as OS platform and version, I 'm wondering if this usage could be supported:
$columns(key_1, key_2, value) or $columns((key_1, key_2), value)
which query values as array of [key, value], where key will be used as label, and key is a combination of key_1 key_2.
Hello,
I have a table with number of columns of similar meaning (for example, count of errors by types, where each column represent certain error type).
Example:
┌───────date─┬────────────datetime─┬────metric1─┬────metric2─┬────metric3─┐
│ 2018-03-06 │ 2018-03-06 10:20:11 │ 3731493556 │ 3731493556 │ 3731493556 │
│ 2018-03-06 │ 2018-03-06 10:20:12 │  273977558 │  273977558 │  273977558 │
│ 2018-03-06 │ 2018-03-06 10:20:13 │ 4026407843 │ 4026407843 │ 4026407843 │
└────────────┴─────────────────────┴────────────┴────────────┴────────────┘
I want to place graphs based on data from all of these columns on single dashboard without hard-coding column names. As a result, if any column is added or removed, dashboard is rebuild automatically.
By default, datasource (or grafana itself, I don't remember exactly whose behavior it is) adds quotes to variable value if 'Multi-value' or 'Include All option' is used, so you cannot do something like SELECT $metric FROM table_name since SELECT 'metric1' FROM table_name will actually be executed.
For datasource v0.1 I hackishly implemented my own function $getColumnNameFromString, which simply removed all quotes from given variable, and used it like this:
select $timeSeries, $getColumnNameFromString($metric) from stats_table where $timeFilter for graphs repeated by $metric.
I would greatly appreciate if you could provide similar functionality (hopefully, in more convenient way than I have described).
I have a request
SELECT
    $timeSeries as t,
    count() as formatt
FROM $table
WHERE $timeFilter
GROUP BY t
ORDER BY t
Translated to
SELECT (intDiv(toUInt32(dateTime), 600) * 600) * 1000 as t, count() as FROM Table WHERE date >= toDate(1521110168) AND dateTime >= toDateTime(1521110168) GROUP BY t ORDER BY t FORMAT tActual JS generate unsorted keys after expand $columns macro
Real CH query without macroses should be available for copy&paste operations
Im trying to make a simple query:
SELECT
    $timeSeries as t,
    avg(response_time)
FROM logs.nginx
GROUP BY t
WHERE $timeFilter
This transformed into:
SELECT (intDiv(toUInt32(time_iso), 5) * 5) * 1000 as t, avg(response_time) FROM logs.nginx GROUP BY t WHERE log_date >= toDate(1501751601) AND time_iso >= toDateTime(1501751601)
And I got an error:
Code: 62, e.displayText() = DB::Exception: Syntax error: failed at position 120: WHERE log_date >= toDate(1501751601) AND time_iso >= toDateTime(1501751601) FORMAT JSON, expected end of query, e.what() = DB::Exception
In tabix.io this query is OK
Hello!
I have a query like:
SELECT
    datetime,
    queryName,
    responseCode
FROM $table
WHERE
    $timeFilter
    and queryName = 'stableit.ru'
LIMIT 5
And I just want to get a response in table format (i.e. single column for each field).
But by default I have following format:
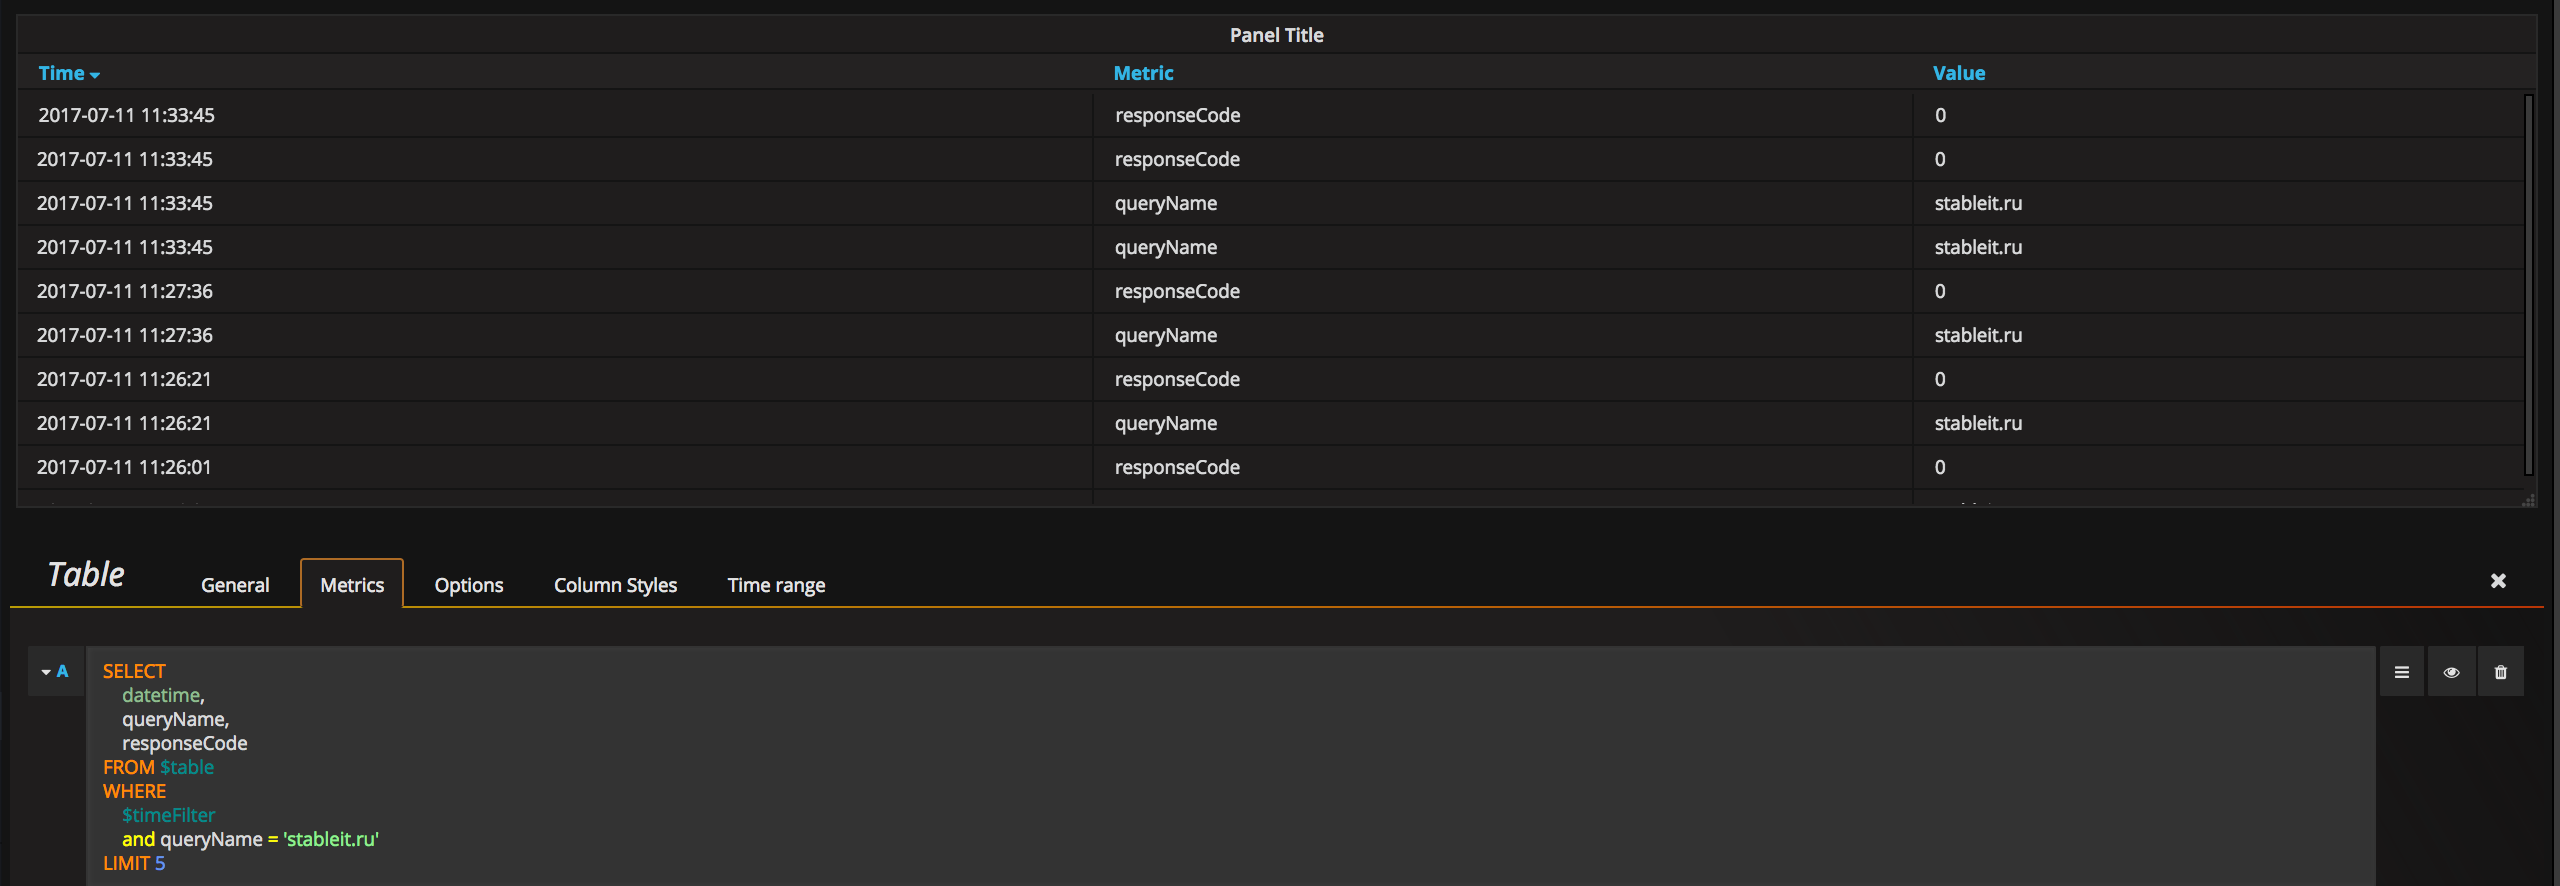
I tried to select "Table transform: table" but it does not work and reverts to "Table transform: Time Series to rows" immediately.
Is it possible you use your awesome plugin this way?
Plugin version: latest from Grafana.net.
Hi,
How can i use $timeFilter in templating query?
Now, vars not build in query.
Aleksey Shirokikh, [23.11.17 20:28]
@alexanderzobnin а можно в шаблонизатор графаны подставить такое вот
select
dictGetString('managedobject', 'name', managed_object) AS text,
managed_object as value
from
noc.subscriber
group by managed_object
Aleksey Shirokikh, [23.11.17 20:28]
я хочу выбирать красивое имя а в квери подставлять то чо надо
Aleksey Shirokikh, [23.11.17 20:29]
это запрос в кх
Alexander Zobnin, [23.11.17 20:29]
это SQL датасорс?
Aleksey Shirokikh, [23.11.17 20:30]
нет это vertamedia/ch
Aleksey Shirokikh, [23.11.17 20:33]
сейчас возвращается оба результата
Aleksey Shirokikh, [23.11.17 20:33]
что очевидно не помогает
Aleksey Shirokikh, [23.11.17 20:33]
и я смотрю на
https://github.com/Vertamedia/clickhouse-grafana/blob/5e8adabfb6c9e396f08c638d44cbb8306ef3df60/specs/lib/template_srv_stub.ts
и будто бы да
Alexander Zobnin, [23.11.17 20:34]
Видимо, нет, посмотрел в их код, они возвращают { text: value}
Aleksey Shirokikh, [23.11.17 20:34]
а как надо что бы да ?
Alexander Zobnin, [23.11.17 20:41]
Чтобы {text: myText, value: myValue}
Alexander Zobnin, [23.11.17 20:42]
Как здесь https://github.com/grafana/grafana/blob/master/public/app/plugins/datasource/postgres/response_parser.ts#L62
Please tell how install plugin to grafana 4.1.x?
$KPI = some_kpi_name
$d_kpi = _d
$n_kpi = _n
This example works ok:
SELECT $timeSeries as t, ($KPI$d_kpi/$KPI$n_kpi)*100 FROM $table WHERE $timeFilter and ucell_oid = $ucell_oid ORDER BY t
this is not:
$rateColumns(
    net_oid AS nets,
     (SUM($KPI$n_kpi)/SUM($KPI$d_kpi))*100 c)
FROM $table
ALL  INNER JOIN obj_ucell USING ucell_oid
After transform i get space between $KPI and $d_kpi
quantile function requires a float number between 0 - 1, e.g. 0.95, but it is formatted as 0 .95, note this space between 0 and .95.
$columns(process_name, quantile(0.95)(duration) duration) FROM xx
SELECT
  t, groupArray((process_name, duration)) as groupArr
FROM (
  SELECT
    (intDiv(toUInt32(event_datetime), 5) * 5) * 1000 as t,
    process_name,
    quantile(0 .95)(duration) duration
  FROM xx
  WHERE event_date >= toDate(1514966917) AND event_datetime >= toDateTime(1514966917)
  GROUP BY t, process_name  ORDER BY t, process_name
) GROUP BY t ORDER BY t FORMAT JSON


HI,
WorldMap plugin for grafana allows to map geohash data formatted as a table (using InfluxDb datasource)
https://github.com/grafana/worldmap-panel#table-data-as-the-data-source
It would be nice to have this feature, if possible.
Thanks.
Macro $timeFilter generates something like
time_date BETWEEN toDate(1524736800) AND toDate(1524823200)
AND time BETWEEN toDateTime(1524736800) AND toDateTime(1524823200)
I need to make a comparison between values from last week (-7 days against now)
The way I plan to approach is to make a SELECT for NOW and then join the same SELECT with timeFilter shifted by 7 days back. Is there a way to nicely shift $timeFilter by interval?
Or do I have to type something like
$timeCol BETWEEN toDate($from - 604800) AND toDate($to - 604800)
AND $dateTimeCol BETWEEN toDateTime($from - 604800) AND toDateTime($to - 604800)
Thanks
carbon-clickhouse uses a Timestamp column, not DateTime. It would be nice if we could use that in the query editor.
thanks,
bernd
I have tried the query from #33 (comment)
$columns(
    concat(toString(myid), '-','x') l,
    count(*) c)
FROM $table
ANY INNER JOIN mysecondtable USING myid
However I'm getting error
Code: 62, e.displayText() = DB::Exception: Syntax error: failed at position 1: $columns( concat(toString(myid), '-', 'test') l, count(*) c) FROM mytable ANY INNER JOIN mysecondtable USING myid FORMAT JSON. Unrecognized token, e.what() = DB::Exception
It seems like the plugin didn't transform it into query for some reason. Using v1.3.1. Thanks for help!
When I do this, it works
$columns(
    concat(toString(myid), '-','x') l,
    count(*) c)
FROM $tablebefore I choose a database and a table, it auto jumps to the demo sql.
Hello
I've seen some weird behavior using clickhouse-grafana data source, it gets the last point from backend correctly, but it shows another value on the graph. But for other points it's showing the correct value. And this patterns is repeated for every last point.
Here are the screenshots


плагин отправляет запросы вида
SELECT t,
       groupArray((App,C/10))
FROM
  (SELECT (intDiv(toUInt32(EventTime), 3600) * 3600) * 1000 AS t,
          CASE
              WHEN ApplicationID = 12 THEN 'XXX'
              WHEN ApplicationID = 30 THEN 'XXX mobile'
              ELSE 'Other'
          END AS App,
          SUM(Impressions) AS C
   FROM metrics.metrics
   WHERE EventDate >= toDate(1500715771)
     AND EventTime >= toDateTime(1500715771)
   GROUP BY t,
            App
   ORDER BY t,
            App)
GROUP BY t
ORDER BY t FORMAT JSON
$from вставляется в toDate и toDateTime (toDate(1500715771), toDateTime(1500715771))
$from меняется каждые N секунд указаные в параметре рефреша
проблема в том, что если открыто 10 окон то будет 10 разных $from т.к. открыты они были в разное время (допустим с шагом в 1 секунду)
хотелось бы таймстамп начала "сессии" затранкейтить чтоб уменьшить количество уникальных запросов и закешировать их на nginx
Currently, credentials to access CH can be passed via basic auth. But sometimes its needed to separate basic auth credntials and CH.
Please publish version 1.4.0 to the Grafana plugin site:
https://grafana.com/plugins/vertamedia-clickhouse-datasource
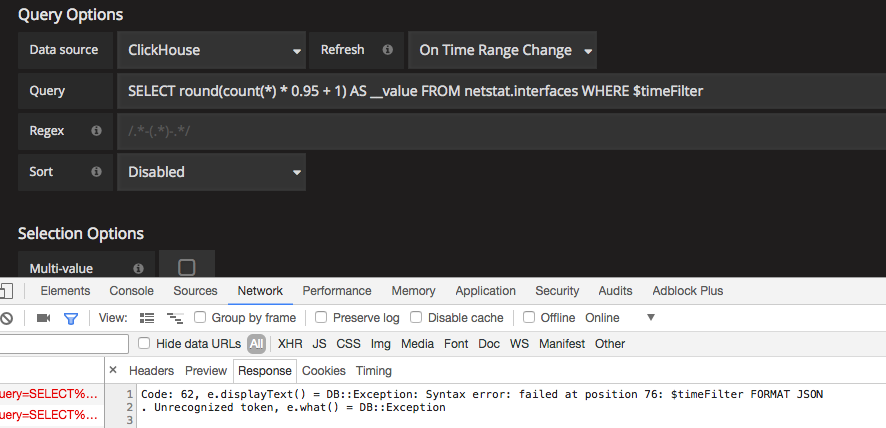
Is it possible to use time range filter (i.e. $from, $to or $timeFilter) in template query?
In Grafana documentation I see "Set this only to On Time Range Change if your variable options query contains a time range filter or is dependent on dashboard time range."
But when I try to use time range filter ($from, $to or $timeFilter) in template query it sends query to CH as is, without replacing $from, $to or $timeFilter
New grafana allows administrators to use conf/provisioning/datasources/something_here.yaml mechanism to provide datasources through configuration tools (e.g. ansible).
I'm trying to construct a valid yaml to describe a proper configuration, but it's hard. Could you add example into documentation somewhere, please?
My current best efforts:
apiVersion: 1

datasources:
  - name: ClickHouse
    type: vertamedia-clickhouse-datasource
    access: proxy
    basicAuth: true
    url: http://127.0.0.1:8123
Things I don't know how to set up:
defaultDatabase:
User:
Password: (both for basicAuth mode).
Thanks!
Is there a way to use macros like $from or $to in Query Variables? The plugin doesn't seem to replace it in the query.
When grafana time selector is set for example to 'Yesterday' (2017-11-18 00:00:00 to 2017-11-18 23:59:59), 'WHERE $timeFilter' is expanded to:
WHERE event_date BETWEEN toDate(1510963200) AND toDate(1511049600) AND event_time BETWEEN toDateTime(1510963200) AND toDateTime(1511049600)
so event_date will be from 18-11-2017 to 19-11-2017 and event_time will be from 18-11-2017 00:00:00 to 19-11-2017 00:00:00 inclusive.
The right part of the time expression should be either exclusive or value of timestamp decreased by 1 second.
Macros $columns stop working for new panels between version 1.4.1 and version 1.4.3
SELECT
    $timeSeries as t,
    $columns(severity s, count() c)
FROM $table
WHERE facility=22 AND $timeFilter
Converts to
SELECT (intDiv(toUInt32(time), 60) * 60) * 1000 as t, $columns(severity s, count() c) FROM test_logs.test_events WHERE facility=22 AND date >= toDate(1524144310) AND time >= toDateTime(1524144310)
With this one can pre-program not only possible fields to display but also some functions like max(field1, field2)
If you do that now resulting SQL will contain max(field1, field2'): note single quote.
It will be nice if CH plugin (graph) support Alert like this

$timeCol macro now represents date column
replaced with Date:Col value from Query Builder
Shouldn't it be named $dateCol then to avoid confusion?
Пробовал задать Templating/Variables, но это получилось использовать только как sql-фильтр вроде
... and('All' in ($geo_country) or geo_country in ($geo_country)) ...
PS: в плагине grafana-zabbix, например, возможность множить линии графика была.
Grafana ignoring NULL value is clickhouse send "NULL" but works if manual send "null"
Is it possible to make graph for current period and from previous month for example?
I tried to use Series Overrides but it seems like it doesn't work.
Hi, is there a way to user a interval variable type?
I like to have 30 minutes min interval. Thanks.
A declarative, efficient, and flexible JavaScript library for building user interfaces.
🖖 Vue.js is a progressive, incrementally-adoptable JavaScript framework for building UI on the web.
TypeScript is a superset of JavaScript that compiles to clean JavaScript output.
An Open Source Machine Learning Framework for Everyone
The Web framework for perfectionists with deadlines.
A PHP framework for web artisans
Bring data to life with SVG, Canvas and HTML. 📊📈🎉
JavaScript (JS) is a lightweight interpreted programming language with first-class functions.
Some thing interesting about web. New door for the world.
A server is a program made to process requests and deliver data to clients.
Machine learning is a way of modeling and interpreting data that allows a piece of software to respond intelligently.
Some thing interesting about visualization, use data art
Some thing interesting about game, make everyone happy.
We are working to build community through open source technology. NB: members must have two-factor auth.
Open source projects and samples from Microsoft.
Google ❤️ Open Source for everyone.
Alibaba Open Source for everyone
Data-Driven Documents codes.
China tencent open source team.