Altinity ClickHouse datasource plugin provides a support for ClickHouse as a backend database.
Initially plugin developed by Vertamedia, maintaned by Altinity since 2020.
Old versions of Altinity ClickHouse datasource plugin for Grafana written in Angular. So you can watch warning like
Angular plugin
This data source plugin uses a deprecated, legacy platform based on AngularJS and will stop working in future releases of Grafana.
Don't worry about warning message, plugin will still working until Grafana 11 will release, after it upgrade to Altinity ClickHouse datasource plugin for Grafana to 3.x version is required.
When 2.0.x and 2.1.x vertamedia-clickhouse-grafana plugin versions released Grafana team didn't provide worked signing method for community plugins. Current sign process describe on grafana.com
so, for properly setup 2.0.x and 2.1.x plugins you need change configuration option
[plugins]
allow_loading_unsigned_plugins=vertamedia-clickhouse-datasource
or setup environment variable
GF_PLUGINS_ALLOW_LOADING_UNSIGNED_PLUGINS=vertamedia-clickhouse-datasourceYou can install plugin from grafana.com
OR
Copy files to your Grafana plugin directory. Restart Grafana, check data sources list at Configuration -> Datasources -> New, choose ClickHouse option.


- Access to CH via HTTP / HTTPS
- Query setup
- Raw SQL editor
- Query formatting
- Macros support
- Additional functions
- Templates
- Table view
- SingleStat view
- Ad-hoc filters
- Annotations
- Alerts support
- Logs support
- Flamegraph support
- Traces support
Page configuration is standard

There is a small feature - ClickHouse treats HTTP Basic Authentication credentials as a database user and will try to run queries using its name.
CHProxy (optional)
Using of CHProxy will bring additional features:
- Easily setup
HTTPSaccess to ClickHouse as shown here to provide secure access. - Limit concurrency and execution time for requests from
Grafanaas shown here to preventClickHouseoverloading fromGrafana. - Protection against request bursts for dashboards with numerous graphs.
CHProxyallows queueing requests and execute them sequentially. To learn more - read about paramsmax_queue_sizeandmax_queue_timeat CHProxy page. - Response caching for the most frequent queries as shown here.
Caching will protect ClickHouse from excessive refreshes and will be optimal option for popular dashboards.
Hint - if you need to cache requests like
last 24hwhere timestamp changes constantly then try to useRoundoption atRaw Editor
Query setup interface:

First row FROM contains two options: database and table. Table values depends on a selected database.
Next rows contains selectors for time filtering:
Column timestamp time
- DateTime (DateTime)
- DateTime64 (DateTime64)
- TimeStamp (UInt32).
Timestamp column Date column
Timestmap columnare required for time-based macros and functions because all analytics based on these values. Plugin will try to detect Date, Date32 column automatically
Button Go to Query is just a toggler to Raw SQL Editor
Raw Editor allows custom SQL queries to be written:

Raw Editor allows typing queries, get info about functions and macros, format queries as Clickhouse do. To Execute query on server press "Run Query" or just leave focus from SQL editor textarea.
Under the Editor you can find options which allows setup rounding, time column step
and Add metadata to SQL query which allows know which dashboard and user produce workload to your ClickHouse server.
Press Show Generated SQL for see a raw query (all macros and functions have already been replaced) which will be sent directly to ClickHouse.

Plugin supports the following marcos:
- $table - replaced with selected table name from Query Builder
- $dateCol - replaced with
Column:Datevalue from Query Builder - $dateTimeCol - replaced with
Column:DateTimeorColumn:TimeStampvalue from Query Builder - $from - replaced with (timestamp with ms)/1000 value of UI selected "Time Range:From"
- $to - replaced with (timestamp with ms)/1000 value of UI selected "Time Range:To"
- $interval - replaced with selected "Group by a time interval" value (as a number of seconds)
- $timeFilter - replaced with currently selected "Time Range". Requires Column:Date and Column:DateTime or Column:TimeStamp to be selected.
- $timeFilterByColumn($column) - replaced with currently selected "Time Range" for a column passed as
$columnargument. Use it in queries or query variables as...WHERE $timeFilterColumn($column)...or...WHERE $timeFilterColumn(created_at).... - $timeSeries - replaced with special ClickHouse construction to convert results as time-series data. Use it as "SELECT $timeSeries...".
- $naturalTimeSeries - replaced with special ClickHouse construction to convert results as time-series with in a logical/natural breakdown. Use it as "SELECT $naturalTimeSeries...".
- $unescape - unescapes variable value by removing single quotes. Used for multiple-value string variables: "SELECT $unescape($column) FROM requests WHERE $unescape($column) = 5"
- $adhoc - replaced with a rendered ad-hoc filter expression, or "1" if no ad-hoc filters exist. Since ad-hoc applies automatically only to outer queries the macros can be used for filtering in inner queries.
A description of macros is available by typing their names in Raw Editor
Functions are just templates of SQL queries, and you can check the final query at Raw SQL Editor mode. If you need some additional complexity - just copy raw sql into Raw Editor and make according changes. Remember that macros are still available to use.
There are some limits in function use because of poor query analysis:
- Column:Date and Column:DateTime or Column:TimeStamp must be set in Query Builder
- Query must begin from function name
- Only one function can be used per query
Plugin supports the following functions:
Example usage:
$rate(countIf(Type = 200) AS good, countIf(Type != 200) AS bad) FROM requestsQuery will be transformed into:
SELECT
    t,
    good / runningDifference(t / 1000) AS goodRate,
    bad / runningDifference(t / 1000) AS badRate
FROM
(
    SELECT
        (intDiv(toUInt32(EventTime), 60)) * 1000 AS t,
        countIf(Type = 200) AS good,
        countIf(Type != 200) AS bad
    FROM requests
    WHERE ((EventDate >= toDate(1482796747)) AND (EventDate <= toDate(1482853383))) AND ((EventTime >= toDateTime(1482796747)) AND (EventTime <= toDateTime(1482853383)))
    GROUP BY t
    ORDER BY t
)Example usage:
$columns(OSName, count(*) c)
FROM requests
INNER JOIN oses USING (OS)
Query will be transformed into:
SELECT
    t,
    groupArray((OSName, c)) AS groupArr
FROM
(
    SELECT
        (intDiv(toUInt32(EventTime), 60) * 60) * 1000 AS t,
        OSName,
        count(*) AS c
    FROM requests
    INNER JOIN oses USING (OS)
    WHERE ((EventDate >= toDate(1482796627)) AND (EventDate <= toDate(1482853383))) AND ((EventTime >= toDateTime(1482796627)) AND (EventTime <= toDateTime(1482853383)))
    GROUP BY
        t,
        OSName
    ORDER BY
        t,
        OSName
)
GROUP BY t
ORDER BY t
This will help to build the next graph:

Example usage:
$rateColumns(OS, count(*) c) FROM requestsQuery will be transformed into:
SELECT
    t,
    arrayMap(lambda(tuple(a), (a.1, a.2 / runningDifference(t / 1000))), groupArr)
FROM
(
    SELECT
        t,
        groupArray((OS, c)) AS groupArr
    FROM
    (
        SELECT
            (intDiv(toUInt32(EventTime), 60) * 60) * 1000 AS t,
            OS,
            count(*) AS c
        FROM requests
        WHERE ((EventDate >= toDate(1482796867)) AND (EventDate <= toDate(1482853383))) AND ((EventTime >= toDateTime(1482796867)) AND (EventTime <= toDateTime(1482853383)))
        GROUP BY
            t,
            OS
        ORDER BY
            t,
            OS
    )
    GROUP BY t
    ORDER BY t
)
$rateColumnsAggregated(key, subkey, aggFunction1, value1, ... aggFunctionN, valueN) - if you need calculate rate for higher cardinality dimension and then aggregate by lower cardinality dimension
Example usage:
$rateColumnsAggregated(datacenter, concat(datacenter,interface) AS dc_interface, sum, tx_bytes * 1014 AS tx_kbytes, sum, max(rx_bytes) AS rx_bytes) FROM trafficQuery will be transformed into:
SELECT
    t,
    datacenter,
    sum(tx_kbytesRate) AS tx_bytesRateAgg,
    sum(rx_bytesRate) AS rx_bytesRateAgg
FROM
(
    SELECT
        t,
        datacenter,
        dc_interface,
        tx_kbytes / runningDifference(t / 1000) AS tx_kbytesRate,
        rx_bytes / runningDifference(t / 1000) AS rx_bytesRate
    FROM
    (
        SELECT
            (intDiv(toUInt32(event_time), 60) * 60) * 1000 AS t,
            datacenter,
            concat(datacenter,interface) AS dc_interface,
            max(tx_bytes * 1024) AS tx_kbytes,
            max(rx_bytes) AS rx_bytes
        FROM traffic
        WHERE ((event_date >= toDate(1482796867)) AND (event_date <= toDate(1482853383)))
          AND ((event_time >= toDateTime(1482796867)) AND (event_time <= toDateTime(1482853383)))
        GROUP BY
            t,
            datacenter,
            dc_interface
        ORDER BY
            t,
            datacenter,
            dc_interface
    )
)
GROUP BY
  t,
  datacenter
ORDER BY
  datacenter,
  t
look issue 386 for reasons for implementation
$perSecond(cols...) - converts query results as "change rate per interval" for Counter-like(growing only) metrics
Example usage:
$perSecond(Requests) FROM requestsQuery will be transformed into:
SELECT
    t,
    if(runningDifference(max_0) < 0, nan, runningDifference(max_0) / runningDifference(t / 1000)) AS max_0_PerSecond
FROM
(
    SELECT
        (intDiv(toUInt32(EventTime), 60) * 60) * 1000 AS t,
        max(Requests) AS max_0
    FROM requests
    WHERE ((EventDate >= toDate(1535711819)) AND (EventDate <= toDate(1535714715)))
    AND ((EventTime >= toDateTime(1535711819)) AND (EventTime <= toDateTime(1535714715)))
    GROUP BY t
    ORDER BY t
)
// see issue 78 for the background
$perSecondColumns(key, value) - is a combination of $columns and $perSecond for Counter-like metrics
Example usage:
$perSecondColumns(Protocol, Requests) FROM requests WHERE Protocol in ('udp','tcp')Query will be transformed into:
SELECT
    t,
    groupArray((perSecondColumns, max_0_PerSecond)) AS groupArr
FROM
(
    SELECT
        t,
        Protocol,
        if(runningDifference(max_0) < 0 OR neighbor(perSecondColumns,-1,perSecondColumns) != perSecondColumns, nan, runningDifference(max_0) / runningDifference(t / 1000)) AS max_0_PerSecond
    FROM
    (
        SELECT
            (intDiv(toUInt32(EventTime), 60) * 60) * 1000 AS t,
            Protocol AS perSecondColumns,
            max(Requests) AS max_0
        FROM requests
        WHERE ((EventDate >= toDate(1535711819)) AND (EventDate <= toDate(1535714715)))
        AND ((EventTime >= toDateTime(1535711819)) AND (EventTime <= toDateTime(1535714715)))
        AND (Protocol IN ('udp', 'tcp'))
        GROUP BY
            t,
            Protocol
        ORDER BY
            t,
            Protocol
    )
)
GROUP BY t
ORDER BY t
// see issue 80 for the background
$perSecondColumnsAggregated(key, subkey, aggFunction1, value1, ... aggFunctionN, valueN) - if you need to calculate perSecond for higher cardinality dimension and then aggregate by lower cardinality dimension
Example usage:
$perSecondColumnsAggregated(datacenter, concat(datacenter,interface) AS dc_interface, sum, tx_bytes * 1014 AS tx_kbytes, sum, max(rx_bytes) AS rx_bytes) FROM trafficQuery will be transformed into:
SELECT
    t,
    datacenter,
    sum(tx_kbytesPerSecond) AS tx_bytesPerSecondAgg,
    sum(rx_bytesPerSecond) AS rx_bytesPerSecondAgg
FROM
(
    SELECT
        t,
        datacenter,
        dc_interface,
        if(runningDifference(tx_kbytes) < 0 OR neighbor(tx_kbytes,-1,tx_kbytes) != tx_kbytes, nan, runningDifference(tx_kbytes) / runningDifference(t / 1000)) AS tx_kbytesPerSecond,
        if(runningDifference(rx_bytes) < 0 OR neighbor(rx_bytes,-1,rx_bytes) != rx_bytes, nan, runningDifference(rx_bytes) / runningDifference(t / 1000)) AS rx_bytesPerSecond
    FROM
    (
        SELECT
            (intDiv(toUInt32(event_time), 60) * 60) * 1000 AS t,
            datacenter,
            concat(datacenter,interface) AS dc_interface,
            max(tx_bytes * 1024) AS tx_kbytes,
            max(rx_bytes) AS rx_bytes
        FROM traffic
        WHERE ((event_date >= toDate(1482796867)) AND (event_date <= toDate(1482853383)))
          AND ((event_time >= toDateTime(1482796867)) AND (event_time <= toDateTime(1482853383)))
        GROUP BY
            t,
            datacenter,
            dc_interface
        ORDER BY
            t,
            datacenter,
            dc_interface
    )
)
GROUP BY
  t,
  datacenter
ORDER BY
  datacenter,
  t
look issue 386 for reasons for implementation
$delta(cols...) - converts query results as "delta value inside interval" for Counter-like(growing only) metrics, will negative if counter reset
Example usage:
$delta(Requests) FROM requestsQuery will be transformed into:
SELECT
    t,
    runningDifference(max_0) AS max_0_Delta
FROM
(
    SELECT
        (intDiv(toUInt32(EventTime), 60) * 60) * 1000 AS t,
        max(Requests) AS max_0
    FROM requests
    WHERE ((EventDate >= toDate(1535711819)) AND (EventDate <= toDate(1535714715)))
    AND ((EventTime >= toDateTime(1535711819)) AND (EventTime <= toDateTime(1535714715)))
    GROUP BY t
    ORDER BY t
)
// see issue 455 for the background
Example usage:
$deltaColumns(Protocol, Requests) FROM requests WHERE Protocol in ('udp','tcp')Query will be transformed into:
SELECT
    t,
    groupArray((deltaColumns, max_0_Delta)) AS groupArr
FROM
(
    SELECT
        t,
        deltaColumns,
        if (neighbor(deltaColumns,-1,deltaColumns) != deltaColumns, 0, runningDifference(max_0)) AS max_0_Delta
    FROM
    (
        SELECT
            (intDiv(toUInt32(EventTime), 60) * 60) * 1000 AS t,
            Protocol AS deltaColumns,
            max(Requests) AS max_0
        FROM requests
        WHERE ((EventDate >= toDate(1535711819)) AND (EventDate <= toDate(1535714715)))
        AND ((EventTime >= toDateTime(1535711819)) AND (EventTime <= toDateTime(1535714715)))
        AND (Protocol IN ('udp', 'tcp'))
        GROUP BY
            t,
            Protocol
        ORDER BY
            t,
            Protocol
    )
)
GROUP BY t
ORDER BY t
// see issue 455 for the background
$deltaColumnsAggregated(key, subkey, aggFunction1, value1, ... aggFunctionN, valueN) - if you need to calculate delta for higher cardinality dimension and then aggregate by lower cardinality dimension
Example usage:
$deltaColumnsAggregated(datacenter, concat(datacenter,interface) AS dc_interface, sum, tx_bytes * 1014 AS tx_kbytes, sum, max(rx_bytes) AS rx_bytes) FROM trafficQuery will be transformed into:
SELECT
    t,
    datacenter,
    sum(tx_kbytesDelta) AS tx_bytesDeltaAgg,
    sum(rx_bytesDelta) AS rx_bytesDeltaAgg
FROM
(
    SELECT
        t,
        datacenter,
        dc_interface,
        if(neighbor(tx_kbytes,-1,tx_kbytes) != tx_kbytes, 0, runningDifference(tx_kbytes) / 1) AS tx_kbytesDelta,
        if(neighbor(rx_bytes,-1,rx_bytes) != rx_bytes, 0, runningDifference(rx_bytes) / 1) AS rx_bytesDelta
    FROM
    (
        SELECT
            (intDiv(toUInt32(event_time), 60) * 60) * 1000 AS t,
            datacenter,
            concat(datacenter,interface) AS dc_interface,
            max(tx_bytes * 1024) AS tx_kbytes,
            max(rx_bytes) AS rx_bytes
        FROM traffic
        WHERE ((event_date >= toDate(1482796867)) AND (event_date <= toDate(1482853383)))
          AND ((event_time >= toDateTime(1482796867)) AND (event_time <= toDateTime(1482853383)))
        GROUP BY
            t,
            datacenter,
            dc_interface
        ORDER BY
            t,
            datacenter,
            dc_interface
    )
)
GROUP BY
  t,
  datacenter
ORDER BY
  datacenter,
  t
look issue 386 for reasons for implementation
$increase(cols...) - converts query results as "non-negative delta value inside interval" for Counter-like(growing only) metrics, will zero if counter reset and delta less zero
Example usage:
$increase(Requests) FROM requestsQuery will be transformed into:
SELECT
    t,
    if(runningDifference(max_0) < 0, 0, runningDifference(max_0) ) AS max_0_Increase
FROM
(
    SELECT
        (intDiv(toUInt32(EventTime), 60) * 60) * 1000 AS t,
        max(Requests) AS max_0
    FROM requests
    WHERE ((EventDate >= toDate(1535711819)) AND (EventDate <= toDate(1535714715)))
    AND ((EventTime >= toDateTime(1535711819)) AND (EventTime <= toDateTime(1535714715)))
    GROUP BY t
    ORDER BY t
)
// see issue 455 for the background
Example usage:
$increaseColumns(Protocol, Requests) FROM requests WHERE Protocol in ('udp','tcp')Query will be transformed into:
SELECT
    t,
    groupArray((increaseColumns, max_0_Increase)) AS groupArr
FROM
(
    SELECT
        t,
        Protocol,
        if (runningDifference(max_0) < 0 OR neighbor(increaseColumns,-1,increaseColumns) != increaseColumns, 0, runningDifference(max_0)) AS max_0_Increase
    FROM
    (
        SELECT
            (intDiv(toUInt32(EventTime), 60) * 60) * 1000 AS t,
            Protocol AS increaseColumns,
            max(Requests) AS max_0
        FROM requests
        WHERE ((EventDate >= toDate(1535711819)) AND (EventDate <= toDate(1535714715)))
        AND ((EventTime >= toDateTime(1535711819)) AND (EventTime <= toDateTime(1535714715)))
        AND (Protocol IN ('udp', 'tcp'))
        GROUP BY
            t,
            Protocol
        ORDER BY
            t,
            Protocol
    )
)
GROUP BY t
ORDER BY t
// see issue 455 for the background
$increaseColumnsAggregated(key, subkey, aggFunction1, value1, ... aggFunctionN, valueN) - if you need to calculate increase for higher cardinality dimension and then aggregate by lower cardinality dimension
Example usage:
$increaseColumnsAggregated(datacenter, concat(datacenter,interface) AS dc_interface, sum, tx_bytes * 1014 AS tx_kbytes, sum, max(rx_bytes) AS rx_bytes) FROM trafficQuery will be transformed into:
SELECT
    t,
    datacenter,
    sum(tx_kbytesIncrease) AS tx_bytesIncreaseAgg,
    sum(rx_bytesIncrease) AS rx_bytesIncreaseAgg
FROM
(
    SELECT
        t,
        datacenter,
        dc_interface,
        if(runningDifference(tx_kbytes) < 0 OR neighbor(tx_kbytes,-1,tx_kbytes) != tx_kbytes, nan, runningDifference(tx_kbytes) / 1) AS tx_kbytesIncrease,
        if(runningDifference(rx_bytes) < 0 OR neighbor(rx_bytes,-1,rx_bytes) != rx_bytes, nan, runningDifference(rx_bytes) / 1) AS rx_bytesIncrease
    FROM
    (
        SELECT
            (intDiv(toUInt32(event_time), 60) * 60) * 1000 AS t,
            datacenter,
            concat(datacenter,interface) AS dc_interface,
            max(tx_bytes * 1024) AS tx_kbytes,
            max(rx_bytes) AS rx_bytes
        FROM traffic
        WHERE ((event_date >= toDate(1482796867)) AND (event_date <= toDate(1482853383)))
          AND ((event_time >= toDateTime(1482796867)) AND (event_time <= toDateTime(1482853383)))
        GROUP BY
            t,
            datacenter,
            dc_interface
        ORDER BY
            t,
            datacenter,
            dc_interface
    )
)
GROUP BY
  t,
  datacenter
ORDER BY
  datacenter,
  t
look issue 386 for reasons for implementation
If you add a template variable of the type Query, you can write a ClickHouse query that can
return things like measurement names, key names or key values that are shown as a dropdown select box.
For example, you can have a variable that contains all values for the hostname column in a table if you specify a query like this in the templating variable Query setting.
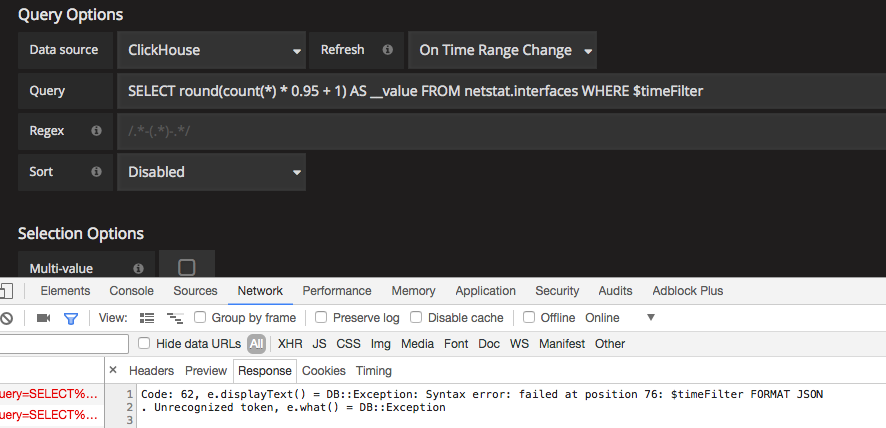
SELECT hostname FROM hostTo use time range dependent macros like timeFilterByColumn($column) in your query the refresh mode of the template variable needs to be set to On Time Range Change.
SELECT event_name FROM event_log WHERE $timeFilterByColumn(time_column)Another option is a query that can create a key/value variable. The query should return two columns that are named __text and __value. The __text column value should be unique (if it is not unique then the first value will use). The options in the dropdown will have a text and value that allows you to have a friendly name as text and an id as the value. An example query with hostname as the text and id as the value:
SELECT hostname AS __text, id AS __value FROM hostYou can also create nested variables. For example if you had another variable named region. Then you could have the hosts variable only show hosts from the current selected region with a query like this (if region is a multi-value variable then use the IN comparison operator rather than = to match against multiple values):
SELECT hostname FROM host WHERE region IN ($region)If you are using templating to feed your predicate, you will face performance degradation when everything will select as the predicate, and it's not necessary. It's also true for textbox when nothing is entered, you have to write specific sql code to handle that.
To resolve this issue a new macro $conditionalTest(SQL Predicate,$variable) can be used to remove some part of the query. If the variable is type query with all selected or if the variable is a textbox with nothing enter, then the SQL Predicate is not include in the generated query.
To give an example: with 2 variables $var query with include All option $text textbox $text_with_single_quote textbox with single quote
The following query
 SELECT
   $timeSeries as t,
   count()
   FROM $table
   WHERE $timeFilter
    $conditionalTest(AND toLowerCase(column) in ($var),$var)
    $conditionalTest(AND toLowerCase(column2) like '%$text%',$text)
    $conditionalTest(AND toLowerCase(column3) ilike ${text_with_single_quote:sqlstring},$text_with_single_quote)
   GROUP BY t
   ORDER BY t
if the $var is selected as "All" value, and the $text variable is empty, the query will be converted into:
  SELECT
    $timeSeries as t,
    count()
     FROM $table
     WHERE $timeFilter
   GROUP BY t
   ORDER BY t
If the $var template variable have select some elements, and the $text template variable has at least one char, the query will be converted into:
SELECT
    $timeSeries as t,
    count()
     FROM $table
     WHERE $timeFilter
   AND toLowerCase(column) in ($var)
   AND toLowerCase(column2) like '%$text%'
   GROUP BY t
ORDER BY tRemember that pie chart plugin is not welcome for using in grafana - see Grafana BLog - Friends don't let friends abuse pie charts

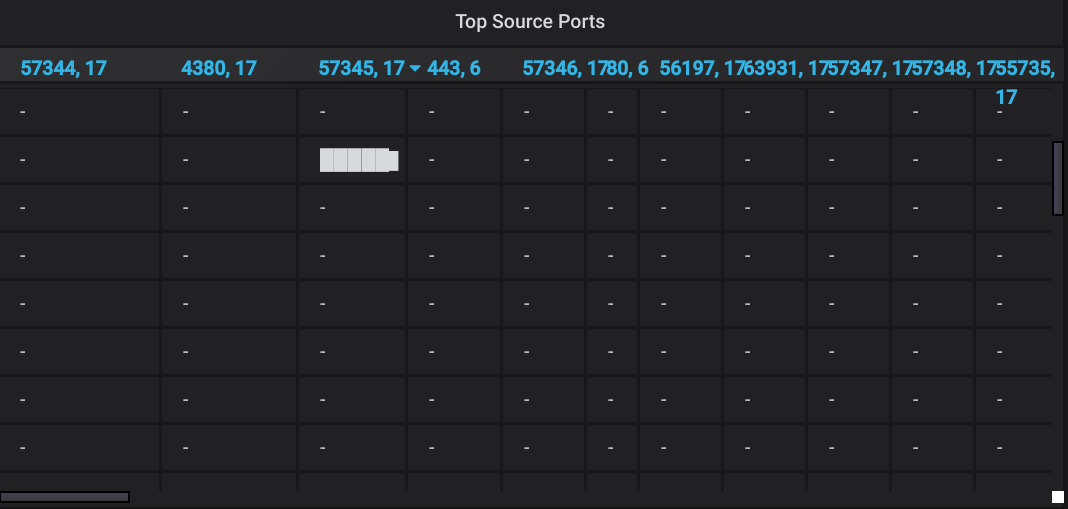
To create "Top 5" diagram we will need two queries: one for 'Top 5' rows and one for 'Other' row.
Top5:
SELECT
    1 AS t, /* fake timestamp value */
    UserName,
    sum(Requests) AS Reqs
FROM requests
GROUP BY t, UserName
ORDER BY Reqs DESC
LIMIT 5
Other:
SELECT
1 AS t, /* fake timestamp value */
UserName,
sum(Requests) AS Reqs
FROM requests
GROUP BY t, UserName
ORDER BY Reqs DESC
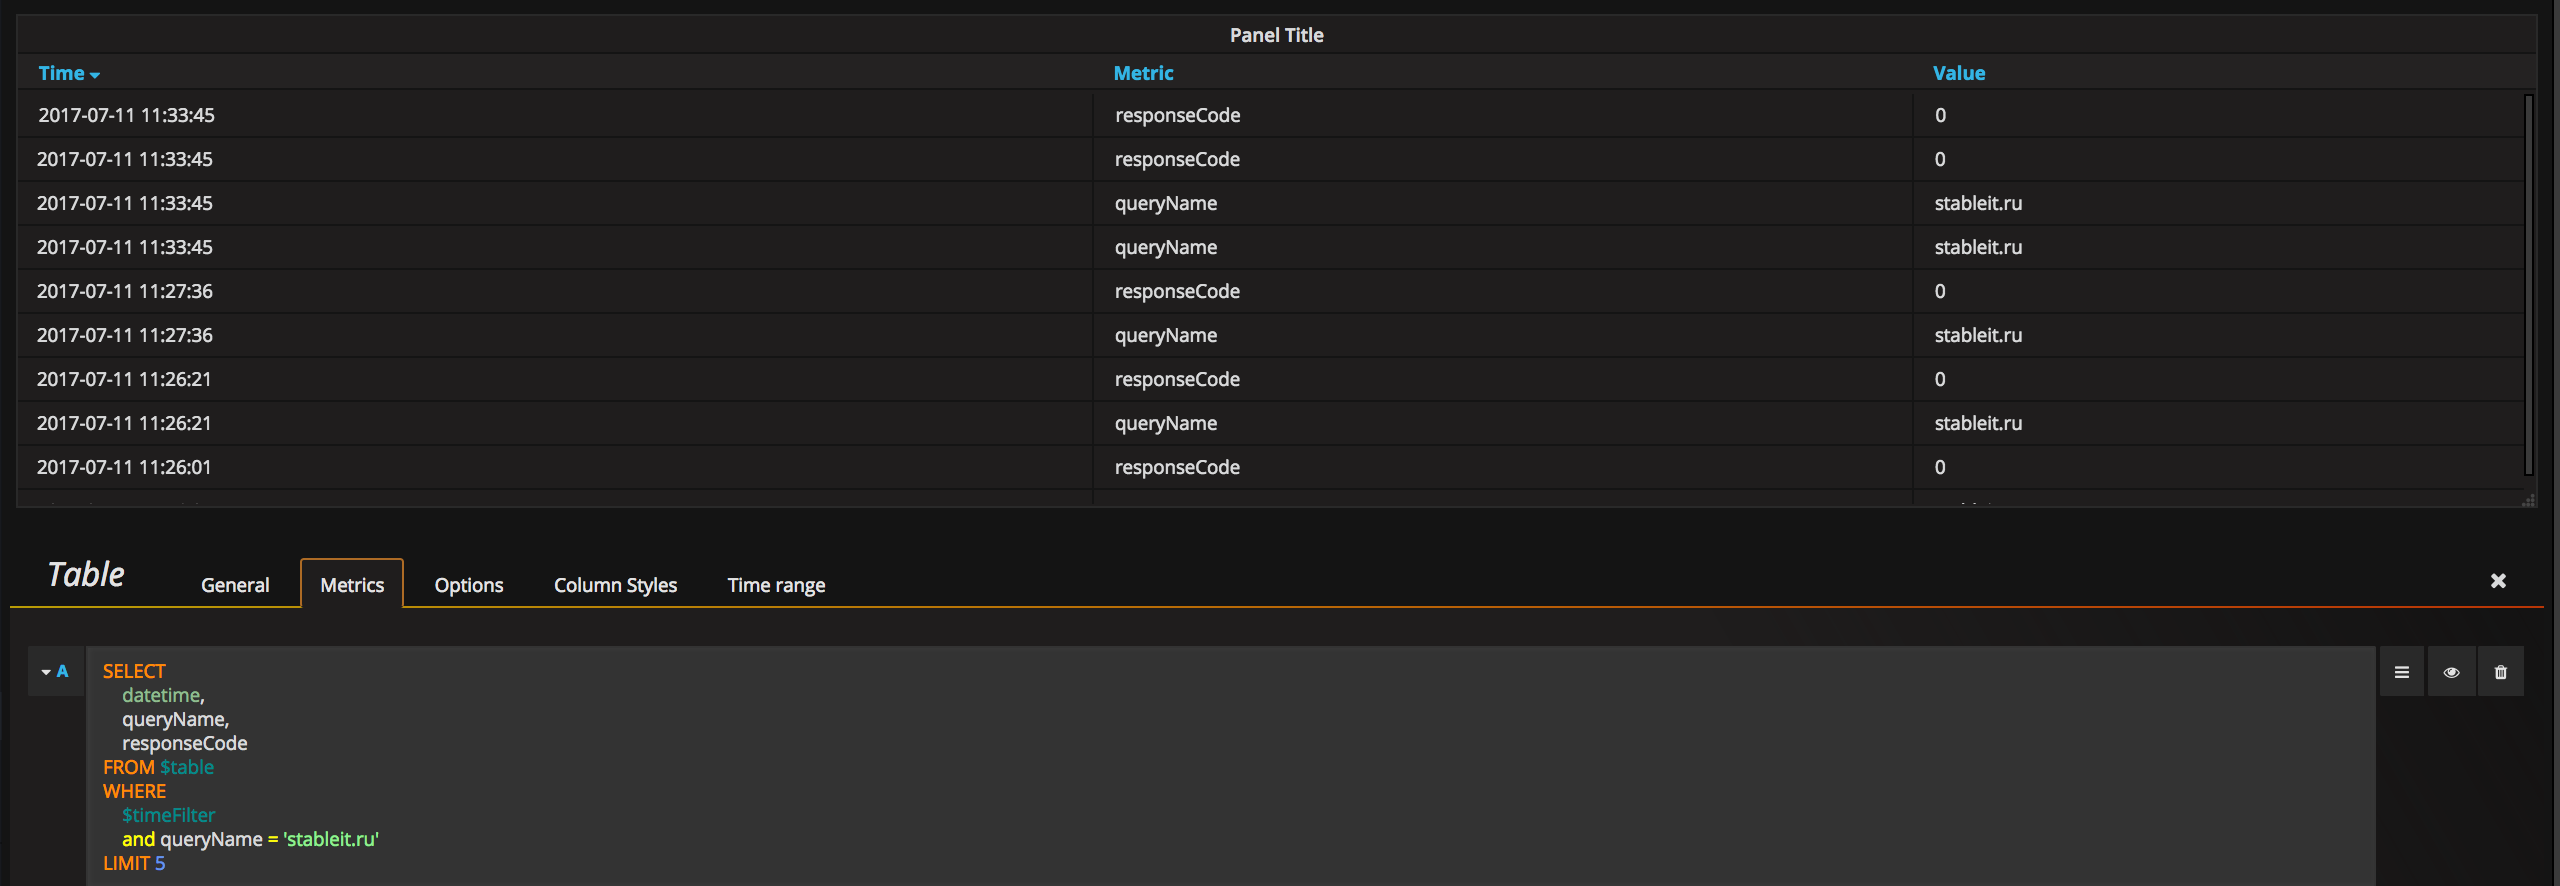
LIMIT 5,10000000000000 /* select some ridiculous number after first 5 */Table view (https://grafana.com/plugins/table)
There are don't contain any tricks in displaying time-series data. To print summary data, omit time column, and format the result as "Table" and press "Run query".
SELECT
    UserName,
    sum(Requests) as Reqs
FROM requests
GROUP BY
    UserName
ORDER BY
    Reqs
Vertical histogram (https://grafana.com/plugins/graph)

To make the vertical histogram from graph panel we will need to edit some settings:
- Display -> Draw Modes -> Bars
- Axes -> X-Axis -> Mode -> Series
You can use next query:
$columns(
    Size,
    sum(Items) Items)
FROM some_table
// It is also possible to use query without macros
Worldmap panel (https://github.com/grafana/worldmap-panel)

If you have a table with country/city codes:
SELECT
    1,
    Country AS c,
    sum(Requests) AS Reqs
FROM requests
GLOBAL ANY INNER JOIN
(
    SELECT Country, CountryCode
    FROM countries
) USING (CountryCode)
WHERE $timeFilter
GROUP BY
    c
ORDER BY Reqs DESC
If you are using geohash set following options:

You can make following query with Table formatting:

If there is an Ad-hoc variable, plugin will fetch all columns of all tables of all databases (except system database) as tags.
So in dropdown menu will be options like database.table.column. If you specify the default database it will only fetch tables and columns from that database, and the dropdown menu will have an option like table.column.
If there are ENUM columns, the plugin will fetch their options and use them as tag values.
Also, plugin will fetch 300 unique values for fields with other types.
Plugin will apply Ad-hoc filters to all queries on the dashboard if their settings $database and $table are the same
as database.table specified in Ad-hoc control. If the ad-hoc filter doesn't specify a table, it will apply to all queries regardless of the table.
This is useful if the dashboard contains queries to multiple different tables.

There are no option to apply OR operator for multiple Ad-hoc filters - see grafana/grafana#10918 There are no option to use IN operator for Ad-hoc filters due to Grafana limitations
There may be cases when CH contains too many tables and columns so their fetching could take notably amount of time. So, if you need
to have multiple dashboards with different databases using of default database won't help. The best way to solve this will be to have parametrized
ad-hoc variable in dashboard settings. Currently, it's not supported by Grafana interface (see issue).
As a temporary workaround, plugin will try to look for variable with name adhoc_query_filter and if it exists will use its value as query to fetch columns.
For this purpose we recommend creating some variable constant with the name adhoc_query_filter and set the value similar to the following one:
SELECT database, table, name, type FROM system.columns WHERE table='myTable' ORDER BY database, tableThat should help to control data fetching by ad-hoc queries.
To use time range dependent macros like $from and $to in your query the refresh mode of the template variable needs to be set to On Time Range Change.
SELECT ClientID FROM events WHERE EventTime > toDateTime($from) AND EventTime < toDateTime($to)Plugin support Annotations with regions. To enable this feature open Dashboard settings and add new annotation query with clickhouse datasource with properly field names.


Grafana provide two kind of alerts. Unified alerts and graph panel related alerts (legacy).
Both kind of alerts supports by our plugin can't be used together.
Use GF_UNIFIED_ALERTING_ENABLED=1 (preferable) or GF_ALERTING_ENABLED=1 environment variables for switch.
To enable alerts open "alerts" tab in panel, and define alert expression as described on grafana.com

Be careful with Template variables values, currently grafana doesn't support template variables in alert queries itself. Also, grafana UI doesn't pass template variables values to a backend, after you change it on frontend UI.
So, the clickhouse grafana plugin can use template variables values, because we have "Generated SQL" which pass to backend "as is" To ensure template variables values will properly pass to a backend part of the plugin. Please choose the required template variables values for your alerts in UI dropdown, ensure values properly rendered in "Generated SQL" (maybe need change SQL queries in query editor) and save a whole dashboard to the Grafana server
WARNING: Test alert button doesn't save a current state of alert rules to a backend part of the plugin.
If the "Generated SQL" properly passed into backend part of plugin, you will see something like this:

Unified alerts could be provisioned with YAML file, look to https://github.com/Altinity/clickhouse-grafana/tree/master/docker/grafana/provisioning/alerting/


To export exists unified alerts to YAML use Export alerts

To troubleshoot alerts in clickhouse grafana plugin when enable level=debug in log section grafana.ini or via GF_LOG_LEVEL=debug environment variable.
To render your ClickHouse data as Logs, please use special format in "Format as" dropdown in Query Editor called "Logs". This option helps Grafana recognizes data as logs and shows logs visualization automatically in Explore UI. On dashboards you can use Logs panel as well.

To return suitable for logs data - query should return at least one time field (assumed that it will be first field) and one text field from the ClickHouse.
Plugin is also transforming all text fields, except log line, into the labels using following rules:
- Log line will be taken either from dedicated
contentfield or from first in order text field in result - All other text fields will be treated as a labels
There are few dedicated fields that are recognized by Grafana:
level(string) - set the level for each log lineid(string) - by default, Grafana offers basic support for deduplicating log lines, that can be improved by adding this field to explicitly assign identifiers to each log line
All other fields returned from data source will be recognized by Grafana as detected fields

To show Traces you need query in format as "Flame Graph" According to https://grafana.com/docs/grafana/latest/panels-visualizations/visualizations/flame-graph/#data-api, you need to have recordset with 4 fields
level- Numeric - the level of the stack frame. The root frame is level 0.label- String - the function name or other symbol which identifyvalue- Numeric - the number of samples or bytes that were recorded in this stack traceself- Numeric - the number of samples or bytes that were recorded in only this stack frame excluding the children, for clickhouse this is usually zero cause we can't calculate)
Moreover, rows shall be ordered by stack trace and level
If you setup query_profiler_real_time_period_ns in profile or query level settings when you can try to visualize it as FlameGraph with the following query
Look to system.trace_log table description for how to get data for FlameGraph
Look to flamegraph dashboard example for example of dashboard with FlameGraph
SELECT length(trace)  - level_num AS level, label, count() AS value, 0 self
FROM system.trace_log
  ARRAY JOIN arrayEnumerate(trace) AS level_num,
  arrayMap(x -> if(addressToSymbol(x) != '', demangle(addressToSymbol(x)), 'unknown') , trace) AS label
WHERE trace_type='Real' AND $timeFilter
GROUP BY level, label, trace
ORDER BY trace, levelTo show Traces you need query with format as "Traces" with following


For example, if <opentelemetry_start_trace_probability>1</opentelemetry_start_trace_probability> in user profile and system.opentelemetry_span_log is not emtpy, then you can show traces about clickhouse query execution
Look to system.opentelemetry_span_log table description for how to get data for FlameGraph
Look to tracing dashboard example for example of dashboard with FlameGraph
Tracing visualization requires following field names (case sensitive):
traceID- StringspanID- StringoperationName- StringparentSpanID- StringserviceName- Stringduration- UInt64 - duration in millisecondsstartTime- UInt64 - start time in millisecondstags- map(String, String) - tags for spanserviceTags- map(String, String) - tags for service (for example 'hostName')
SELECT
  trace_id AS traceID,
  span_id AS spanID,
  operation_name AS operationName,
  parent_span_id AS parentSpanID,
  'clickhouse' AS serviceName,
  intDiv(finish_time_us - start_time_us, 1000) AS duration,
  intDiv(start_time_us,1000) AS startTime,
  attribute AS tags,
  map('hostName',hostname) AS serviceTags
FROM
  system.opentelemetry_span_log
WHERE $timeFilter
ORDER BY traceID, startTimeIt’s now possible to configure datasources using config files with Grafana’s provisioning system. You can read more about how it works and all the settings you can set for datasources on the provisioning docs page.
Here are some provisioning example:
apiVersion: 1

datasources:
 - name: Clickhouse
   type: vertamedia-clickhouse-datasource
   access: proxy
   url: http://localhost:8123
   # <bool> enable/disable basic auth
   basicAuth: false
   # <string> basic auth username
   basicAuthUser: "default"
   # <bool> enable/disable with credentials headers
   withCredentials: false
   # <bool> mark as default datasource. Max one per org
   isDefault: false
   # <map> fields that will be converted to json and stored in json_data
   jsonData:
     # <bool> enable/disable sending 'add_http_cors_header=1' parameter
     addCorsHeader: false
     # <bool> enable/disable using POST method for sending queries
     usePOST: false
     # <bool> enable/disable using Accept-Encoding header in each request
     useCompression: false
     # <string> compression type allowed values: gzip, zstd, br, deflate
     compressionType: ""
     # <string> default database name
     defaultDatabase: ""
     # <bool> enable/disable tls authorization
     tlsAuth: false
     # <bool> enable/disable tls authorization with custom ca
     tlsAuthWithCACert: false
     # <bool> enable/disable authorization with X-ClickHouse-* headers
     useYandexCloudAuthorization: false
     # <string> X-ClickHouse-Key header value for authorization
     xHeaderUser: ""
     # <string> the same value as url when `useYandexCloudAuthorization: true`
     # @todo remove this workaround when merge https://github.com/grafana/grafana/pull/80858
     dataSourceUrl: "http://localhost:8123"
   secureJsonData:
     # <string> X-ClickHouse-User header value for authorization
     xHeaderKey: ""
     # <string> basic auth password
     basicAuthPassword: ""
     # <string> custom certificate authority for TLS https connection, base64 encoded
     tlsCACert: ""
     # <string> custom client certificate for TLS https connection, base64 encoded
     tlsClientCert: ""
     # <string> custom client secret key for TLS https connection, base64 encoded
     tlsClientKey: ""
Some settings and security params are the same for all datasources. You can find them here.
Why time series last point is not the real last point?
Plugin extrapolates last datapoint if time range is last N to avoid displaying of constantly decreasing graphs
when timestamp in a table is rounded to minute or bigger.
If it so then in 99% cases last datapoint will be much less than previous one, because last minute is not finished yet.
That's why plugin checks prev datapoints and tries to predict last datapoint value just as it was already written into db.
This behavior could be turned off via "Extrapolation" checkbox in query editor.
Which table schema used in SQL query examples?
All examples in this plugin use following table schema:
CREATE TABLE IF NOT EXISTS countries(
    Country LowCardinality(String),
    CountryCode LowCardinality(String)
) ENGINE MergeTree()
ORDER BY (CountryCode, Country);

CREATE TABLE IF NOT EXISTS oses (
    OSName LowCardinality(String),
    OS LowCardinality(String)
) ENGINE MergeTree()
ORDER BY (OS);

CREATE TABLE IF NOT EXISTS requests(
    EventTime DateTime,
    EventDate Date,
    Protocol LowCardinality(String),
    UserName LowCardinality(String),
    OS LowCardinality(String),
    CountryCode LowCardinality(String),
    Type UInt8,
    Requests UInt32
) ENGINE=MergeTree()
ORDER BY (EventDate, EventTime, Type, OS, Protocol, UserName)
PARTITION BY toYYYYMM(EventDate);
What about alerts support?
Alerts feature requires changes in Grafana's backend, which can be extended only for Grafana 6.5+. Grafana's maintainers are working on this feature.
Current alerts support for clickhouse-grafana datasource plugin in beta.
For clickhouse grafana plugin 2.2.3+ support only for amd64 architecture for Linux, macOS, Windows and arm64 Linux, macOS (m1). Only amd64 prior 2.2.3 version.
If you have any idea for an improvement or found a bug do not hesitate to open an issue or submit a pull request. We will appreciate any help from the community which will make working with such amazing products as ClickHouse and Grafana more convenient.
see CONTRIBUTING.md for Development and Pull request Contributing instructions
License
MIT License, please see LICENSE for details.


![dependabot[bot] avatar](https://avatars.githubusercontent.com/in/29110?v=4 "dependabot[bot]")