Git Product home page Git Product logo

gait-tracking-with-x-imu's Introduction

Gait-Tracking-With-x-IMU

Warning

This repository is no longer maintained and has been superseded by Gait-Tracking.

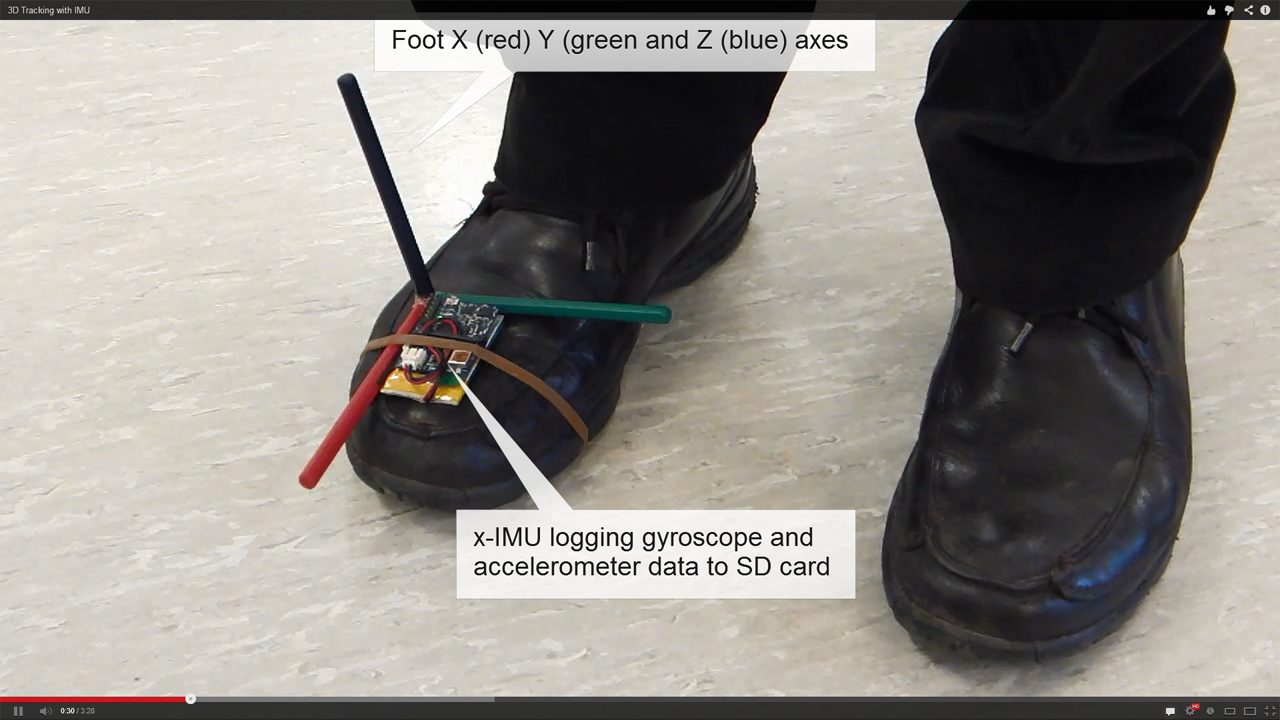
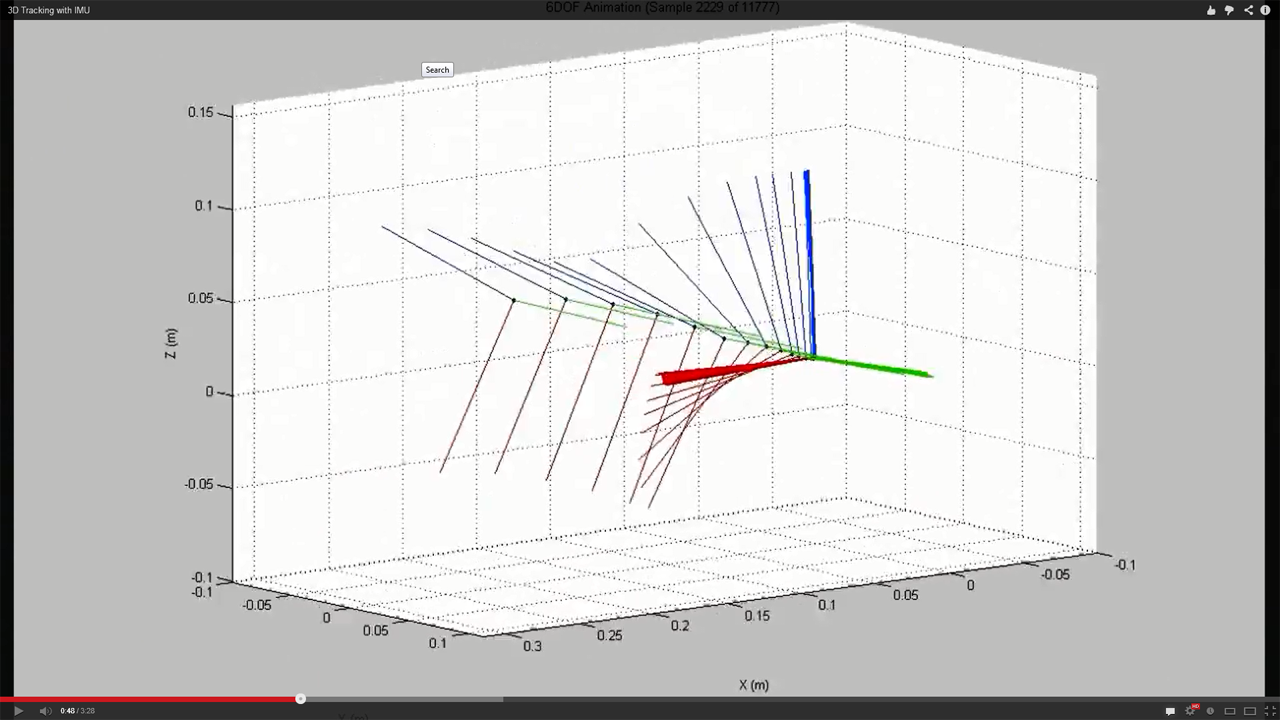
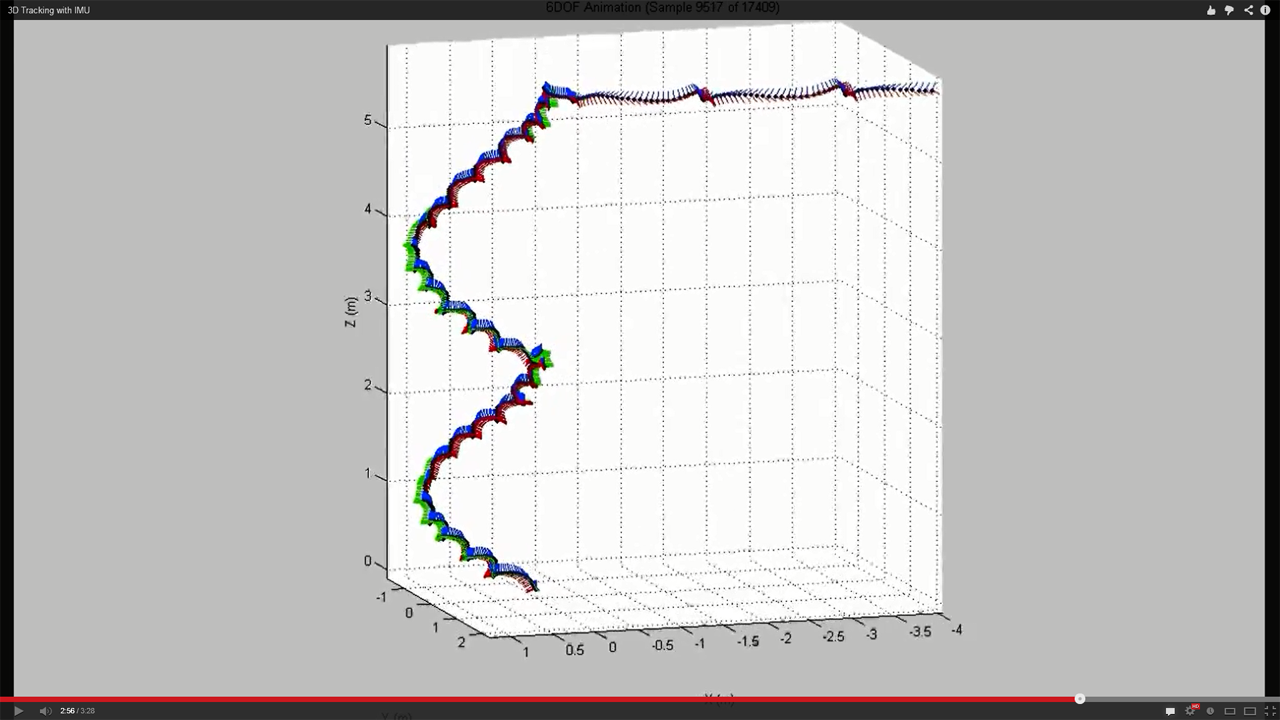
This is the source code for the foot tracking algorithm demonstrated in Seb Madgwick's "3D Tracking with IMU" video, originally uploaded to YouTube in March 2011. An x-IMU attached to a foot is be used to track position through dead reckoning and integral drift corrected for each time the foot hit the ground.

See the original post for more information.

gait-tracking-with-x-imu's People

Contributors

rhoska avatar xiotechnologies avatar

Stargazers

 avatar  avatar  avatar  avatar  avatar  avatar  avatar  avatar  avatar  avatar  avatar  avatar  avatar  avatar  avatar  avatar  avatar  avatar  avatar  avatar  avatar  avatar  avatar  avatar  avatar  avatar  avatar  avatar  avatar  avatar  avatar  avatar  avatar  avatar  avatar  avatar  avatar  avatar  avatar  avatar  avatar  avatar  avatar  avatar  avatar  avatar  avatar  avatar  avatar  avatar  avatar  avatar  avatar  avatar  avatar  avatar  avatar  avatar  avatar  avatar  avatar  avatar  avatar  avatar  avatar  avatar  avatar  avatar  avatar  avatar  avatar  avatar  avatar  avatar  avatar  avatar  avatar  avatar  avatar  avatar  avatar  avatar  avatar  avatar  avatar  avatar  avatar  avatar  avatar  avatar  avatar  avatar  avatar  avatar  avatar  avatar  avatar  avatar  avatar  avatar

Watchers

 avatar  avatar  avatar  avatar  avatar  avatar  avatar  avatar  avatar  avatar  avatar  avatar  avatar  avatar  avatar  avatar  avatar  avatar  avatar  avatar  avatar  avatar  avatar  avatar  avatar  avatar  avatar  avatar  avatar  avatar  avatar  avatar  avatar  avatar  avatar  avatar  avatar  avatar  avatar  avatar  avatar  avatar  avatar  avatar  avatar  avatar  avatar  avatar  avatar  avatar  avatar  avatar  avatar  avatar  avatar  avatar  avatar  avatar  avatar  avatar  avatar  avatar  avatar  avatar  avatar  avatar  avatar  avatar  avatar  avatar  avatar  avatar  avatar  avatar  avatar  avatar  avatar  avatar  avatar  avatar  avatar  avatar  avatar  avatar

gait-tracking-with-x-imu's Issues

Not x-IMU issue, just personal question

I'm a student

I want to measure the moving distance of a car.
simple distance data is enough

My question is

  1. is there an answer to ( 3-axis accelerator + gyro ) data processing code?
  2. I watch x-IMU video, ㄴ Matlab was used to process the data, Matlab is necessary?
  3. what kind of language that x-imu project?

Errors when taking turns

Hello,

First of all- thank you for making the code public. I would like to ask for a help or a hint.

I've edited your code to take samples from my custom file. I provide the program with time, clean accelerometer data and gyro data with offsets subtracted. I use LSM9DS0 sensor with 190Hz (gyro) / 200Hz (acc). Straight line walking works well. But when I try to take a turn, then I gain the position Z axis offset and the the trajectory of the returning path is not parallel to the original. Photos attached shows it best (red path is the actual path). I am wondering where is the problem? It occures that the AHRS algorithm does not work well with my data. Any ideas?

Thank you in advance :)

1
2

Issue tracking code

I try to work on your tracking code but I have this issue :

xIMUdataClass
Index exceeds the number of array elements (0).

Error in xIMUdataClass (line 29)
obj.FileNamePrefix = varargin{1};

Thank you

Input my Loggs

Hello,

I just downloaded the code and want to import my own excel data loggs.
Can someone guide me. I see that there is a .BIN file and a .csv file but cannot manage to use my data.

Thanks

Error using figure

Hello, Im kinda new into matlab. Wen I run script I get:

Error using figure
While setting the 'Number' property of 'Figure':
Value must be a scalar double or the empty matrix

Error in Script (line 76)
figure('Position', [9 39 900 600], 'Number', 'off', 'Name', 'Sensor Data');

trouble with assumptions of gait

I have been confused about assumptions of gait since I finish computing quaternions. wish someone help me. thanks a milllion.

Real Time System. Speed correction

Hello, I am trying to implement this algorithm in real time. Faced the problem of speed correction. How can I calculate speed drift in real time? Or do I need to use a different algorithm or approach?

This implementation will not work in realtime:

velDrift = zeros(size(vel));
stationaryStart = find([0; diff(stationary)] == -1);
stationaryEnd = find([0; diff(stationary)] == 1);
for i = 1:numel(stationaryEnd)
driftRate = vel(stationaryEnd(i)-1, :) / (stationaryEnd(i) - stationaryStart(i));
enum = 1:(stationaryEnd(i) - stationaryStart(i));
drift = [enum'*driftRate(1) enum'*driftRate(2) enum'*driftRate(3)];
velDrift(stationaryStart(i):stationaryEnd(i)-1, :) = drift;
end

FILTERING

WHY YOU USE LOW AND HIGH PASS FILTER IN THIS PROJECT CAN YOU EXPLANE IT

Navigation with IMU

I am using another IMU sensor with 3-axis magnetometer, 3-axis gyroscope and 3-axis accelerometer and want to do dead reckoning. Different than your project, I am carrying the sensor by hand so that I haven't got the effect of hitting the ground. Can I use your source code directly for this scenario or is there any way to adapt?

error: No data was imported

Hi,
I am new to MATLAB/Octave and currently when i run the Script file on Octave i get the following error

error: No data was imported. error: called from xIMUdataClass at line 49 column 17 Script at line 26 column 10

I am running the exact file on this repository, what do you think the problem could be?

LP filter accelerometer data help

Hello, I want to know how to determine the value of the filtCutOff in Script.m:

filtCutOff =5;
[b, a] = butter(1, (2*filtCutOff)/(1/samplePeriod), 'low');
acc_magFilt = filtfilt(b, a, acc_magFilt);

About the time data

First thanks a lot for the code.But when I tried to use the code with my own IMU data I ran into some problems: data from my csv file can be imported but the results came out to be null arrays, and I thought it might have something to do with time array. The time array is used in the program but I haven't found any time data in the example csv files provided, and I'm a bit confused where the time array came from, are they simply generated from the startTime and stopTime or what?
Much appreciated for the reply!

How to adjust the sampling time? (2sec and 1sec)

Because I already set "Data Output Setting" frequency from 1Hz to 512Hz
but I still can not get the sample data like below
Packet number Gyroscope X (deg/s) Gyroscope Y (deg/s) Gyroscope Z (deg/s)
3 -0.0625 -0.25 -0.0625
5 -0.0625 -0.25 -0.0625
6 -0.0625 0.0625 0
8 -0.375 -0.25 -0.375
9 -0.0625 0.5625 0.0625
11 -0.125 -0.125 -0.1875
12 0.125 0.5 -0.0625
I mean my Packet number can not variable intervals
5-3=2
6-5=1
8-6=2
9-8=1
Most of all, I can not run the program
Matlab ERROR like below

Error in ==> Script at 111
indexSel = 2 :
find(sign(time-(time(1)+initPeriod))+1,1);

Velocity Drift

Could you explain how Velocity Drift algorithm work? What is that?

Drastically wrong results when stop time of dataset provided is changed

When we change stop time of spiral stairs dataset from 47 to 40, the plot generated is entirely wrong. Position in z-direction turns negative while it is positive and shows steps when stop time is 47. Steps in the initial time ( from 5 to 40 sec) should not change at all but that is not the case. The length of the step in the initial period changes and z of even the initial period becomes negative. Can you tell me, what's going wrong?
I have attached the screenshots for both the cases.

Stoptime_40

Stoptime_47

IMU data drifting

Hi!

I was very impressed with your work with the Gait tracking algorithm and wanted to test it with my MPU-9250 sensor. I strapped the sensor onto my ankle and walked on a treadmill while sampling data. I then managed to feed my data into your Matlab script and got a result but the output drifts several meters.
I will include a picture of the output and perhaps someone could help me figure out what I am doing wrong...

Best Regards
Anders Persson
test7

Problem about filtering results changes while updating gait status real-time

Recently while trying to modify this algorithm for real-time application I ran into a problem: Firstly I tried to update the result every 0.5 second or so to detect gait phases(stance or swing) but I found that even with the same dataset, Butterworth filtered acceleration magnitudes can be quite different when calculated as a whole sequence and calculated after been divided into several sequences. That resulted in quite serious inaccuracy while these acceleration magnitudes are used to detect gait phases, not only the start and end of each step, but also the number of steps taken are different. The "stationary or not" result would be at least 11% percent different. Does anyone have ideas about how to deal with such problem? Thanks in advance!

Undefined function or variable 'xIMUdataClass'.

Firstly, thank you for your code. I'm new to matlab. When I run Script I get the following error:

Undefined function or variable 'xIMUdataClass'.

Error in Script (line 26)
xIMUdata = xIMUdataClass(filePath, 'InertialMagneticSampleRate',
1/samplePeriod);

Euler angles

Hi,

First a big thank you for making this rich code open-source.

I have a sensor that directly gives me the Euler angles from the Magnetometer in a csv file. I don't have a problem reading the data or putting it in the correct EulerAngleDataClass or the CalInertialAndMagneticDataClass. Altough, since I don't have the raw Magnetometer data and the current algorithm uses it for AHRS, my velocity graph is a mess. Is there a line I need to uncomment to use the EulerAngleDataClass in the calculation of the referential?

Thank you,
Joseph

Use Matlab code with Arduino 101

I'm trying to adapt this code to use it with the imu data coming from an Arduino 101, but i have some problems.
Has anyone ever tried to do it?
One of the problem i'm fighting is that it is difficult to have a constant sampling "printing" rate, because I can set the sampling rate of the accelerometer in the arduino, but it is difficult to set it to make it print the values at a desidered rate.

Looking at the Matlab code I have the following questions:
1)What do you mean with startTime and stopTime? Do you mean the duration of the event or the part of the event that you are going to read/consider? Because in the default example code it starts from 6 and it goes to 26.

2)Second question is about the sample period; considering this value, do you mean the value of the "printing" rate of the value coming from the IMU or is it the sampling/reading rate set in the IMU and it prints at different speed? Have i to change it also in the AHRS.m ?

3)Is it possible to have the code that you run in your x-IMU?

4)Does it work well even if i don't use the magnetometer?

Thanks for your help

Can this code use for approximate phone tracking?

Hi, thanks for sharing this awesome code. I want to use sensors in smart phones to track the 3D position of the phones. I tried some ways to track before I saw your result in Youtube.

I change my output to fit your input. But I didn't get a convincing result from this code. I see that you said stationary period during the whole process is essential to compensate the drift. So I want to ask you whether it's possible to track the 3D trajectory of a smart phone, or any possible way I can use to do it. Any advice or comment will be appreciate.

Import Data with other time

Hi,

I try to import my data on the code but I think I have an issue in a time and period because I have a different time that this example.
My time is about 3 secs.

Thanks

Where is the code

I'm sorry I'm new to Github, where do I find the code?
Thanks a million!

Objective Function?

Why the code uses v as objective function instead of f, as described in paper?

Navigation frame help ?

Hello, i have been using accelerometer and gyroscope data to determine and track position of ground vehicle. But when i see script position data figure is some what confusing. I would like to know what navigation frame is been used for position ? thanks.

Lower frequency - bad results

Hi!

Great code, thanks for sharing!

I have been having bad results with lower frequencies, even with 200Hz, and I wonder if it's because the signal is no good or if i'm doing something wrong.

I noticed your samples have higher acceleration magnitudes and they describe a pattern, something very different from mine, that look like noise.

Do you have any insights that could help?

acccelular

measuring the length of the step

Hello, thank you for your fantastic code, I am trying to measure the length of each walked step, using insole sensor(pressure sensor) and IMU, data fusion is already done inside the IMU, so I have the three accelerations and the three angles which I am reading from a text file..I performed three step of length
55 cm, 56 cm, 54cm each one,
I want to ask if anyone can help me to understand where are the errors to be corrected in order to have more accurate results
my code.txt
recordLeft.txt

trouble with manually framing data

Hello and thank you for uploading this code.

When I attempt to manually frame my data by entering my own start and stop times, it changes all my accX, accY, accZ, gyrX, gyrY, and gyrZ variables go NaNs. what could be causing this? could it potentially be the way my time is formatted?

thanks again.

Reading in my own CSV file of data

I have collected my own data in CSV format, however, how do I get it read into the program?
How do you create the BIN files?
Many thanks.

Gait Plot not representative of gait test

I have data from a different IMU, but programmed to get angular velocity and raw acceleration. I tried using your script, but the results are not reflective of the walking test I did. The plot is showing that I'm not only falling in the Z axis, but walking diagonally, at exaggerated distances. The test I ran only had me walking in a straight line. Would you know what factors could be causing this? My sensor measures at 50 Hz for a 6 meter walk. Is the test too short of a length, or is the frequency bad, or am I using the wrong data? When we put in a specific start and stop time, it does look representative of a walk test, but it is slightly inaccurate.
straightlinewalktest.csv

What type of binary files are being read in the datasets

Currently have my data in csv format, but I don't understand how to convert it into .BIN format for it to be read by the matlab program. Is there any way around this issue?

Ok I was able to get the file to be read into program, but currently I am having a problem with the raw data being loaded on the plotter. Current error file looks like this
-Warning: Plot empty.

In legend (line 260)
In Script (line 89)
Warning: Plot empty.
In legend (line 260)
In Script (line 101)
Index exceeds matrix dimensions.

Error in Script (line 113)
indexSel = 1 : find(sign(time-(time(1)+initPeriod))+1, 1);

Has anyone encountered such error logs?

How to get the packet number??

i am using sparkfun imu 9250 in arduino. i can get the accelerometer (g) and gyro (dps) values. i set the sample rate at 256 and low pass filter at 42.

where will i get packet number? if it is any code is there for the packet number please share. I am a beginner if anything wrong please suggest the right way

Thank you

Adaptive Stationary

How we describe threshold for high accelerometer values? Is this algorithm spesific for just foot step tracking? Can I use it other applications on phones or VR glasses?

Error Inputting Data

I am attempting to input my own data, with columns:

Time (sec) | ARS1 (deg/s) | ARS2 (deg/s) | ARS3 (deg/s) | Acc1 (g) | Acc2 (g) | Acc3 (g)

Is there a way to do this properly? I am getting error:

Error using xIMUdataClass (line 49)
No data was imported.

Error in Script (line 32)
xIMUdata = xIMUdataClass(filePath, 'InertialMagneticSampleRate', 1/samplePeriod);

Thank you!

Problems about using my own IMU in this project

I have tried this project with my own IMU, the sample frequency is 200HZ, but the result is really very different from the ground truth. I just modified the samplePeriod in the Scrip.m file, so I want to know if there any other parameters that I need to change, beside, in this project and another project 'Oscillatory-Motion-Tracking-With-x-IMU-master', you both used HP filter and Low filter for processing, can you explain why you do it in this way? Very thanks.

Filter parameters

Hello, Thank you for the code. Clearly, a lot of work has gone into writing and maintaining this code.

My question is about the filter parameters used in this code. How did you determine the parameters needed to filter the data. For instance, in script.m file:

% HP filter accelerometer data
filtCutOff = 0.001;

How did you determine the filtCutoff to be 0.001? Similarly, how the cutoff for the LP filter was determined to be 5 and also the threshold for stationary period detection was 0.05?

NGIMU Port

Greetings,

is there a way to port this code to be compatible with NGIMU hardware?
x-IMU hardware isn't available anymore on the website.

Main thing is that the CSV files created by the NGIMU Data Logger/Converter contains the time in the first column; the matlab script accepts a 'packet number'. This packet number may be a sequence of integers, but not all packet numbers are "1" - step from each other (i.e. gaps exist).

How does the packet number relate to time?

Kind regards,
Thomas

Recommend Projects

  • React photo React

    A declarative, efficient, and flexible JavaScript library for building user interfaces.

  • Vue.js photo Vue.js

    🖖 Vue.js is a progressive, incrementally-adoptable JavaScript framework for building UI on the web.

  • Typescript photo Typescript

    TypeScript is a superset of JavaScript that compiles to clean JavaScript output.

  • TensorFlow photo TensorFlow

    An Open Source Machine Learning Framework for Everyone

  • Django photo Django

    The Web framework for perfectionists with deadlines.

  • D3 photo D3

    Bring data to life with SVG, Canvas and HTML. 📊📈🎉

Recommend Topics

  • javascript

    JavaScript (JS) is a lightweight interpreted programming language with first-class functions.

  • web

    Some thing interesting about web. New door for the world.

  • server

    A server is a program made to process requests and deliver data to clients.

  • Machine learning

    Machine learning is a way of modeling and interpreting data that allows a piece of software to respond intelligently.

  • Game

    Some thing interesting about game, make everyone happy.

Recommend Org

  • Facebook photo Facebook

    We are working to build community through open source technology. NB: members must have two-factor auth.

  • Microsoft photo Microsoft

    Open source projects and samples from Microsoft.

  • Google photo Google

    Google ❤️ Open Source for everyone.

  • D3 photo D3

    Data-Driven Documents codes.