Git Product home page Git Product logo

awxreader's Introduction

python reader for satellite product format data (.AWX)

This package provide a user-friendly interface to AWX data, it can read 3 type AWX, that is

  • Product Type 1, geostationary satellite image product
  • Product Type 2, polar orbiting satellite image product
  • Product Type 3, Grid product

README

Install

install from pypi

pip install awx

Quick Start

Basic usage for library

1 Read data, access data values, slicing longitude and latitude and save to netCDF

import os
from awx import Awx

pathfile = r'../data/ANI_VIS_R02_20230217_1000_FY2G.AWX'
ds = Awx(pathfile)

# print file head information
print(ds)

# get satellite observation data in xarray.DataArray format
print(ds.values)

# clip data to given longitude and latitude extent
print(ds.sel(lat=slice(20, 40), lon=slice(100, 130)))

# save data to netcdf4
ds.values.to_netcdf('ANI_VIS_R02_20230217_1000_FY2G.nc')

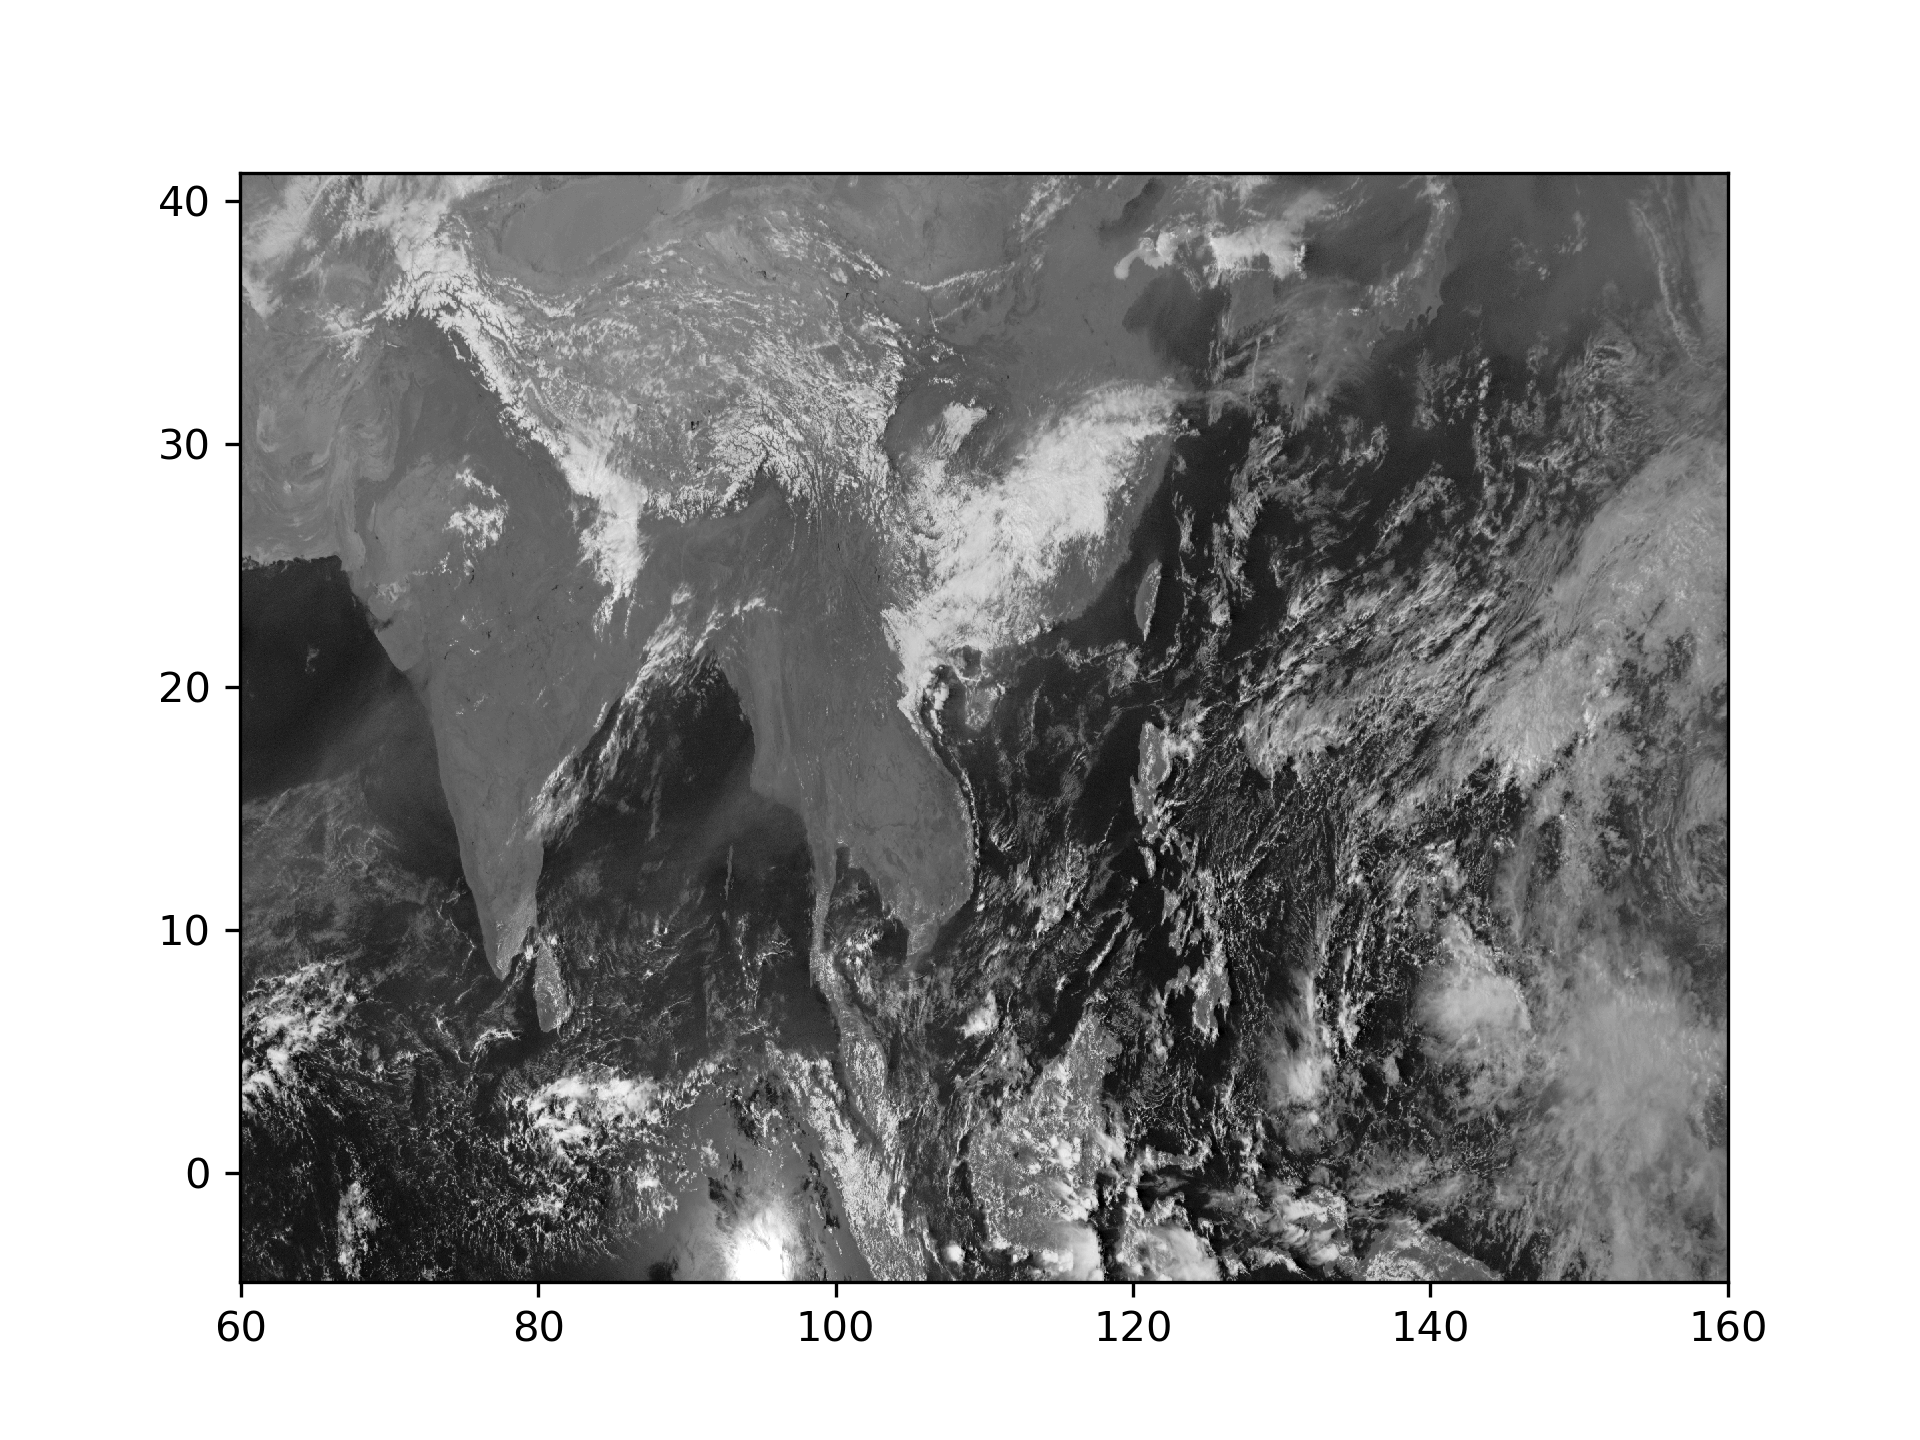
2 Basic draw data without projection

# draw data use matplotlib

import matplotlib.pyplot as plt
from awx import Awx

fpath = r'./data/ANI_VIS_R02_20230217_1000_FY2G.AWX'
ds = Awx(pathfile=fpath)
print(ds)
dar = ds.values.squeeze()
plt.pcolormesh(dar.lon, dar.lat, dar, cmap='Greys_r')
plt.savefig('ANI_VIS_R02_20230217_1000_FY2G_NoProj.png', dpi=300)
plt.show()

ANI_VIS_R02_20230308_1400_FY2G_NoProj.png

3 Draw data in native projection

# draw data in projection coordination
import os
import cartopy.crs as ccrs
import matplotlib.pyplot as plt
from awx import Awx

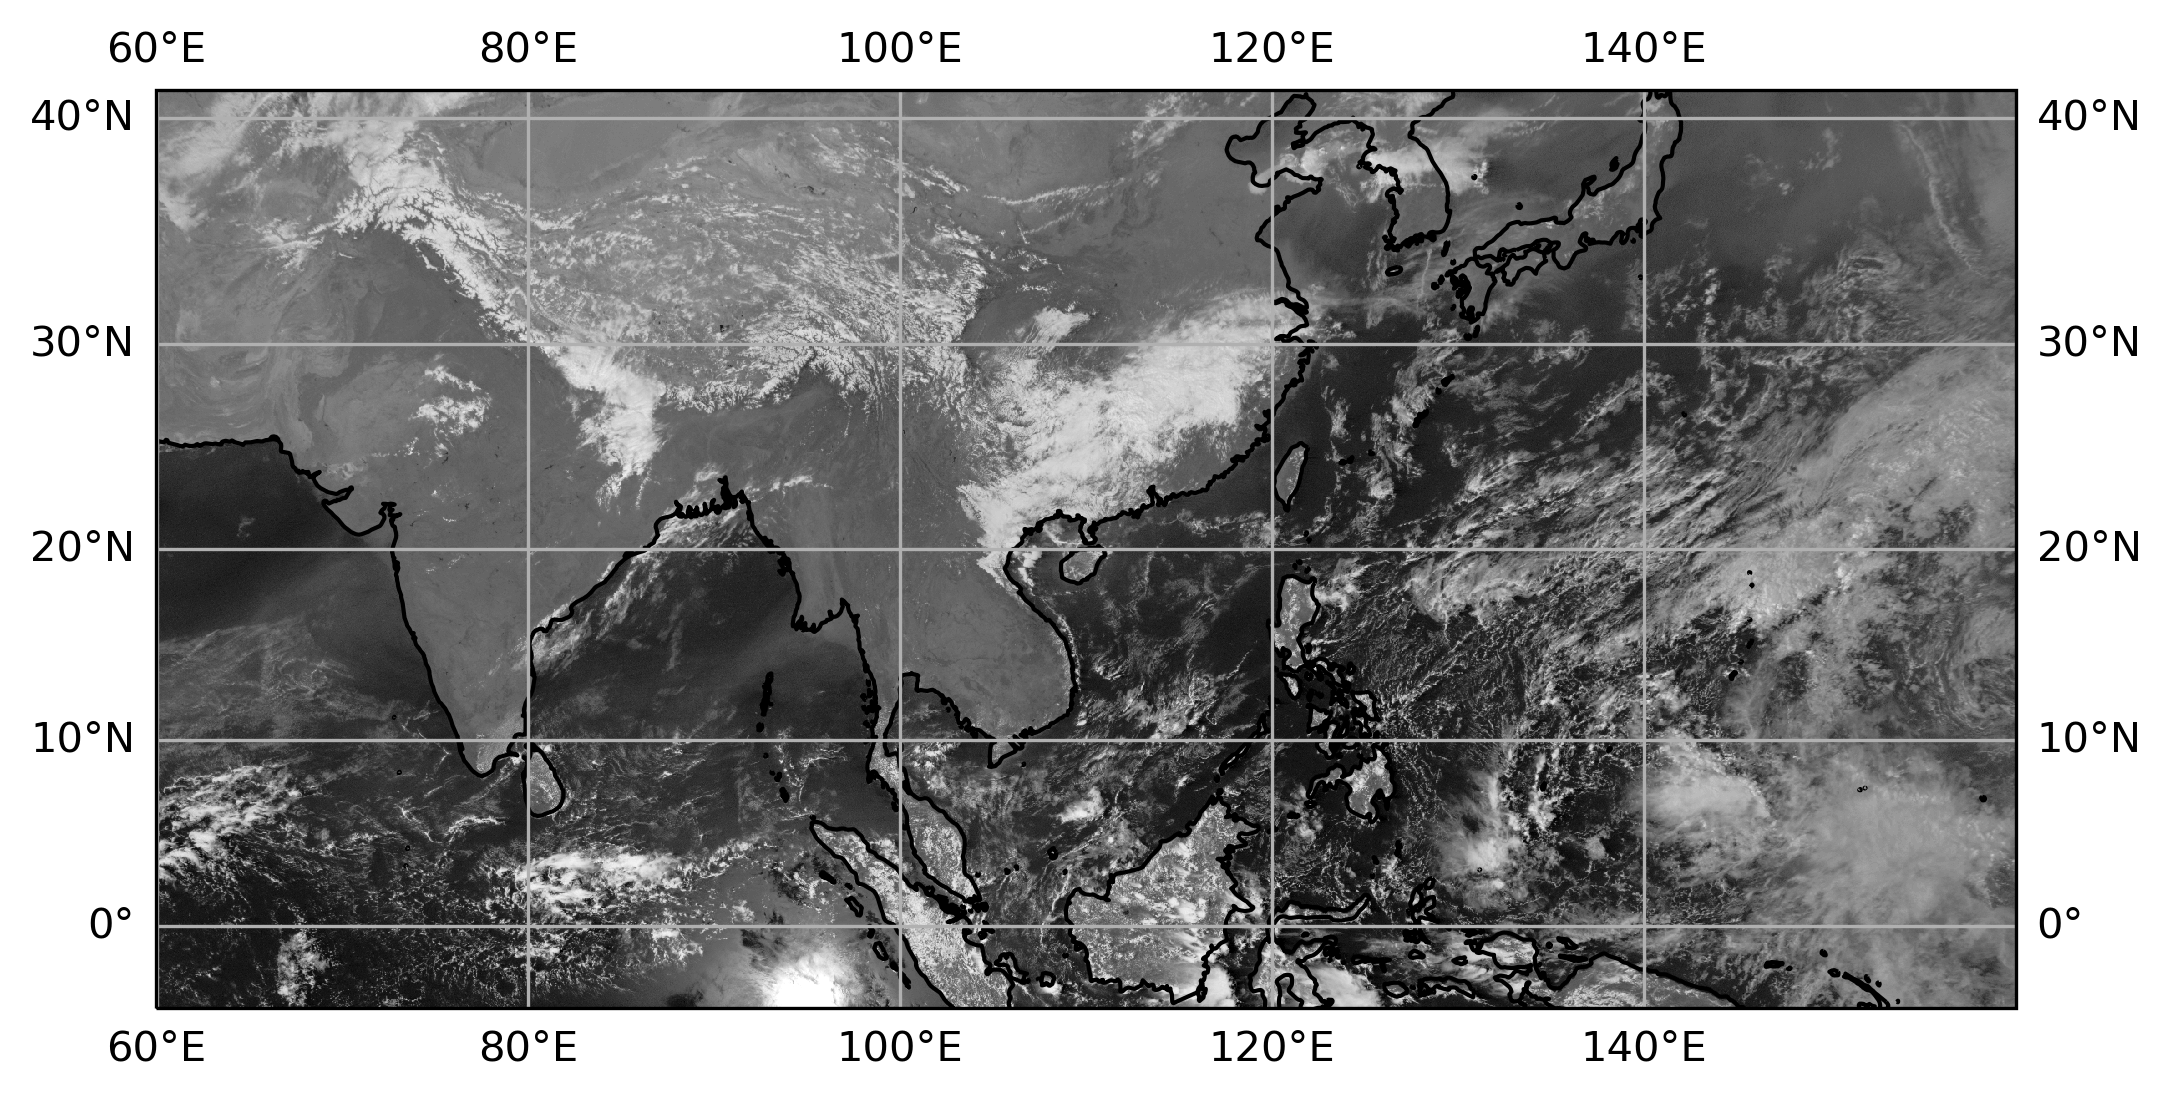
# fpath = r'./sampledata/ANI_VIS_R02_20230308_1400_FY2G.AWX'  # Mercator
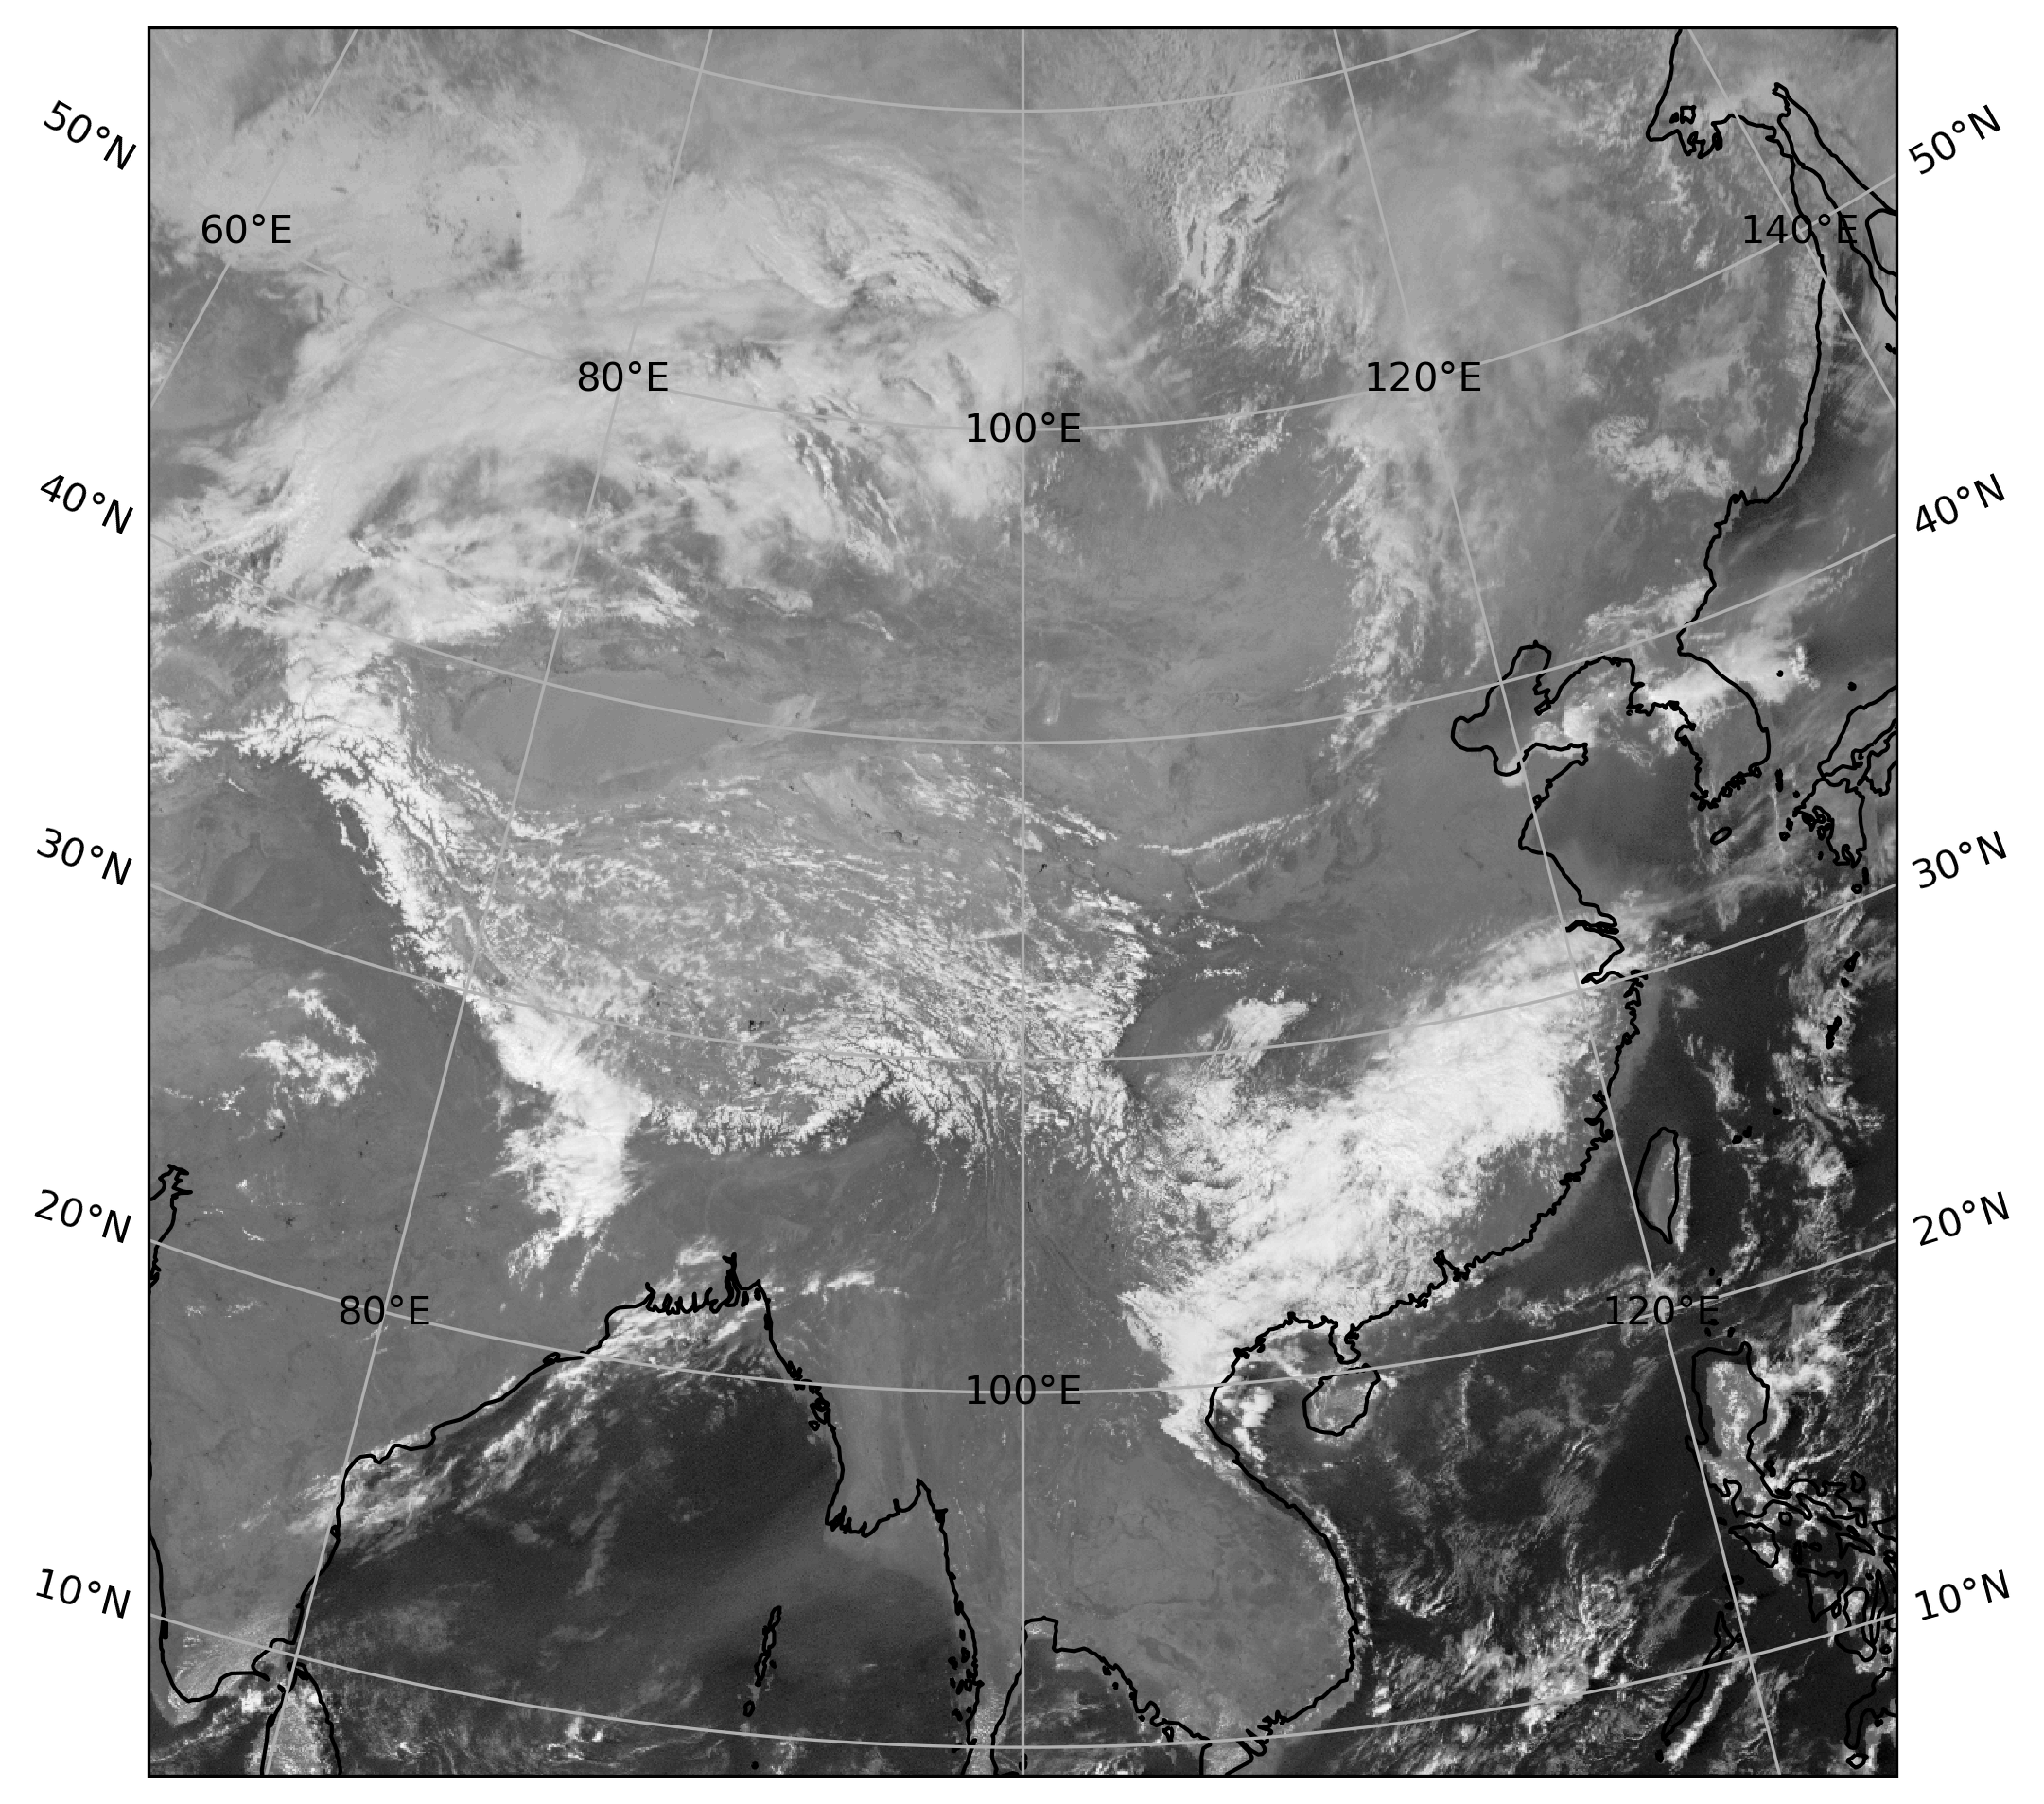
fpath = r'./sampledata/ANI_VIS_R01_20230308_1400_FY2G.AWX'  # lambert
ds = Awx(pathfile=fpath)
print(ds)
dar = ds.values.squeeze()

plt.figure(figsize=(8, 8))

if dar.projection == 1:
    proj = ccrs.LambertConformal(central_longitude=dar.clon / 100,
                                 central_latitude=dar.clat / 100,
                                 standard_parallels=(dar.std_lat1_or_lon / 100.,
                                                     dar.std_lat2 / 100.))
    extent = [dar.x.min(), dar.x.max(), dar.y.min(), dar.y.max()]
elif dar.projection == 2:
    proj = ccrs.Mercator(central_longitude=dar.clon / 100,
                         latitude_true_scale=dar.std_lat1_or_lon / 100.)
    extent = [dar.x.min(), dar.x.max(), dar.y.min(), dar.y.max()]
elif dar.projection == 4:
    proj = ccrs.PlateCarree(central_longitude=dar.clon / 100.)
    extent = [dar.lon.min(), dar.lon.max(), dar.lat.min(), dar.lat.max()]
else:
    raise NotImplementedError()
ax = plt.axes(projection=proj)
ax.set_extent(extent, crs=proj)
ax.coastlines(resolution='110m')
ax.gridlines(draw_labels=True)
ax.pcolormesh(dar.x, dar.y, dar, cmap='Greys_r')
plt.savefig(os.path.splitext(os.path.basename(fpath))[0] + '.png', dpi=300, bbox_inches='tight')
plt.show()

ANI_VIS_R02_20230308_1400_FY2G.png

ANI_VIS_R01_20230308_1400_FY2G.png

Command line procedure

awx_info

Print AWX file head information

Usage:

awx_info AWX_File_Name

Example:

awx_info FY2G_TBB_IR1_OTG_20150729_0000.AWX

awx_to_nc

Convert AWX file to netCDF4 file

Usage:

awx_to_nc AWX_File_Name NetCDF_File_Name

Example:

awx_to_nc FY2G_TBB_IR1_OTG_20150729_0000.AWX FY2G_TBB_IR1_OTG_20150729_0000.nc

awxreader's People

Contributors

wqshen avatar

Stargazers

 avatar  avatar  avatar  avatar  avatar  avatar  avatar  avatar  avatar  avatar  avatar  avatar  avatar  avatar  avatar  avatar  avatar  avatar

Watchers

 avatar  avatar  avatar

awxreader's Issues

投影坐标是否准确?

x = np.linspace(ll_x, ur_x, h2.width)

我尝试读取Lambert投影的数据,也把投影中心当作图像中心,但是反算出来的经纬度范围和二级头信息中的经纬度范围不太匹配。

推测投影中心并不是图像中心。

NSMC的经纬度对照表格点数是512*512的不确定怎么缩放:http://satellite.nsmc.org.cn/PortalSite/StaticContent/DocumentDownload.aspx?TypeID=22

方便加QQ或者微信讨论下吗?

to_dataarray

使用to_dataarray弹出错误:

ValueError: coordinate 'time' is a DataArray dimension, but it has shape () rather than expected shape (1,) matching the dimension size

修改如下:

return xr.DataArray(self.data[None, :, :], coords={'time': [self.obs_start_datetime()],
                                                               'lat': self.lat, 'lon': self.lon},
                                dims=('time', 'lat', 'lon'), name=self.product_type)

不好意思,我就不pull request了.

数据块类型错误

AWX格点产品云顶亮度温度TBB应当被论断为无符号型,同时取质量控制下限和上限之间的值,需改正。

Recommend Projects

  • React photo React

    A declarative, efficient, and flexible JavaScript library for building user interfaces.

  • Vue.js photo Vue.js

    🖖 Vue.js is a progressive, incrementally-adoptable JavaScript framework for building UI on the web.

  • Typescript photo Typescript

    TypeScript is a superset of JavaScript that compiles to clean JavaScript output.

  • TensorFlow photo TensorFlow

    An Open Source Machine Learning Framework for Everyone

  • Django photo Django

    The Web framework for perfectionists with deadlines.

  • D3 photo D3

    Bring data to life with SVG, Canvas and HTML. 📊📈🎉

Recommend Topics

  • javascript

    JavaScript (JS) is a lightweight interpreted programming language with first-class functions.

  • web

    Some thing interesting about web. New door for the world.

  • server

    A server is a program made to process requests and deliver data to clients.

  • Machine learning

    Machine learning is a way of modeling and interpreting data that allows a piece of software to respond intelligently.

  • Game

    Some thing interesting about game, make everyone happy.

Recommend Org

  • Facebook photo Facebook

    We are working to build community through open source technology. NB: members must have two-factor auth.

  • Microsoft photo Microsoft

    Open source projects and samples from Microsoft.

  • Google photo Google

    Google ❤️ Open Source for everyone.

  • D3 photo D3

    Data-Driven Documents codes.