Git Product home page Git Product logo

tfcausalimpact's Introduction

tfcausalimpact

Build Status Coverage Status GitHub license PyPI version Pyversions

Google's Causal Impact Algorithm Implemented on Top of TensorFlow Probability.

How It Works

The algorithm basically fits a Bayesian structural model on past observed data to make predictions on what future data would look like. Past data comprises everything that happened before an intervention (which usually is the changing of a variable as being present or not, such as a marketing campaign that starts to run at a given point). It then compares the counter-factual (predicted) series against what was really observed in order to extract statistical conclusions.

Running the model is quite straightforward, it requires the observed data y, covariates X that helps the model through a linear regression, a pre-period interval that selects everything that happened before the intervention and a post-period with data after the "impact" happened.

Please refer to this medium post for more on this subject.

Installation

pip install tfcausalimpact

Requirements

  • python{3.7, 3.8, 3.9, 3.10, 3.11}
  • matplotlib
  • jinja2
  • tensorflow>=2.10.0
  • tensorflow_probability>=0.18.0
  • pandas >= 1.3.5

Getting Started

We recommend this presentation by Kay Brodersen (one of the creators of the Causal Impact in R).

We also created this introductory ipython notebook with examples of how to use this package.

This medium article also offers some ideas and concepts behind the library.

Example

Here's a simple example (which can also be found in the original Google's R implementation) running in Python:

import pandas as pd
from causalimpact import CausalImpact


data = pd.read_csv('https://raw.githubusercontent.com/WillianFuks/tfcausalimpact/master/tests/fixtures/arma_data.csv')[['y', 'X']]
data.iloc[70:, 0] += 5

pre_period = [0, 69]
post_period = [70, 99]

ci = CausalImpact(data, pre_period, post_period)
print(ci.summary())
print(ci.summary(output='report'))
ci.plot()

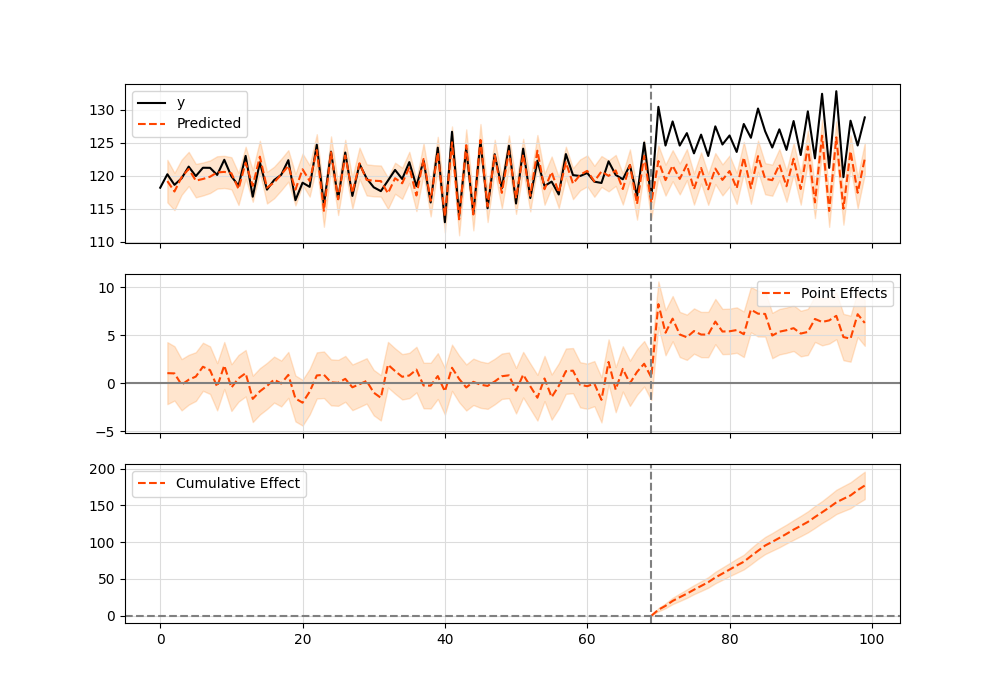
Summary should look like this:

Posterior Inference {Causal Impact}
                          Average            Cumulative
Actual                    125.23             3756.86
Prediction (s.d.)         120.34 (0.31)      3610.28 (9.28)
95% CI                    [119.76, 120.97]   [3592.67, 3629.06]

Absolute effect (s.d.)    4.89 (0.31)        146.58 (9.28)
95% CI                    [4.26, 5.47]       [127.8, 164.19]

Relative effect (s.d.)    4.06% (0.26%)      4.06% (0.26%)
95% CI                    [3.54%, 4.55%]     [3.54%, 4.55%]

Posterior tail-area probability p: 0.0
Posterior prob. of a causal effect: 100.0%

For more details run the command: print(impact.summary('report'))

And here's the plot graphic:

alt text

Google R Package vs TensorFlow Python

Both packages should give equivalent results. Here's an example using the comparison_data.csv dataset available in the fixtures folder. When running CausalImpact in the original R package, this is the result:

R

data = read.csv.zoo('comparison_data.csv', header=TRUE)
pre.period <- c(as.Date("2019-04-16"), as.Date("2019-07-14"))
post.period <- c(as.Date("2019-07-15"), as.Date("2019-08-01"))
ci = CausalImpact(data, pre.period, post.period)

Summary results:

Posterior inference {CausalImpact}

                         Average          Cumulative
Actual                   78574            1414340
Prediction (s.d.)        79232 (736)      1426171 (13253)
95% CI                   [77743, 80651]   [1399368, 1451711]

Absolute effect (s.d.)   -657 (736)       -11831 (13253)
95% CI                   [-2076, 832]     [-37371, 14971]

Relative effect (s.d.)   -0.83% (0.93%)   -0.83% (0.93%)
95% CI                   [-2.6%, 1%]      [-2.6%, 1%]

Posterior tail-area probability p:   0.20061
Posterior prob. of a causal effect:  80%

For more details, type: summary(impact, "report")

And correspondent plot:

alt text

Python

import pandas as pd
from causalimpact import CausalImpact


data = pd.read_csv('https://raw.githubusercontent.com/WillianFuks/tfcausalimpact/master/tests/fixtures/comparison_data.csv', index_col=['DATE'])
pre_period = ['2019-04-16', '2019-07-14']
post_period = ['2019-7-15', '2019-08-01']
ci = CausalImpact(data, pre_period, post_period, model_args={'fit_method': 'hmc'})

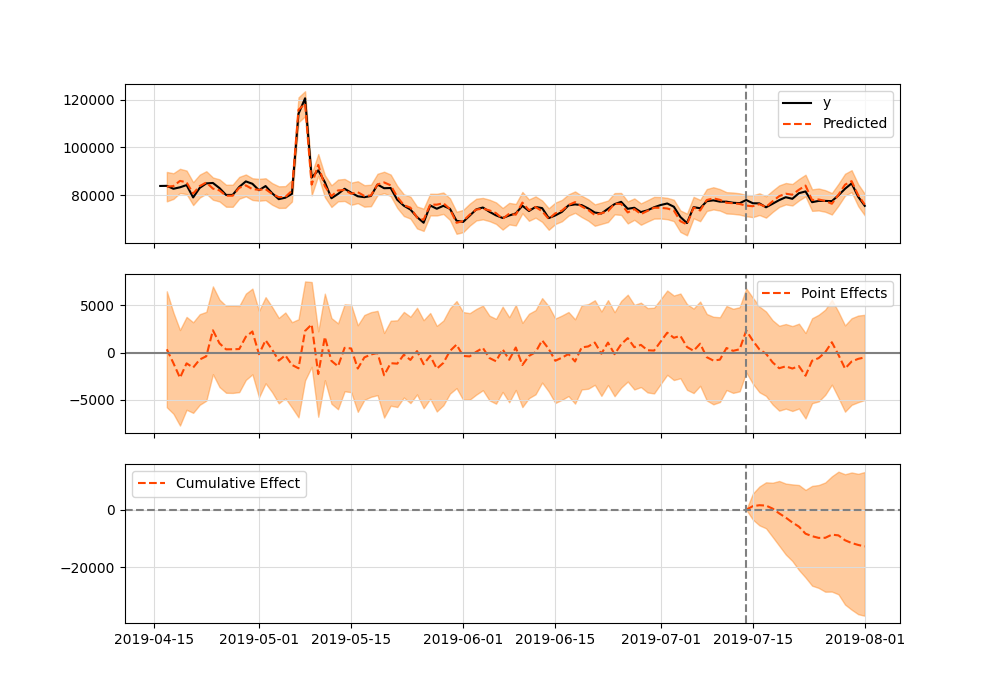
Summary is:

Posterior Inference {Causal Impact}
                          Average            Cumulative
Actual                    78574.42           1414339.5
Prediction (s.d.)         79282.92 (727.48)  1427092.62 (13094.72)
95% CI                    [77849.5, 80701.18][1401290.94, 1452621.31]

Absolute effect (s.d.)    -708.51 (727.48)   -12753.12 (13094.72)
95% CI                    [-2126.77, 724.92] [-38281.81, 13048.56]

Relative effect (s.d.)    -0.89% (0.92%)     -0.89% (0.92%)
95% CI                    [-2.68%, 0.91%]    [-2.68%, 0.91%]

Posterior tail-area probability p: 0.16
Posterior prob. of a causal effect: 84.12%

For more details run the command: print(impact.summary('report'))

And plot:

alt text

Both results are equivalent.

Performance

This package uses as default the Variational Inference method from TensorFlow Probability which is faster and should work for the most part. Convergence can take somewhere between 2~3 minutes on more complex time series. You could also try running the package on top of GPUs to see if results improve.

If, on the other hand, precision is the top requirement when running causal impact analyzes, it's possible to switch algorithms by manipulating the input arguments like so:

ci = CausalImpact(data, pre_period, post_period, model_args={'fit_method': 'hmc'})

This will make usage of the algorithm Hamiltonian Monte Carlo which is State-of-the-Art for finding the Bayesian posterior of distributions. Still, keep in mind that on complex time series with thousands of data points and complex modeling involving various seasonal components this optimization can take 1 hour or even more to complete (on a GPU). Performance is sacrificed in exchange for better precision.

Bugs & Issues

If you find bugs or have any issues while running this library please consider opening an Issue with a complete description and reproductible environment so we can better help you solving the problem.

tfcausalimpact's People

Contributors

glentakahashi avatar kjappelbaum avatar williamjamir avatar willianfuks avatar

Stargazers

 avatar  avatar  avatar  avatar  avatar  avatar  avatar  avatar  avatar  avatar  avatar  avatar  avatar  avatar  avatar  avatar  avatar  avatar  avatar  avatar  avatar  avatar  avatar  avatar  avatar  avatar  avatar  avatar  avatar  avatar  avatar  avatar  avatar  avatar  avatar  avatar  avatar  avatar  avatar  avatar  avatar  avatar  avatar  avatar  avatar  avatar  avatar  avatar  avatar  avatar  avatar  avatar  avatar  avatar  avatar  avatar  avatar  avatar  avatar  avatar  avatar  avatar  avatar  avatar  avatar  avatar  avatar  avatar  avatar  avatar  avatar  avatar  avatar  avatar  avatar  avatar  avatar  avatar  avatar  avatar  avatar  avatar  avatar  avatar  avatar  avatar  avatar  avatar  avatar  avatar  avatar  avatar  avatar  avatar  avatar  avatar  avatar  avatar  avatar  avatar

Watchers

 avatar  avatar  avatar  avatar  avatar  avatar  avatar  avatar  avatar  avatar  avatar  avatar  avatar

tfcausalimpact's Issues

Error running Casual Impact

_

File "C:....\Anaconda3\envs\tf_py3.8\lib\site-packages\causalimpact\model.py", line 229, in build_bijector
bijector = SquareRootBijector()

File "C:...\Anaconda3\envs\tf_py3.8\lib\site-packages\causalimpact\model.py", line 467, in init
super().init(

TypeError: init() got an unexpected keyword argument 'parameters'

Thanks. This error comes from running the first example & data. Thanks in advance

Credible Interval size

Hi everybody,

I am currently trying to quantify the effect of marketing campaign on sales data.
Although I am pretty sure that the model is able to tell me if the campaign has an effect or not, the quantification of that effect is not very precise (eg: 95% CI size of the relative effect is > 20%).

So I am wondering if anyone was able to get something smaller with real world data. In the example notebook the CI is also pretty big except for the simulated data.

In other words, is there any leverage to reduce the size of the CI ?

Edit: Instinctively for what I understand of Bayesian CI I will answer "no" since the interval is "fixed", but maybe I am wrong.

NotImplementedError: Cannot convert a symbolic Tensor to a numpy array.

When I run the model, ci = CausalImpact(protests['count'], pre_period, post_period). This error happened

`---------------------------------------------------------------------------
NotImplementedError Traceback (most recent call last)
in
2 post_period = [73, len(protests)-1]
3
----> 4 ci = CausalImpact(protests['count'], pre_period, post_period)

/Library/Frameworks/Python.framework/Versions/3.8/lib/python3.8/site-packages/causalimpact/main.py in init(self, data, pre_period, post_period, model, model_args, alpha)
217 self.normed_post_data = processed_input['normed_post_data']
218 self.mu_sig = processed_input['mu_sig']
--> 219 self._fit_model()
220 self._process_posterior_inferences()
221 self._summarize_inferences()

/Library/Frameworks/Python.framework/Versions/3.8/lib/python3.8/site-packages/causalimpact/main.py in _fit_model(self)
296 # if operation iloc returns a pd.Series, cast it back to pd.DataFrame
297 observed_time_series = pd.DataFrame(observed_time_series.iloc[:, 0])
--> 298 model_samples, model_kernel_results = cimodel.fit_model(
299 self.model,
300 observed_time_series,

/Library/Frameworks/Python.framework/Versions/3.8/lib/python3.8/site-packages/causalimpact/model.py in fit_model(model, observed_time_series, method)
358 optimizer = tf.optimizers.Adam(learning_rate=0.1)
359 variational_steps = 200 # Hardcoded for now
--> 360 variational_posteriors = tfp.sts.build_factored_surrogate_posterior(model=model)
361
362 @tf.function()

/Library/Frameworks/Python.framework/Versions/3.8/lib/python3.8/site-packages/tensorflow_probability/python/sts/fitting.py in build_factored_surrogate_posterior(model, batch_shape, seed, name)
201 variational_posterior = collections.OrderedDict()
202 for param in model.parameters:
--> 203 variational_posterior[param.name] = _build_posterior_for_one_parameter(
204 param, batch_shape=batch_shape, seed=seed())
205 return joint_distribution_named_lib.JointDistributionNamed(

/Library/Frameworks/Python.framework/Versions/3.8/lib/python3.8/site-packages/tensorflow_probability/python/sts/fitting.py in _build_posterior_for_one_parameter(param, batch_shape, seed)
85
86 # Build a trainable Normal distribution.
---> 87 initial_loc = sample_uniform_initial_state(
88 param, init_sample_shape=batch_shape,
89 return_constrained=False, seed=seed)

/Library/Frameworks/Python.framework/Versions/3.8/lib/python3.8/site-packages/tensorflow_probability/python/sts/fitting.py in sample_uniform_initial_state(parameter, return_constrained, init_sample_shape, seed)
67 parameter.prior.sample(init_sample_shape)))
68 param_shape = (
---> 69 unconstrained_prior_sample_fn.get_concrete_function().output_shapes)
70 if not tensorshape_util.is_fully_defined(param_shape):
71 param_shape = tf.shape(unconstrained_prior_sample_fn())

/Library/Frameworks/Python.framework/Versions/3.8/lib/python3.8/site-packages/tensorflow/python/eager/def_function.py in get_concrete_function(self, *args, **kwargs)
1297 ValueError: if this object has not yet been called on concrete values.
1298 """
-> 1299 concrete = self._get_concrete_function_garbage_collected(*args, **kwargs)
1300 concrete._garbage_collector.release() # pylint: disable=protected-access
1301 return concrete

/Library/Frameworks/Python.framework/Versions/3.8/lib/python3.8/site-packages/tensorflow/python/eager/def_function.py in _get_concrete_function_garbage_collected(self, *args, **kwargs)
1203 if self._stateful_fn is None:
1204 initializers = []
-> 1205 self._initialize(args, kwargs, add_initializers_to=initializers)
1206 self._initialize_uninitialized_variables(initializers)
1207

/Library/Frameworks/Python.framework/Versions/3.8/lib/python3.8/site-packages/tensorflow/python/eager/def_function.py in _initialize(self, args, kwds, add_initializers_to)
723 self._graph_deleter = FunctionDeleter(self._lifted_initializer_graph)
724 self._concrete_stateful_fn = (
--> 725 self._stateful_fn._get_concrete_function_internal_garbage_collected( # pylint: disable=protected-access
726 *args, **kwds))
727

/Library/Frameworks/Python.framework/Versions/3.8/lib/python3.8/site-packages/tensorflow/python/eager/function.py in _get_concrete_function_internal_garbage_collected(self, *args, **kwargs)
2967 args, kwargs = None, None
2968 with self._lock:
-> 2969 graph_function, _ = self._maybe_define_function(args, kwargs)
2970 return graph_function
2971

/Library/Frameworks/Python.framework/Versions/3.8/lib/python3.8/site-packages/tensorflow/python/eager/function.py in _maybe_define_function(self, args, kwargs)
3359
3360 self._function_cache.missed.add(call_context_key)
-> 3361 graph_function = self._create_graph_function(args, kwargs)
3362 self._function_cache.primary[cache_key] = graph_function
3363

/Library/Frameworks/Python.framework/Versions/3.8/lib/python3.8/site-packages/tensorflow/python/eager/function.py in _create_graph_function(self, args, kwargs, override_flat_arg_shapes)
3194 arg_names = base_arg_names + missing_arg_names
3195 graph_function = ConcreteFunction(
-> 3196 func_graph_module.func_graph_from_py_func(
3197 self._name,
3198 self._python_function,

/Library/Frameworks/Python.framework/Versions/3.8/lib/python3.8/site-packages/tensorflow/python/framework/func_graph.py in func_graph_from_py_func(name, python_func, args, kwargs, signature, func_graph, autograph, autograph_options, add_control_dependencies, arg_names, op_return_value, collections, capture_by_value, override_flat_arg_shapes)
988 _, original_func = tf_decorator.unwrap(python_func)
989
--> 990 func_outputs = python_func(*func_args, **func_kwargs)
991
992 # invariant: func_outputs contains only Tensors, CompositeTensors,

/Library/Frameworks/Python.framework/Versions/3.8/lib/python3.8/site-packages/tensorflow/python/eager/def_function.py in wrapped_fn(*args, **kwds)
632 xla_context.Exit()
633 else:
--> 634 out = weak_wrapped_fn().wrapped(*args, **kwds)
635 return out
636

/Library/Frameworks/Python.framework/Versions/3.8/lib/python3.8/site-packages/tensorflow/python/framework/func_graph.py in wrapper(*args, **kwargs)
975 except Exception as e: # pylint:disable=broad-except
976 if hasattr(e, "ag_error_metadata"):
--> 977 raise e.ag_error_metadata.to_exception(e)
978 else:
979 raise

NotImplementedError: in user code:

/Library/Frameworks/Python.framework/Versions/3.8/lib/python3.8/site-packages/tensorflow_probability/python/sts/fitting.py:66 None  *
    parameter.prior.sample(init_sample_shape))
/Library/Frameworks/Python.framework/Versions/3.8/lib/python3.8/site-packages/tensorflow_probability/python/distributions/distribution.py:1002 sample  **
    return self._call_sample_n(sample_shape, seed, name, **kwargs)
/Library/Frameworks/Python.framework/Versions/3.8/lib/python3.8/site-packages/tensorflow_probability/python/distributions/transformed_distribution.py:331 _call_sample_n
    x = self.distribution.sample(sample_shape=[n], seed=seed,
/Library/Frameworks/Python.framework/Versions/3.8/lib/python3.8/site-packages/tensorflow_probability/python/distributions/distribution.py:1002 sample
    return self._call_sample_n(sample_shape, seed, name, **kwargs)
/Library/Frameworks/Python.framework/Versions/3.8/lib/python3.8/site-packages/tensorflow_probability/python/distributions/distribution.py:979 _call_sample_n
    samples = self._sample_n(
/Library/Frameworks/Python.framework/Versions/3.8/lib/python3.8/site-packages/tensorflow_probability/python/internal/distribution_util.py:1364 _fn
    return fn(*args, **kwargs)
/Library/Frameworks/Python.framework/Versions/3.8/lib/python3.8/site-packages/tensorflow_probability/python/distributions/inverse_gamma.py:209 _sample_n
    return tf.math.exp(-gamma_lib.random_gamma(
/Library/Frameworks/Python.framework/Versions/3.8/lib/python3.8/site-packages/tensorflow_probability/python/distributions/gamma.py:660 random_gamma
    return random_gamma_with_runtime(
/Library/Frameworks/Python.framework/Versions/3.8/lib/python3.8/site-packages/tensorflow_probability/python/distributions/gamma.py:654 random_gamma_with_runtime
    return _random_gamma_gradient(
/Library/Frameworks/Python.framework/Versions/3.8/lib/python3.8/site-packages/tensorflow_probability/python/internal/custom_gradient.py:104 none_wrapper
    return f_wrapped(*trimmed_args, **kwargs)
/Library/Frameworks/Python.framework/Versions/3.8/lib/python3.8/site-packages/tensorflow/python/ops/custom_gradient.py:261 __call__
    return self._d(self._f, a, k)
/Library/Frameworks/Python.framework/Versions/3.8/lib/python3.8/site-packages/tensorflow/python/ops/custom_gradient.py:217 decorated
    return _graph_mode_decorator(wrapped, args, kwargs)
/Library/Frameworks/Python.framework/Versions/3.8/lib/python3.8/site-packages/tensorflow/python/ops/custom_gradient.py:330 _graph_mode_decorator
    result, grad_fn = f(*args)
/Library/Frameworks/Python.framework/Versions/3.8/lib/python3.8/site-packages/tensorflow_probability/python/internal/custom_gradient.py:92 f_wrapped
    val, aux = vjp_fwd(*reconstruct_args, **kwargs)
/Library/Frameworks/Python.framework/Versions/3.8/lib/python3.8/site-packages/tensorflow_probability/python/distributions/gamma.py:541 _random_gamma_fwd
    samples, impl = _random_gamma_no_gradient(
/Library/Frameworks/Python.framework/Versions/3.8/lib/python3.8/site-packages/tensorflow_probability/python/internal/implementation_selection.py:83 f_wrapped
    return f(*args, **kwargs)
/Library/Frameworks/Python.framework/Versions/3.8/lib/python3.8/site-packages/tensorflow/python/eager/def_function.py:828 __call__
    result = self._call(*args, **kwds)
/Library/Frameworks/Python.framework/Versions/3.8/lib/python3.8/site-packages/tensorflow/python/eager/def_function.py:862 _call
    results = self._stateful_fn(*args, **kwds)
/Library/Frameworks/Python.framework/Versions/3.8/lib/python3.8/site-packages/tensorflow/python/eager/function.py:2941 __call__
    filtered_flat_args) = self._maybe_define_function(args, kwargs)
/Library/Frameworks/Python.framework/Versions/3.8/lib/python3.8/site-packages/tensorflow/python/eager/function.py:3361 _maybe_define_function
    graph_function = self._create_graph_function(args, kwargs)
/Library/Frameworks/Python.framework/Versions/3.8/lib/python3.8/site-packages/tensorflow/python/eager/function.py:3196 _create_graph_function
    func_graph_module.func_graph_from_py_func(
/Library/Frameworks/Python.framework/Versions/3.8/lib/python3.8/site-packages/tensorflow/python/framework/func_graph.py:990 func_graph_from_py_func
    func_outputs = python_func(*func_args, **func_kwargs)
/Library/Frameworks/Python.framework/Versions/3.8/lib/python3.8/site-packages/tensorflow/python/eager/def_function.py:634 wrapped_fn
    out = weak_wrapped_fn().__wrapped__(*args, **kwds)
/Library/Frameworks/Python.framework/Versions/3.8/lib/python3.8/site-packages/tensorflow_probability/python/distributions/gamma.py:483 _random_gamma_no_gradient
    return sampler_impl(
/Library/Frameworks/Python.framework/Versions/3.8/lib/python3.8/site-packages/tensorflow_probability/python/internal/implementation_selection.py:162 impl_selecting_fn
    function.register(defun_cpu_fn, **kwargs)
/Library/Frameworks/Python.framework/Versions/3.8/lib/python3.8/site-packages/tensorflow/python/eager/function.py:3390 register
    concrete_func.add_gradient_functions_to_graph()
/Library/Frameworks/Python.framework/Versions/3.8/lib/python3.8/site-packages/tensorflow/python/eager/function.py:2057 add_gradient_functions_to_graph
    self._delayed_rewrite_functions.forward_backward())
/Library/Frameworks/Python.framework/Versions/3.8/lib/python3.8/site-packages/tensorflow/python/eager/function.py:631 forward_backward
    forward, backward = self._construct_forward_backward(num_doutputs)
/Library/Frameworks/Python.framework/Versions/3.8/lib/python3.8/site-packages/tensorflow/python/eager/function.py:674 _construct_forward_backward
    func_graph_module.func_graph_from_py_func(
/Library/Frameworks/Python.framework/Versions/3.8/lib/python3.8/site-packages/tensorflow/python/framework/func_graph.py:990 func_graph_from_py_func
    func_outputs = python_func(*func_args, **func_kwargs)
/Library/Frameworks/Python.framework/Versions/3.8/lib/python3.8/site-packages/tensorflow/python/eager/function.py:665 _backprop_function
    return gradients_util._GradientsHelper(  # pylint: disable=protected-access
/Library/Frameworks/Python.framework/Versions/3.8/lib/python3.8/site-packages/tensorflow/python/ops/gradients_util.py:683 _GradientsHelper
    in_grads = _MaybeCompile(grad_scope, op, func_call,
/Library/Frameworks/Python.framework/Versions/3.8/lib/python3.8/site-packages/tensorflow/python/ops/gradients_util.py:340 _MaybeCompile
    return grad_fn()  # Exit early
/Library/Frameworks/Python.framework/Versions/3.8/lib/python3.8/site-packages/tensorflow/python/ops/gradients_util.py:684 <lambda>
    lambda: grad_fn(op, *out_grads))
/Library/Frameworks/Python.framework/Versions/3.8/lib/python3.8/site-packages/tensorflow/python/ops/random_grad.py:114 _StatelessRandomGammaV2Grad
    alpha_broadcastable = add_leading_unit_dimensions(alpha,
/Library/Frameworks/Python.framework/Versions/3.8/lib/python3.8/site-packages/tensorflow/python/ops/random_grad.py:35 add_leading_unit_dimensions
    [array_ops.ones([num_dimensions], dtype=dtypes.int32),
/Library/Frameworks/Python.framework/Versions/3.8/lib/python3.8/site-packages/tensorflow/python/util/dispatch.py:201 wrapper
    return target(*args, **kwargs)
/Library/Frameworks/Python.framework/Versions/3.8/lib/python3.8/site-packages/tensorflow/python/ops/array_ops.py:3120 ones
    output = _constant_if_small(one, shape, dtype, name)
/Library/Frameworks/Python.framework/Versions/3.8/lib/python3.8/site-packages/tensorflow/python/ops/array_ops.py:2804 _constant_if_small
    if np.prod(shape) < 1000:
<__array_function__ internals>:5 prod
    
/Library/Frameworks/Python.framework/Versions/3.8/lib/python3.8/site-packages/numpy/core/fromnumeric.py:3030 prod
    Returns
/Library/Frameworks/Python.framework/Versions/3.8/lib/python3.8/site-packages/numpy/core/fromnumeric.py:87 _wrapreduction
    return ufunc.reduce(obj, axis, dtype, out, **passkwargs)
/Library/Frameworks/Python.framework/Versions/3.8/lib/python3.8/site-packages/tensorflow/python/framework/ops.py:852 __array__
    raise NotImplementedError(

NotImplementedError: Cannot convert a symbolic Tensor (gradients/stateless_random_gamma/StatelessRandomGammaV2_grad/sub:0) to a numpy array. This error may indicate that you're trying to pass a Tensor to a NumPy call, which is not supported`

Breaking change with tfp==0.14.0

Hi @WillianFuks , just wanted to give you a heads up that the latest version of tfp, 0.14.0 released on Sep 15, 2021 causes some examples in this repo to break.

For e.g., this code:

import pandas as pd
from causalimpact import CausalImpact


data = pd.read_csv('https://raw.githubusercontent.com/WillianFuks/tfcausalimpact/master/tests/fixtures/comparison_data.csv', index_col=['DATE'])
pre_period = ['2019-04-16', '2019-07-14']
post_period = ['2019-7-15', '2019-08-01']
ci = CausalImpact(data, pre_period, post_period, model_args={'fit_method': 'hmc'})

gives this error:

ValueError: Pandas DataFrame or Series has a DatetimeIndex with no set frequency, but STS requires regularly spaced observations. Consider using `tfp.sts.regularize_series` to infer a frequency and build a regularly spaced series (by marking unobserved steps as missing observations).

for now, I downgraded tfp to 0.13.0 in my conda env, and that seems to have fixed the issue - a quick fix might be to fix the version of tfp that is installed along with this repo.

thanks,

is there a way to check the coefficient of regression part ?

Is there a way we can check the Beta of the regressors we have in the model?
if we have multiple regressors in the model and want to see the contribution of each regressor to the accumulative impact, how do we process it? the idea is to see what regressors' importance rank and how much the impact is for each regressor for a significant intervention effect on y

thanks for your insights.

Get weights of each covariate used

Is there any way to see the weights assigned to each of the covariates? I tried the ci.model_samples[2].numpy().mean(axis=0), but it only gives back one value. I would like to know the importance of each control country (country = column in dataframe) to get an estimate of the target country. It would be interesting to see for instance that target country X was reconstructed by a large part of control country A and a smaller part of control country B.

Performance comparison to R package

First of all: Thanks a lot for porting this package to Python. It's greatly appreciated.
I'm using the R version quite a lot, often on larger data sets. Mostly, I match a lot of observations in parallel. Hence, speed of computation is an important issue.
It would be great to be able to switch to this implementation. However, I'm wondering whether you have any data or experience comparing computation time between the two versions?

Type-error

Hello there,

All of a sudden I've this type error. The code was running smooth until today morning, but when I tried to rerun the same script in the afternoon, I get the attached error. I tried deleting my virtual environment and, then reinstalling the package, but the same problem persists. Can you please let me know how can I rectify this issue?
Screenshot 2022-09-19 at 15 27 21

Thanks,
Arun

Change number of iteration of MCM when fitting the model

Hi Will,

first of all, thank you and congrats for the gret work of translating this package in Python.

In my company I am currently working on implementing a Causal Inference use case, by using your library, and I am struggling with the possibility of changing the number of iteration of the Markov Chain estimation procedure.

Particularly in the docstring I see that in model_args there is not the possibility to set the niter argument, anyway when I run ci.model_args, I get as output this dictionary
{'standardize': True,
'prior_level_sd': 0.01,
'nseasons': 7,
'season_duration': 1,
'fit_method': 'hmc',
'niter': 1000}
which is making me thinking that changing the number of iteration it is actually possible.
In the light of this idea I have tried to run the following code
ci = CausalImpact(data, pre_period, post_period, model_args= {"standardize" : True, "prior_level_sd" : 0.01,
"nseasons" : 7, "season_duration" : 1, "fit_method" : "hmc", "niter" : 5000})

which lead to an output of ci.model_args equal to
{'standardize': True,
'prior_level_sd': 0.01,
'nseasons': 7,
'season_duration': 1,
'fit_method': 'hmc',
'niter': 5000}
So I was totally sure that I founded the way to change the number of iteration of the Markov Chain procedure, but then I realized that all the posterior drawn from this model has a length equal to 100, while they should be equal to 5000. In other word if I run ci.model_samples[i].shape I got 100 as first number and not 5000, for any i in len(ci.model_samples)

Can you please explain to me what does it mean and, and particularly what is the relationship between the length of the posterior sample drawn and the number of iterations of the Markov chain procedure and how to generally change it.

Thank you in advance for your support

Problems with the tensorflow_probability

Hi @WillianFuks, after some months using your lib, today I tried to execuse a old notebook that was working 2 week ago and this error is show: "AttributeError: module 'tensorflow_probability.python.sts' has no attribute 'regularize_series'"

I saw this problem is similar to the issue 29 ( Getting an error #29 ) closed in 2021. Maybe it is a new update of the tensorflow lib?

Documentation

It would be really great if there was some good documentation on what are the possible arguments of the function(s) and how to use them.

For instance from the source code I see that the python version is behind the R package. In the R package, the causal impact function accepts another argument (dynamic regression) which here seems not available.

Add compatibility for Python 3.10

Hey, thanks for this cool project! Unfortunately I am unable to use it on Fedora 36 since it ships with Python 3.10 and pip is denying the installation. Would be great if you could add compatibility for Python 3.10 (or even 3.11)!

Calculation of Posterior Probability

First of all,

thank you very much for translating this package into Python, based on Tensorflow Probabilities! Working with it and receiving results is super smooth and simple!

However, I have some problems understanding how the posterior probabilities are calculated in order to interpret them correctly. Therefore, I would like to ask for an explanation of how the "Posterior tail-area probability p" and the "Posterior probability of a causal effect" are calculated/derived. Not in a mathematical sense, but more in an explainable way like it is done in this thread about "Posterior tail-area probability p": https://stats.stackexchange.com/questions/263763/what-does-posterior-tail-area-probability-mean-in-causal-impact

Thanks, Elias

InvalidArgumentError: Cholesky decomposition was not successful. The input might not be valid. [Op:Cholesky]

Hi Will,
I got the following error while reproducing your results from the medium post.

import tensorflow_probability as tfp
from causalimpact.misc import standardize

normed_data, mu_sig = standardize(data)
obs_data = normed_data['BTC-USD'].loc[:'2020-10-14'].astype(np.float32)
design_matrix = pd.concat(
[normed_data.loc[pre_period[0]: pre_period[1]], normed_data.loc[post_period[0]: post_period[1]]]
).astype(np.float32).iloc[:, 1:]
linear_level = tfp.sts.LocalLinearTrend(observed_time_series=obs_data)
linear_reg = tfp.sts.LinearRegression(design_matrix=design_matrix)
month_season = tfp.sts.Seasonal(num_seasons=4, num_steps_per_season=1, observed_time_series=obs_data, name='Month')
year_season = tfp.sts.Seasonal(num_seasons=52, observed_time_series=obs_data, name='Year')
model = tfp.sts.Sum([linear_level, linear_reg, month_season, year_season], observed_time_series=obs_data)

pre_period = ['2018-01-03', '2020-10-14']
post_period = ['2020-10-21', '2020-11-25']

ci = CausalImpact(data, pre_period, post_period, model=model)

Output:

WARNING:tensorflow:@custom_gradient grad_fn has 'variables' in signature, but no ResourceVariables were used on the forward pass.

InvalidArgumentError Traceback (most recent call last)
in ()
----> 1 ci = CausalImpact(data, pre_period, post_period, model=model, model_args={'prior_level_sd': 0.1})

9 frames
in init(*args, **kwargs)

/usr/local/lib/python3.7/dist-packages/six.py in raise_from(value, from_value)

InvalidArgumentError: Cholesky decomposition was not successful. The input might not be valid. [Op:Cholesky]

Interestingly, when I don't use the year-season component in the model (tf.sts.sum) I don't get an error.

Can you please help me regarding this issue?
Thank you in advance.

TypeError: ufunc 'isfinite' not supported for the input types

Good afternoon, after the update, the following error occurred.

TypeError: ufunc 'isfinite' not supported for the input types, and the inputs could not be safely coerced to any supported types according to the casting rule ''safe''.

The code worked fine before. Summary and report are also shown, the error appears only when you try to draw a graph.

Rollback to the previous version could not, the error now appears on any versions.
image
image

Multiple controls supported?

Hey, I was wondering if multiple controls were supported?

For instance, imagine you have one treated country and multiple untreated countries and you want to estimate the effect (on revenue e.g.) of marketing in the treated country with respect to the untreated control countries. Is it possible to indicate which country is the treated one and which are the control groups? Otherwise, if you feed the revenue for each day for each country to the causal model, how does it know that country 1 is treated and the others are untreated (and should hence be used to create the synthetic control)?

Thanks in advance!

Fix for Dark Mode for plots?

Hi,
I have tried using different dark mode options for the plots locally, but because of some hard-coded colors they become a bit hard to read.

Any chance the hard-coded colors could be modified or even removed?

Thank you for your work and your time.

comparison of output (impact$series$cum.effect) in Python and R packages

thanks for the great effort in keeping this library updated.

I'm working on converting an R library to Python, and the R library has the following line of code:

preperiod <- subset(impact$series, cum.effect == 0)

where impact is the output object of the CausalImpact library.

From what I can tell:

impact$series$cum.effect in R is computed in impact.inferences.post_cum_effects_means in python.

I used the comparison example that you have provided in the README (with comparison_data.csv), but I'm getting different output. From the R library, the values of impact$series$cum.effect start with zero in the earlier dates, whereas it is NaN in the Python package, the values for the later dates differ as well.

I'd greatly appreciate some feedback on comparing the output so I can covert the following line of code to Python appropriately:

preperiod <- subset(impact$series, cum.effect == 0)

I tried both methods: hmc and vi, and the output of the other columns in impact$series is different from impact.inferences in python as well.

thank you and looking forward to hearing back from you

Using tfcausalimpact for forecasting

As this relies on the BSTS methodology, is there a way to use tfcausalimpact for forecasting alone, i.e. setting the post-period to values beyond the final timestamp of the available data? R BSTS of course implements forecasting functionality, and while tfcausalimpact essentially fits the same model under the hood, I can't figure out how to use this appropriately to forecast forward in time.

Any ideas or hack-y approaches are welcome. At some point I can probably contribute to the project to do this if it's not yet available.

Thanks!

Installation error: TensorFlow dependency

I successfully downloaded TensorFlow and TensorFlow probability on M1 12.0 macOS into a Conda environment. When pip installing ufcausalimpact into the environment I get the following error. Note: I can successfully import TensorFlow within the Conda environment's python. I installed TensorFlow following these instructions. I installed python 3.8.10 using pyenv.

Collecting tfcausalimpact
  Using cached tfcausalimpact-0.0.9.tar.gz (34 kB)
  Preparing metadata (setup.py) ... done
Collecting jinja2
  Downloading Jinja2-3.0.3-py3-none-any.whl (133 kB)
     |████████████████████████████████| 133 kB 2.6 MB/s            
Collecting pandas
  Downloading pandas-1.3.5.tar.gz (4.7 MB)
     |████████████████████████████████| 4.7 MB 6.7 MB/s            
  Installing build dependencies ... done
  Getting requirements to build wheel ... done
  Preparing metadata (pyproject.toml) ... done
Collecting tfcausalimpact
  Using cached tfcausalimpact-0.0.8.tar.gz (34 kB)
  Preparing metadata (setup.py) ... done
  Using cached tfcausalimpact-0.0.6.tar.gz (33 kB)
  Preparing metadata (setup.py) ... done
  Downloading tfcausalimpact-0.0.5.tar.gz (33 kB)
  Preparing metadata (setup.py) ... done
  Downloading tfcausalimpact-0.0.4.tar.gz (34 kB)
  Preparing metadata (setup.py) ... done
  Downloading tfcausalimpact-0.0.3.tar.gz (33 kB)
  Preparing metadata (setup.py) ... done
  Downloading tfcausalimpact-0.0.2.tar.gz (33 kB)
  Preparing metadata (setup.py) ... done
  Downloading tfcausalimpact-0.0.1.tar.gz (33 kB)
  Preparing metadata (setup.py) ... done
  Downloading tfcausalimpact-0.0.0.tar.gz (33 kB)
  Preparing metadata (setup.py) ... done
ERROR: Cannot install tfcausalimpact==0.0.0, tfcausalimpact==0.0.1, tfcausalimpact==0.0.2, tfcausalimpact==0.0.3, tfcausalimpact==0.0.4, tfcausalimpact==0.0.5, tfcausalimpact==0.0.6, tfcausalimpact==0.0.8 and tfcausalimpact==0.0.9 because these package versions have conflicting dependencies.

The conflict is caused by:
    tfcausalimpact 0.0.9 depends on tensorflow
    tfcausalimpact 0.0.8 depends on tensorflow
    tfcausalimpact 0.0.6 depends on tensorflow
    tfcausalimpact 0.0.5 depends on tensorflow
    tfcausalimpact 0.0.4 depends on tensorflow
    tfcausalimpact 0.0.3 depends on tensorflow
    tfcausalimpact 0.0.2 depends on tensorflow
    tfcausalimpact 0.0.1 depends on tensorflow
    tfcausalimpact 0.0.0 depends on tensorflow

ci.plot() doesn't work

both: 1) print(ci.summary()) 2)print(ci.summary(output='report'))
is working

but both: 1) ci.plot() 2) ci.plot(panels=['pointwise','cumulative'], figsize=(12, 8));
does not

image
image

Causal Impact and no effect

Hi @WillianFuks and thank you for that package,

I was wondering if tfcausalimpact is capable of saying "the event has no impact on Y" with a p-value<0.05 ?
For example:
I am running tfcausalimpact between a Y and X that has a 0.93 pearson correlation for the pre-period. So I am confident about the quality of X to be link to Y and the p-value is 0.32.

Knowing that, can I say "no effect" or I can just say "I don't know".
I know it's not an question related to the package, but I am kind of stuck with that question, if you could help it will be great.

ps: I put the full report below (I can't share the data).

Analysis report {CausalImpact}------------------------------------------------------

During the post-intervention period, the response variable had
an average value of approx. 327184.03. In the absence of an
intervention, we would have expected an average response of 308917.78.
The 95% interval of this counterfactual prediction is [210992.7, 394620.11].
Subtracting this prediction from the observed response yields
an estimate of the causal effect the intervention had on the
response variable. This effect is 18266.25 with a 95% interval of
[-67436.08, 116191.33]. For a discussion of the significance of this effect,
see below.

Summing up the individual data points during the post-intervention
period (which can only sometimes be meaningfully interpreted), the
response variable had an overall value of 981552.12.
Had the intervention not taken place, we would have expected
a sum of 926753.38. The 95% interval of this prediction is [632978.11, 1183860.33].

The above results are given in terms of absolute numbers. In relative
terms, the response variable showed an increase of +5.91%. The 95%
interval of this percentage is [-21.83%, 37.61%].

This means that, although the intervention appears to have caused a
positive effect, this effect is not statistically significant when
considering the entire post-intervention period as a whole. Individual
days or shorter stretches within the intervention period may of course
still have had a significant effect, as indicated whenever the lower
limit of the impact time series (lower plot) was above zero.

The apparent effect could be the result of random fluctuations that
are unrelated to the intervention. This is often the case when the
intervention period is very long and includes much of the time when
the effect has already worn off. It can also be the case when the
intervention period is too short to distinguish the signal from the
noise. Finally, failing to find a significant effect can happen when
there are not enough control variables or when these variables do not
correlate well with the response variable during the learning period.

The probability of obtaining this effect by chance is p = 32.47%.
This means the effect may be spurious and would generally not be
considered statistically significant.

AttributeError: 'CausalImpact' object has no attribute 'inferences'

Hello!

I've been trying to use the library as it's exactly what I would need, but I keep receiving the error "AttributeError: 'CausalImpact' object has no attribute 'inferences'" everytime.

This is what my Jupyter Notebook looks like:

Capture1

And these are the errors:

Capture2

I am also attaching the csv example file FYI:

example_Github.csv

Thanking you in advance for your support and wishing you an excellent New Year!

Regards,

Ainhoa

Installation

Hey, this will be a very beginner question, but I've just installed tensorflow and all the accompanying stuff. When I run your example, I get a TypeError. Any idea on what's causing this?

TypeError: TF_TryEvaluateConstant_wrapper(): incompatible function arguments. The following argument types are supported:
1. (arg0: tensorflow.python.client._pywrap_tf_session.TF_Graph, arg1: tensorflow.python.client._pywrap_tf_session.TF_Output) -> object

Invoked with: <tensorflow.python.framework.c_api_util.ScopedTFGraph object at 0x7fe4b0125d60>, <tensorflow.python.client._pywrap_tf_session.TF_Output object at 0x7fe4845ea130>

Saving Figures of the Model Output

I want to save original figures but model.plot() returns None so that I could not save them with high quality. Adding such a feature definitely will be helpful.

[Request] Is the A/A test function inappropriate?

Thank you for a very nice package.

I'm trying to switch from pycausalImapct recently, and I don't fully understand this module yet, so I'll only provide some ideas today.
[Idea].
How about adding a feature like so-called A/A test?

[Contents]
For the period before the true intervention:

  • We can set up a pseudo-intervention [randomly or as a split observation window] for the period before the intervention.
  • Estimate the causal impact (ATE / p-value) of the same observation period after the pseudo-intervention.
  • Repeat n times.
    => Compare the distribution of the estimates of the n pseudo-interventions with the estimates of the true intervention (ATE / p-value) to confirm the veracity of this study.

[The following is just an image]

  • The data is the same as Google's blog post
  • As you can see, the process is very inefficient, so please refer to the following just to share my idea. (This code could be made smarter by switching to sequential learning instead of batch learning.)
  • By the way, the following still uses pycausalImpact. I apologize for the inconvenience.
 impact_model = causalimpact.CausalImpact(df[["DEXUSUK", "DEXUSEU"]], PRE_PERIOD, POST_PERIOD, nseasons=[{'period': 7, 'harmonics': 2}])

list_date = list(df[: PRE_PERIOD[1]].index)
post_n = 21
test_n = 50
test_result = []
minimum_n = 50
y_col = "DEXUSUK"

# True intervention data will also be included for comparison.
postterm_estimated = pd.concat([impact_model.inferences, df[y_col]], axis=1).dropna()
postterm_estimated[f"aatest_no"] = "real_test"
postterm_estimated[f"pseudo_intervention"] = POST_PERIOD[0]
postterm_estimated["p_value"] = impact_model.p_value
postterm_estimated["train_datasize"] = len(df[: PRE_PERIOD[1]])
test_result.append(postterm_estimated)

for i in tqdm(range(1, test_n + 1)):
    if post_n * i + minimum_n >= len(list_date):
        # Minimum sample size required for learning
        break

    temp_pre_period = [list_date[0], list_date[-post_n * i]]
    temp_post_period = [list_date[-post_n * i + 1], list_date[-post_n * i + post_n - 1]]

    temp_df = df[: temp_post_period[1]][["DEXUSUK", "DEXUSEU"]]

    # TODO: I'm doing batch processing, which is very inefficient (since I'm discarding the results of the previous learning process). I'm now considering improving it to sequential learning.
    temp_impact_model = causalimpact.CausalImpact(
            temp_df,
            temp_pre_period,
            temp_post_period,
            nseasons=[{"period": 7, "harmonics": 2}],
     )

    postterm_estimated = pd.concat([temp_impact_model.inferences, temp_df[y_col]], axis=1).dropna()
    postterm_estimated[f"aatest_no"] = f"aatest_{i}"
    postterm_estimated[f"pseudo_intervention"] = temp_post_period[0]
    postterm_estimated["p_value"] = temp_impact_model.p_value
    postterm_estimated["train_datasize"] = len(df[: temp_pre_period[1]])

    test_result.append(postterm_estimated)

aatest_df = pd.concat(test_result).sort_index()
aatest_table = aatest_df.groupby("aatest_no").agg(
    {
        "point_effects": np.mean,
        "p_value": "max",
        "pseudo_intervention": "max",
        "preds": np.count_nonzero,
        "train_datasize": "max",
    }
)
aatest_table.columns = [
    "Absolute effect",
    "Posterior tail-area probability (p-value)",
    "pseudo_intervention",
    "simulation_termsize",
    "train_termsize",
]

image

# plot code
intervention_idx = aatest_df.index.get_loc(POST_PERIOD[0])

psedo_idx = [
    aatest_df.index.get_loc(_date)
    for _date in aatest_table[aatest_table.index != "real_test"][
        "pseudo_intervention"
    ].values
]
psedo_idx.remove(0)  

fig = plt.figure(figsize=(15, 12))
ax = plt.subplot(3, 1, 1)
ax.plot(aatest_df[y_col], "k", label="y")
ax.plot(aatest_df["preds"], "b--", label="Predicted")
ax.axvline(aatest_df.index[intervention_idx - 1], c="r", linestyle="--")
for ind_ in psedo_idx:
    ax.axvline(aatest_df.index[ind_ - 1], c="k", linestyle="--", alpha=0.25)
ax.fill_between(
    aatest_df.index,
    aatest_df["preds_lower"],
    aatest_df["preds_upper"],
    facecolor="blue",
    interpolate=True,
    alpha=0.25,
)
ax.grid(True, linestyle="--")
ax.legend()
plt.setp(ax.get_xticklabels(), visible=False)

ax = plt.subplot(3, 1, 2, sharex=ax)
ax.plot(aatest_df["point_effects"], "b--", label="Point Effects")
ax.axvline(aatest_df.index[intervention_idx - 1], c="r", linestyle="--")
for ind_ in psedo_idx:
    ax.axvline(aatest_df.index[ind_ - 1], c="k", linestyle="--", alpha=0.25)
ax.fill_between(
    aatest_df["point_effects"].index,
    aatest_df["point_effects_lower"],
    aatest_df["point_effects_upper"],
    facecolor="blue",
    interpolate=True,
    alpha=0.25,
)
ax.axhline(y=0, color="k", linestyle="--")
ax.grid(True, linestyle="--")
ax.legend()
plt.setp(ax.get_xticklabels(), visible=False)

ax = plt.subplot(3, 1, 3, sharex=ax)
ax.plot(aatest_df["post_cum_effects"], "b--", label="Cumulative Effect")
ax.axvline(aatest_df.index[intervention_idx - 1], c="r", linestyle="--")
for ind_ in psedo_idx:
    ax.axvline(aatest_df.index[ind_ - 1], c="k", linestyle="--", alpha=0.25)
ax.fill_between(
    aatest_df["post_cum_effects"].index,
    aatest_df["post_cum_effects_lower"],
    aatest_df["post_cum_effects_upper"],
    facecolor="blue",
    interpolate=True,
    alpha=0.25,
)
ax.grid(True, linestyle="--")
ax.axhline(y=0, color="k", linestyle="--")
ax.legend()
plt.show()

image

Error when replicating example

Hi there, thanks for this package and intro notebooks, all very informative!

I've tried to replicate an example using your dataset arma_data.csv. I get an error raised by tensorflow here it is: https://pastebin.com/SVP2yigy

Similar error when I replicate the random walk process example (in one of your notebook). This 2nd one tells me that tensorflow_probability seems not to cause problems (i.e. I can simulate data using tf-probability).

On confidence intervals and uncertainty intervals

Given that this is a Bayesian method, it is strange that the uncertainty is summarized using confidence intervals as opposed to Bayesian uncertainty/probability/credibility intervals via, for instance, HDIs and also taking the mean instead of the median as the point estimate. @WillianFuks, I am curious to hear your thoughts on what is in compile_posterior_inferences:

https://github.com/WillianFuks/tfcausalimpact/blob/master/causalimpact/inferences.py#L52

Having computed samples of the target time series, it should be straightforward to summarize them pointwise via, say, hdi in arviz. Or do I miss something?

Computation on GPU is much slower than on CPU

Hi,

our dataset has 1300 rows and 5 columns. On GPU causal impact takes around 17 minutes while on CPU in takes only 2-3 minutes using this code:

casual_impact = CausalImpact(input_data_frame, pre_period, post_period, model_args = { 
    'nseasons' : 1,
    'niter': 1000,
    'prior_level_sd': 0.1,
    'fit_method': 'vi'
})

I also tried different niter and fit_method but GPU was always much slower than CPU.
Is there any issue with library in utilization of GPU or could I do something to fix it?

GPU is GeForce GTX 1080 and on the same computer we use Tensorflow in another python program, where it is much faster on GPU than on CPU as expected. We have an issue only when using this causal impact library.

Deprecation Warnings While Running Example

Hi,

This is a really great package thank you.

When I run the example from the README I get the following three warnings:

WARNING:tensorflow:From /home/michael/.local/lib/python3.8/site-packages/tensorflow/python/ops/linalg/linear_operator_diag.py:167: calling LinearOperator.__init__ (from tensorflow.python.ops.linalg.linear_operator) with graph_parents is deprecated and will be removed in a future version.
Instructions for updating:
Do not pass `graph_parents`.  They will  no longer be used.
WARNING:tensorflow:From /home/michael/.local/lib/python3.8/site-packages/tensorflow/python/ops/linalg/linear_operator_block_diag.py:223: LinearOperator.graph_parents (from tensorflow.python.ops.linalg.linear_operator) is deprecated and will be removed in a future version.
Instructions for updating:
Do not call `graph_parents`.
WARNING:tensorflow:From /home/michael/.local/lib/python3.8/site-packages/tensorflow_probability/python/distributions/distribution.py:298: MultivariateNormalFullCovariance.__init__ (from tensorflow_probability.python.distributions.mvn_full_covariance) is deprecated and will be removed after 2019-12-01.
Instructions for updating:
`MultivariateNormalFullCovariance` is deprecated, use `MultivariateNormalTriL(loc=loc, scale_tril=tf.linalg.cholesky(covariance_matrix))` instead.

Here are my package versions:

tensorflow                     2.4.1               
tensorflow-estimator    2.4.0               
tensorflow-probability  0.12.1
tfcausalimpact              0.0.1

Thanks!

p-value in the `summary` has a cap of 0.5

Hi, thanks for making this nice package!

Small question regarding the p-value from summary: From the doc here , it seems the range of p-value is from 0 to 1.

But when trying to use the package and checking the p-value from summary, it seems the cap of p-value is 0.5?

Question: Is it possible to improve speed by reusing a pre-trained model?

Hi,
thank you for all your effort in this library.

We have many datasets for which we need to compute causal impact. Currently, it is too slow to compute it on CPU or GPU.
However, these datasets have the same first rows (in pre-intervention) and only a few last rows are unique in each dataset.

We would like to do these steps in order to get better speed:

  1. Pre-train model with the common rows and save it in a file.
  2. For each dataset read a pre-trained model, update it to contain all rest rows from a dataset and compute causal impact.

Basically, it is an incremental training of an already trained model.
Is it possible to achieve this, please?

unstable predictions

This is a great work. Thank you for putting this together.

I have noticed that when I include several covariates in the model, the results become very unstable. On the same data, the result could be anything from significant to non-significant (p-value greater or less than alpha) and positive to negative relative impact values. Any idea what could be the issue. I tried different learning rates for the optimizer but had no luck. Running the algorithm in R with the same data doesn't show any instability issues.

pycausalimpact vs tfcausalimpact!

thanks for releasing another causal impact library!

do pycausalimpact and tfcausalimpact have the same functionality, and give the same output for the same set of data? how would you recommend one choose between the two?

also, I see that the way to start using both is the same: from causalimpact import CausalImpact - what if I have both python packages installed in the same conda envirnoment - how can I choose which one to use?

Thanks,

Is this the replacement for pycausalimpact?

Hi there! I noticed that the repo for pycausalimpact (https://github.com/dafiti/causalimpact) has been taken down, then saw that you were one of the key contributors to the package, then saw that you started tfcausalimpact last year and this is currently maintained. One of the main differences I noticed is that tfcausalimpact uses Tensorflow Probability under the hood, but apart from computational method, is this basically the replacement for the other package? Is pycausalimpact not being maintained by Dafiti anymore? Appreciate any response, thanks!

Absolute effect - Average positive and cumulative negative

Hi, @WillianFuks, first I would like to congratulate you for the great work done in this lib, I am using it frequently to evaluate results of experiments.

Currently, I'm trying to evaluate results after starting to use a system, the evaluation period is long. I have only one control group and I notice a big oscillation between them.

I have a doubt about the results of the summary, I have had positive average results and negative cumulative ones, I analyzed how the lib was coded and the results are not making sense. Can you help me with this? is there any explanation?

Capturar

Capturar2

I use the fit_method as hmc, but without it the result are almost the same.

I also tried an approach using the forecast of the series itself, generated in the prophet, as a control group. The results are similar.

Best,
Flávio

Question: How can I extract the betas like in the R MarketMatching package ?

Hi Will,

Thanks for converting causal impact to python! In my company, we are currently trying to convert a causal impact analysis in R (it used the MarketMatching package) to python.

We hit a small roadblock which is how to extract the values from what would be the equivalent of the analyze_betas() function in R. This is the function in R I am talking about. Do you think there is a way to extract these values using the _fit_model() method or any other method in tfcausalimpact package ?

Kind Regards,

Sara

Subtle bug with pathological column names

If data is a DataFrame that contains a column labelled 0, and this is not the first column, then this is implicitly a .loc[0] instead of a .iloc[0], meaning that the wrong mu and sigma get stored, leading to incorrect results after unstandardizing.

Since mu and sig could either be Series or ndarray, one solution is to change this line to

    mu_sig = (np.array(mu[0]), np.array(sig[0]))

mu_sig = (mu[0], sig[0])

This might sound like an unlikely scenario, but it's what you encounter when you join your y data to a separate control DataFrame that has default column names...

Example of custom model doesn't work

Hello Will,

It's me again.

Now I was trying to run example with customized model:

import tensorflow_probability as tfp


pre_y = data[:70, 0]
pre_X = data[:70, 1:]
obs_series = data.iloc[:, 0]
local_linear = tfp.sts.LocalLinearTrend(observed_time_series=obs_series)
seasonal = tfp.sts.Seasonal(nseasons=7, observed_time_series=obs_series)
model = tfp.sts.Sum([local_linear, seasonal], observed_time_series=obs_series)

ci = CausalImpact(data, pre_period, post_period, model=model)
print(ci.summary())

There are a couple of comments for this code:

  • pre_y, pre_X doesn't mention further, probably they should be pre_period, post_period
  • my data has dtype np.float64 and hence model doesn't pass check for tf.float32 on model_validation step
  • there is an error in nseasons=7 statement. Really it should be num_seasons.

Keeping all this in mind, I wrote my own lunapark:

data = generate_data()
obs_series = data.iloc[:, 0].astype("float32")
regular_data = tfp.sts.regularize_series(series=obs_series)
local_linear = tfp.sts.LocalLinearTrend(observed_time_series=regular_data)
seasonal = tfp.sts.Seasonal(num_seasons=12, observed_time_series=regular_data)
model = tfp.sts.Sum([local_linear, seasonal], observed_time_series=regular_data)

pre_period = ["2012-01-01", "2014-12-01"]
post_period = ["2015-01-01", "2016-11-01"]
ci = CausalImpact(regular_data, pre_period, post_period) # , model=model
print(ci.summary())

the whole runnable example you can find there

The problem is that this code runs with default model, but, for some unknown reason, produces nan values for the custom model. I'm looking forward to hear from your on this.

Printing averages of the posterior does not work

Hi Willian,
thank you very much for the package!

One question: following your article (https://towardsdatascience.com/implementing-causal-impact-on-top-of-tensorflow-probability-c837ea18b126), I tried to print out the averages for each model component using:

for name, values in ci.model_samples.items():
    print(f'{name}: {values.numpy().mean(axis=0)}')

However, I am getting the following error:

'list' object has no attribute 'items'

How can I get the components of the model displayed?

Many thanks!

Example with data in np.ndarray doesn't work

This snippet from CasualImpact docstring produces the error:

Python data = np.random.rand(100, 2) pre_period = [0, 69] post_period = [70, 99] ci = CausalImpact(data, pre_period, post_period) print(ci.summary()) print(ci.summary('report')) ci.plot()

Error:
/main.py:333 332 self.inferences = inferrer.compile_posterior_inferences( --> 333 self.data.index, AttributeError: 'numpy.ndarray' object has no attribute 'index'

Recommend Projects

  • React photo React

    A declarative, efficient, and flexible JavaScript library for building user interfaces.

  • Vue.js photo Vue.js

    🖖 Vue.js is a progressive, incrementally-adoptable JavaScript framework for building UI on the web.

  • Typescript photo Typescript

    TypeScript is a superset of JavaScript that compiles to clean JavaScript output.

  • TensorFlow photo TensorFlow

    An Open Source Machine Learning Framework for Everyone

  • Django photo Django

    The Web framework for perfectionists with deadlines.

  • D3 photo D3

    Bring data to life with SVG, Canvas and HTML. 📊📈🎉

Recommend Topics

  • javascript

    JavaScript (JS) is a lightweight interpreted programming language with first-class functions.

  • web

    Some thing interesting about web. New door for the world.

  • server

    A server is a program made to process requests and deliver data to clients.

  • Machine learning

    Machine learning is a way of modeling and interpreting data that allows a piece of software to respond intelligently.

  • Game

    Some thing interesting about game, make everyone happy.

Recommend Org

  • Facebook photo Facebook

    We are working to build community through open source technology. NB: members must have two-factor auth.

  • Microsoft photo Microsoft

    Open source projects and samples from Microsoft.

  • Google photo Google

    Google ❤️ Open Source for everyone.

  • D3 photo D3

    Data-Driven Documents codes.