Git Product home page Git Product logo

graphs1090's Introduction

Screenshot Screenshot

graphs1090

Screenshot 
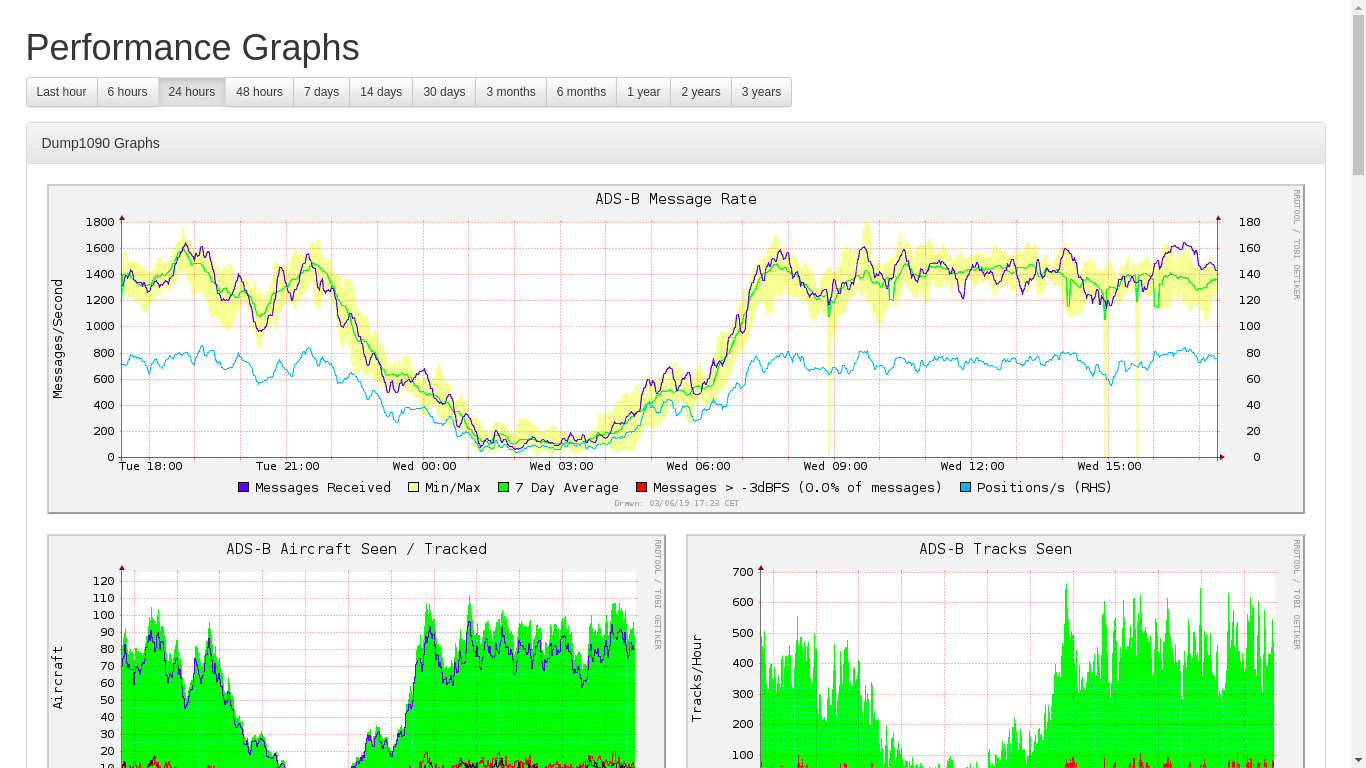
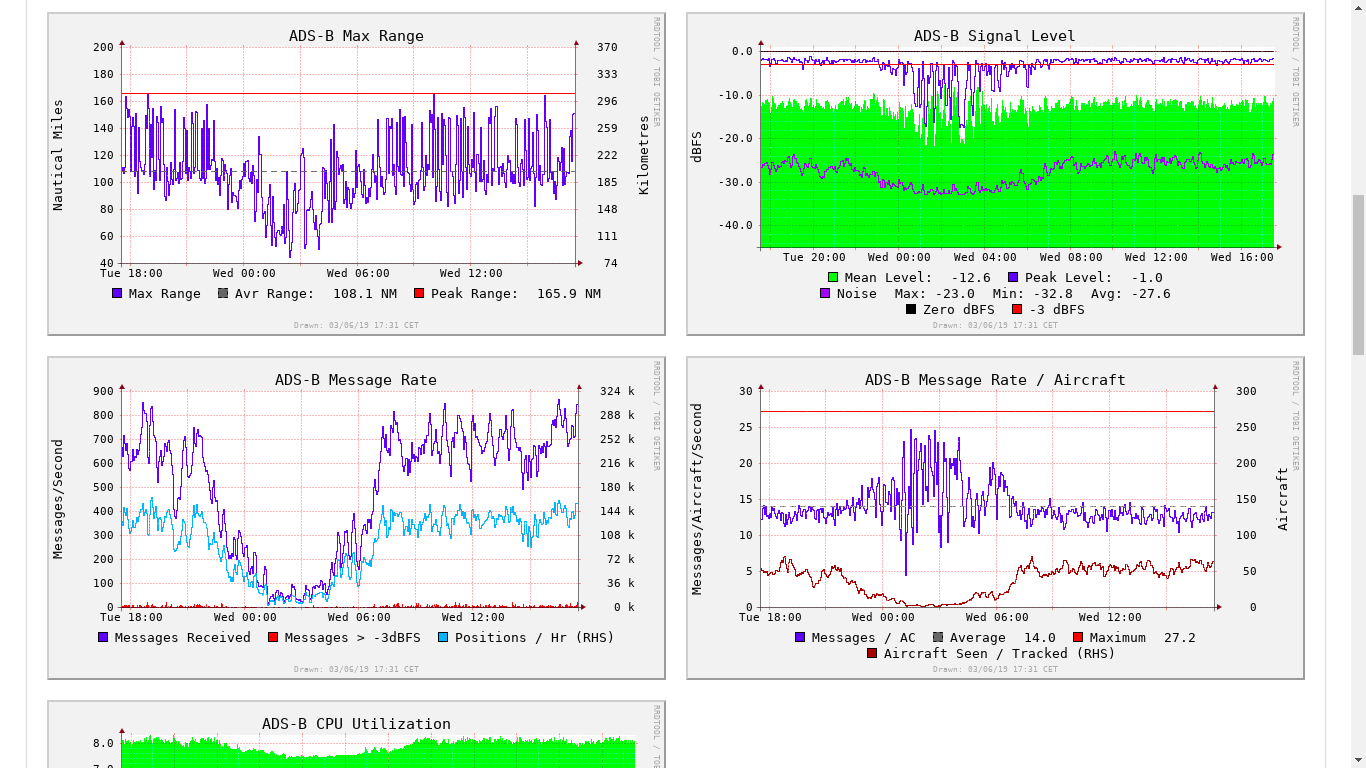
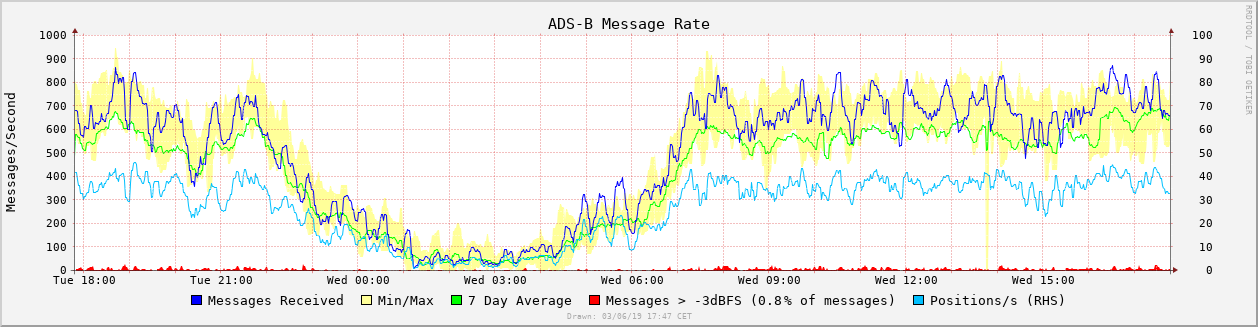
Graphs for readsb (wiedehopf fork) and dump1090-fa (based on dump1090-tools by mutability)

Also works for other dump1090 variants supplying stats.json

Installation / Update to current version:

sudo bash -c "$(curl -L -o - https://github.com/wiedehopf/graphs1090/raw/master/install.sh)"

Note on data loss: When removing or losing power you will lose graph data generated after 23:42 of the previous day. To avoid that issue sudo shutdown now before unplugging the pi. See the section on reducing writes for more detail.

Configuration (optional):

Edit the configuration file to change graph layout options, for example size:

sudo nano /etc/default/graphs1090

Ctrl-x to exit, y (yes) and enter to save.

Checkout available options: https://raw.githubusercontent.com/wiedehopf/graphs1090/master/default Recently added: colorscheme=dark

Reset configuration to defaults:

sudo cp /usr/share/graphs1090/default-config /etc/default/graphs1090

View the graphs:

Click the following URL and replace the IP address with the IP address of the Raspberry Pi you installed combine1090 on.

http://192.168.x.yy/graphs1090

or

http://192.168.x.yy/perf

or

http://192.168.x.yy:8542

Adjusting gain

The fine tuning is up to taste but quite a few setups are using way too much gain (AGC is maximum gain it does not work as intended for ADS-B). Thus i'll link some guidelines on how to set your gain: https://github.com/wiedehopf/adsb-scripts/wiki/Optimizing-gain If you can't be bothered and would rather use something automatic: https://github.com/wiedehopf/adsb-scripts/wiki/Automatic-gain-optimization-for-readsb-and-dump1090-fa

Range graph isn't working

You need to configure the location in your decoder (dump1090-fa / readsb).

My install scripts for either of them provide a handy command line utility:

Otherwise you'll have to configure the location by editing /etc/default/dump1090-fa or /etc/default/readsb. For the adsbx image the location is configured in /boot/adsb-config.txt. For the piaware image you'll need to configure the location on the online FA stats page.

Reducing writes to the sd-card (enabled by default)

To reduce writes to the sd-card, data is only written to the sd-card every 24h. Note on data loss: When removing or losing power you will lose graph data generated after 23:42 of the previous day. To avoid that issue sudo shutdown now before unplugging the pi. See the section on reducing writes for more detail. Reboots or shutdowns are not an issue and don't cause data loss.

If you want to change how often the data is written to disk, edit /etc/cron.d/collectd_to_disk and replace the content with one of the following options: (updating / running the graphs1090 install script will overwrite this to the default)


# every day at 23:42
42 23 * * * root /bin/systemctl restart collectd

# every Sunday
42 23 * * 0 root /bin/systemctl restart collectd

# every 6 hours
42 */6 * * * root /bin/systemctl restart collectd

To disable this behaviour use this command:

sudo bash /usr/share/graphs1090/git/stopMalarky.sh

To re-enable the behavrious use this command:

sudo bash /usr/share/graphs1090/git/malarky.sh

Explanation on how the above works: The configuration of the systemd service is changed so it manages the graph data in /run (memory) and only writes it to disk every night. On reboot / shutdown it's written to disk and the data loaded to /run again when the system boots back up. Up to 24h of data is lost when there is a power loss.

This has been working well and i have made it the default as many people are concerned about wearing out sd-cards.

Reducing writes to the sd-card (in case you have the above disabled, works system wide)

The rrd databases get written to every minute, this adds up to around 100 Megabytes written per hour. While most modern SD-cards should handle this for 10 or more years easily, you can reduce the amount written if you want to. Per default linux writes data to disk after a maximum of 30 seconds in the cache. Increasing this to 10 minutes reduces actual disk writes to around 10 Megabytes per hour.

Don't change this if you handle data on the Raspberry Pi which you don't want to lose the last 10 minutes of.

Increasing this write delay to 10 minutes can be done like this (takes effect after reboot):

sudo tee /etc/sysctl.d/07-dirty.conf <<EOF
vm.dirty_ratio = 40
vm.dirty_background_ratio = 30
vm.dirty_expire_centisecs = 60000
EOF

Because i don't mind losing data on my Raspberry Pi when it loses power, i have set this to one hour:

sudo tee /etc/sysctl.d/07-dirty.conf <<EOF
vm.dirty_ratio = 40
vm.dirty_background_ratio = 30
vm.dirty_expire_centisecs = 360000
EOF

Non-standard configuration:

If your local map is not reachable at /dump1090-fa or /dump1090, you can edit the following the file to input the URL of your local map:

/etc/collectd/collectd.conf

Find this section:

<Plugin python>
        ModulePath "/usr/share/graphs1090"
        LogTraces true
        Import "dump1090"
        <Module dump1090>
                <Instance localhost>
                        URL "http://localhost/dump1090-fa"
                </Instance>
        </Module>
</Plugin>

And change the URL to where your dump1090 webinterface is located. After changing the URL, restart collectd:

sudo systemctl restart collectd

Resetting the database format

Caution: while this process retains data, it can cause some data anomalies / issues, a backup is recommended before proceding. (an automatic backup is created by the script but ... better you know where your backup is)

This might be a good idea if you changed from the adsb receiver project graphs and kept the data. Also if you upgraded at a somewhen July 15th to July 16th 2019. Had a bad setting removing maximum data keeping for some part of the data.

This can be necessary to change the database to save more than 3 years of data. (if the database was created before 2022-03-20)

sudo bash -c "$(curl -L -o - https://github.com/wiedehopf/graphs1090/raw/master/install.sh)"
sudo apt update
sudo apt install -y screen
sudo screen /usr/share/graphs1090/new-format.sh

Reporting issues:

Please include the output for the following commands in error reports:

sudo systemctl restart collectd
sudo journalctl --no-pager -u collectd | tail -n40
sudo /usr/share/graphs1090/graphs1090.sh
sudo systemctl restart graphs1090

Paste the output into a pastebin: https://pastebin.com/ Then include the link and be sure to also describe the issue and also mention your system (debian / ubuntu / raspbian and RPi vs x86).

For errors like 404 or the pages not being available in the browser, do the same pastebin stuff for the output of these commands:

sudo systemctl restart lighttpd
sudo journalctl --no-pager -u lighttpd
ls /etc/lighttpd/conf-enabled

Known bugs:

disk graphs with kernel >= 4.19 don't work due to a collectd bug

collectd/collectd#2951

possible sollution: install new collectd version (only on Raspberry pi, if you are using another architecture, this package won't work)

wget -O /tmp/collectd.deb http://raspbian.raspberrypi.org/raspbian/pool/main/c/collectd/collectd-core_5.8.1-1.3_armhf.deb
sudo dpkg -i /tmp/collectd.deb

Deinstallation:

sudo bash /usr/share/graphs1090/uninstall.sh

nginx configuration:

Add the following line

include /usr/share/graphs1090/nginx-graphs1090.conf;

in the server { } section of either /etc/nginx/sites-enabled/default or /etc/nginx/conf.d/default.conf depending on your system configuration.

Don't forget to restart the nginx service.

Removing UAT / 978 graphs + data

sudo systemctl stop collectd
sudo /usr/share/graphs1090/gunzip.sh /var/lib/collectd/rrd/localhost
sudo rm /var/lib/collectd/rrd/localhost/dump1090-localhost/*978*
sudo systemctl restart collectd graphs1090

Hiding / showing 1090 graphs

(might only work after an update to the version this was introduced (December 2020))

# Hide:
sudo sed -i -e 's/id="panel_1090" style="display:block"/id="panel_1090" style="display:none"/' /usr/share/graphs1090/html/index.html
# Show:
sudo sed -i -e 's/id="panel_1090" style="display:none"/id="panel_1090" style="display:block"/' /usr/share/graphs1090/html/index.html

no http config

in collectd.conf:

  URL "file:///usr/local/share/dump1090-data"

commands:

sudo mkdir -p /usr/local/share/dump1090-data
sudo ln -s /run/dump1090-fa /usr/local/share/dump1090-data/data

Backup and Restore (same architecture)

cd /var/lib/collectd/rrd
sudo systemctl stop collectd
sudo /usr/share/graphs1090/gunzip.sh /var/lib/collectd/rrd/localhost
sudo tar -cz -f rrd.tar.gz localhost
cp rrd.tar.gz /tmp
sudo systemctl restart collectd

Backup this file:

/tmp/rrd.tar.gz

I'm not exactly sure how you would do that on Windows. Probably with FileZilla using the SSH/SCP protocol.

Install graphs1090 if you haven't already.

On the new card copy the file to /tmp using FileZilla again.

Then copy it back to its place like this:

sudo mkdir -p /var/lib/collectd/rrd/
cd /var/lib/collectd/rrd
sudo cp /tmp/rrd.tar.gz /var/lib/collectd/rrd/
sudo systemctl stop collectd
sudo /usr/share/graphs1090/gunzip.sh /var/lib/collectd/rrd/localhost
sudo tar -x -f rrd.tar.gz
sudo systemctl restart collectd graphs1090

This should be all that is required, no guarantees though!

Backup and Restore (different architecture, for example moving from RPi to x86 or the other way around)

Before proceeding, run the install / update script for graphs1090 on BOTH machines to get latest script versions.

sudo /usr/share/graphs1090/rrd-dump.sh /var/lib/collectd/rrd/localhost /tmp/xml.tar.gz

This creates XML files from the database files and places them in a designated tar.gz file which can be later restored to database files on the target system.

Copy the file xml.tar.gz to the new computer, place it in /tmp and run:

sudo /usr/share/graphs1090/rrd-restore.sh /tmp/xml.tar.gz /var/lib/collectd/rrd/localhost

Again no guarantees, but this should work.

Automatic backups

If you have the write saving measures enabled (the default), there will be automatic backups for the last 8 weeks. This feature was introduced around 2021-08-07, if you installed before that date you won't have those files.

These commands should list them:

cd /var/lib/collectd/rrd
ls

Restoring one of the backups will mean you lose all data collected after that backup. (alternatively use the data integration method explained in the next paragraph)

If you want to restore one of them for whatever reason, do the following:

cd /var/lib/collectd/rrd
sudo systemctl stop collectd
sudo tar --overwrite -x -f auto-backup-2021-week_42.tar.gz
sudo systemctl restart collectd graphs1090

You'll have to choose the week you want to restore, in the above example it's 42 (file auto-backup-2021-week_42.tar.gz).

Integrate data from two data sets (experimental, results not guaranteed and often a bit different than restoring a backup)

It's best to do a manual backup of the dataset currently being used, instructions from backup and restore apply. Often it's just better to use the old data, there are some particular changes that can occur in the data.

You'll need old data, it's best to put them in /tmp/localhost. For the automatic backups you can do that like this:

cp /var/lib/collectd/rrd/auto-backup-2021-week_42.tar.gz /tmp
cd /tmp
sudo tar --overwrite -x -f auto-backup-2021-week_42.tar.gz

Once you have the data in /tmp/localhost, proceed as follows:

sudo systemctl stop collectd
sudo /usr/share/graphs1090/gunzip.sh /var/lib/collectd/rrd/localhost
sudo /usr/share/graphs1090/rrd-integrate-old.sh /tmp/localhost
sudo systemctl restart collectd graphs1090

If it all worked, the two datasets should be integrated now.

Ubuntu 20 fixes (symptom: collectd errors out on startup)

  • also applies to: Linux Mint 20.1

Before trying this, sudo apt update and sudo apt dist-upgrade your system. If that fixes it, no need for this fix.

  • arm64 / aarch64:
echo "LD_PRELOAD=/usr/lib/python3.8/config-3.8-aarch64-linux-gnu/libpython3.8.so" | sudo tee -a /etc/default/collectd
sudo systemctl restart collectd
  • x86_64
echo "LD_PRELOAD=/usr/lib/python3.8/config-3.8-x86_64-linux-gnu/libpython3.8.so" | sudo tee -a /etc/default/collectd
sudo systemctl restart collectd
  • removing this workaround (any architecture) Undoing the solution if the logs still show failure or when the issue has been fixed in the package provided by your distribution.
sudo sed -i -e 's#LD_PRELOAD=/usr/lib/python3.8.*##' /etc/default/collectd
sudo systemctl restart collectd

Wipe the database (delete ALL DATA !!! be certain you want this)

sudo systemctl stop collectd
sudo rm /var/lib/collectd/rrd/localhost* -rf
sudo rm -f /var/lib/collectd/rrd/auto-backup-$(date +%Y-week_%V).tar.gz
sudo systemctl restart collectd graphs1090

Change the timezone used in the graphs

Either change the global system timezone or add this to /etc/default/graphs1090 using the correct timezone:

export TZ=Europe/Berlin

List the timezone name using this command:

timedatectl list-timezones

graphs1090's People

Contributors

caiusseverus avatar gtjoseph avatar lpgeek avatar mwyau avatar saturnusdj avatar varnav avatar whackyhack avatar wiedehopf avatar

Stargazers

 avatar  avatar  avatar  avatar  avatar  avatar  avatar  avatar  avatar  avatar  avatar  avatar  avatar  avatar  avatar  avatar  avatar  avatar  avatar  avatar  avatar  avatar  avatar  avatar  avatar  avatar  avatar  avatar  avatar  avatar  avatar  avatar  avatar  avatar  avatar  avatar  avatar  avatar  avatar  avatar  avatar  avatar  avatar  avatar  avatar  avatar  avatar  avatar  avatar  avatar  avatar  avatar  avatar  avatar  avatar  avatar  avatar  avatar  avatar  avatar  avatar  avatar  avatar  avatar  avatar  avatar  avatar  avatar  avatar  avatar  avatar  avatar  avatar  avatar  avatar  avatar  avatar  avatar  avatar  avatar  avatar  avatar  avatar  avatar  avatar  avatar  avatar  avatar  avatar  avatar  avatar  avatar  avatar  avatar  avatar  avatar  avatar  avatar  avatar  avatar

Watchers

 avatar  avatar  avatar  avatar  avatar  avatar  avatar  avatar  avatar  avatar  avatar  avatar  avatar  avatar  avatar  avatar  avatar  avatar  avatar  avatar  avatar  avatar  avatar  avatar  avatar  avatar  avatar  avatar  avatar  avatar  avatar  avatar  avatar  avatar  avatar  avatar  avatar  avatar  avatar  avatar  avatar  avatar  avatar  avatar  avatar  avatar

graphs1090's Issues

ADS-B Signal Level graph not showing

Updated per the instructions yesterday (to get the new Airspy specific graphs) and everything ran without any errors.
But, something seem to be broken since the "old" ADS-B Signal level graph is empty.
I've checked the rrd-file, information is written (and I've checked the values itself and the seem to be correct):

username@systemname:/run/collectd/localhost/dump1090-localhost# rrdtool last dump1090_dbfs-median.rrd 1631204583
The graph is empty, but the legend at the bottom of the graph contains numbers that seem to be appropriate.

Have tried with restarting graphs1090 and collectd. I've also cleared out the browser cache (I'm using Firefox), used another browser (new installation of chrome) but the problem still persists.

automation for netcat to get data from additional server e.g. flightfeeder

Hello,
i currently use command
nc -d 192.168.2.122 30005 | nc 127.0.0.1 30004 &
for piping the traffic from a loaned flightfeeder into my other pi, where running fr24, ps, rs24 and all the other adsb services with use of dump1090.

Problem is, if connection drops, nc cannot rebuild it - and call nc when the connection is etablished opens a second (third, forth,...) connection - and they all transmits data. So flights will be reportet twice or many at same time if this occurs. I cannot add the nc command in cron except the single one at reboot.

Question: Is there a way to detect loosing the communication (remote traffic = 0) AND give console command "nc" (one time!) with parameters as shown in this case ?

Can anybody implement this, please? It seems to be a good way to get the Flightfeeder data for all the other services, too... the reception of the Beast with the jetvision antenna is incredible ;-)

Regards
Mirco

Network Bandwidth not showing when external rather than onboard used

I've had issues with packet loss from the onboard RPi3 wifi so went back to using an old wifi stick. From then the bandwidth graph has not shown any data.

image

Journal log https://pastebin.com/HS6PHyEG

collectd has: <Plugin "interface">
Interface "wlxa0f3c11fb3ad"
Interface "enxb827eb050f57"
Interface "eth0"
Interface "wlan0"
Interface "enp0s25"
Interface "enp1s25"
Interface "wlp3s0"
Interface "wlp2s0"
Interface "wlp1s0"
Interface "wlp0s0"
Interface "eno0"
Interface "eno1"
Interface 4 is the external wifi and I have marked down the wlan0 so its not used.

1: lo: <LOOPBACK,UP,LOWER_UP> mtu 65536 qdisc noqueue state UNKNOWN mode DEFAULT group default qlen 1000
link/loopback 00:00:00:00:00:00 brd 00:00:00:00:00:00
2: enxb827eb050f57: <NO-CARRIER,BROADCAST,MULTICAST,UP> mtu 1500 qdisc pfifo_fast state DOWN mode DEFAULT group default qlen 1000
link/ether b8:27:eb:05:0f:57 brd ff:ff:ff:ff:ff:ff
3: wlan0: <BROADCAST,MULTICAST> mtu 1500 qdisc pfifo_fast state DOWN mode DORMANT group default qlen 1000
link/ether b8:27:eb:50:5a:02 brd ff:ff:ff:ff:ff:ff
4: wlxa0f3c11fb3ad: <BROADCAST,MULTICAST,UP,LOWER_UP> mtu 1500 qdisc mq state UP mode DORMANT group default qlen 1000
link/ether a0:f3:c1:1f:b3:ad brd ff:ff:ff:ff:ff:ff

And in the folder I can see /var/lib/collectd/rrd/localhost/interface-wlxa0f3c11fb3ad/

Nothing on the journal log mentions the interface though.

FFT Graph

Hi there,
first of all I have to thank you very much for your work! I see your Name everywhere if i search a solution when i'm getting stucked with my Pi.
Well i have a suggestion for some new Graphs. Might it possible to generate a graph like an FFT? Something like Level-bins or Range-bins over a certain time.
regards,
Volker

Is it possible to disable certain graphs?

I am running on a RPi Zero, which of course if quite under-powered. I am seeing fairly high CPU usage with Graphs1090 running, so was wondering if I could save a bit of CPU time by disabling data collection on certain graphs that I am not interested in. Is that possible via the config file?

Disk usage

Hi @wiedehopf, I installed latest versione of your dashboard and I noticed that disk usage is increasing day by day as shown in pic attached. How can I stop this behavior? I'm not getting why so many MBs are saved, and where.

system-localhost-df_root-7d

Linux VM network interface name

I run my ADS-B tracking in a Debian Buster VM, rather than on a RPi. USB passthrough of the SDR works just fine under KVM, and I save the Watts consumed by a separate device by running on a VM host that I already have running 24x7 for other local services anyway.

Debian Buster udev rules rename the vertio-based network interface to ens18. I had to manually add this to the collectd.conf file in the Interfaces section. As I expect this is one of those things where you'd always be chasing additions (a RHEL/CentOS VM would name it differently again), maybe consider making this auto-adapt? Maybe the install.sh script does a little magic to suss out the active interface and then updates a placeholder anchor in collectd.conf itself. Or just not worry about filtering to specific interfaces and let collectd.conf collect all, since running in a VM or on a real RPi, you're unlikely to have extraneous interfaces anyway. You'd just need to make sure your graph generation knows to skip the loopback interface data collected.

The VM also fails to capture CPU temperature, as that's reading an RPi-specific kernel stat which doesn't exist in a VM. Maybe the install script could check for this and remove it from both the collectd.conf config and from the graph generation script?

Thanks

Stock Install - No signal graph

From a bare jessie image with dump1090-fa working fine I installed the graphs1090 code and all works well apart from the signal graph. I get a 404 error for the image on all time ranges (1h, 24h etc) on the http://localhost/graphs1090 page

No images with the name of signal in the /run/graphs1090 drrectory

Recent addition of systemd warning

Following commit a924eaa, I receive a warning from systemd every day at 23:42 when the job in /etc/cron.d/collectd_to_disk runs:

Warning: The unit file, source configuration file or drop-ins of collectd.service changed on disk. Run 'systemctl daemon-reload' to reload units.

This can be resolved with "systemctl daemon-reload" until the next reboot and then it returns.

Can this be resolved permanently in graphs1090? Thanks.

CPU temperature in Graph is case temperature and not CPU

I am using a LENOVO M900. The sensor are:

acpitz-acpi-0
Adapter: ACPI interface
temp1: +27.8°C (crit = +119.0°C)
temp2: +29.8°C (crit = +119.0°C)

coretemp-isa-0000
Adapter: ISA adapter
Package id 0: +59.0°C (high = +84.0°C, crit = +100.0°C)
Core 0: +58.0°C (high = +84.0°C, crit = +100.0°C)
Core 1: +58.0°C (high = +84.0°C, crit = +100.0°C)
Core 2: +55.0°C (high = +84.0°C, crit = +100.0°C)
Core 3: +56.0°C (high = +84.0°C, crit = +100.0°C)

The graph is displaying the ACPI and not the core temperature.

Raspberry CPU temperature

As in the first group of graphs there is an odder number of graphs , I ask if is it feasible a new feature, a CPU temperature graph. That should be very helpful. It seems that’s quite ease to implement this feature.At least for my needs that should be very useful. Thanks for the good job. Regards, Jacques
PS I don’t know if it is the right place to ask a new feature but, for me, seems to be.

Add cpu core temps to graphs1090

I travel in a motorhome and when parked I have a pi4 and Airspy mini in a mast-mounted outdoor enclosure just below my antenna. This entire setup is powered using POE from inside the RV. A temp sensor in the box allows me to monitor the temp of the box itself and turn on a fan if things get too hot.

I just installed graphs1090 and it seems like a great tool for long-term tuning of piaware/airspy_adsb. After thinking about it, I thought It would be nice to track CPU core temp as well. Any chance you could also add the CPU temp to the graphs?

cat /sys/class/thermal/thermal_zone0/temp divided by 1000 gives you the CPU temp in Celsius.

collectd Warning No JSON object could be decoded

Hello,

On my raspberry Pi I am getting every minute the following error message in my syslog
collectd
raspberrypiwatch
Warning
No JSON object could be decoded

Is there anything I can suspend or fix to get rid of it?

Spike in Tracks after dump restart

Hi there,
everytime i restart the dump-service, i get a hughe spike in the "ADS-B Tracks Seen" with more than one message. Is there any possibility to prevent this?
I think its like startup with a bunch of old data. So that counts in Msg per second and spikes the graph.

Graphs with local timezone instead of UTC

rrdtool graph outputs with graphs in UTC. Some people (well, at least me) may prefer their graphs to be in their local timezone or maybe some other timezone altogether. A quick hack to do this is to add the following to /etc/default/graphs1090:

# set time zone for rrdtool graphs
export TZ=PST8PDT

Changing TZ to whatever timezone you want. Now when rrdtool graph runs it picks up $TZ and creates the graphs in the timezone that is set.

I realise this is not the prettiest solution - the export feels wrong but without it TZ is not passed onto rrdtool. There may be a better place to set this - but this works.

Note that this does not affect collectd - it still dumps data to the RRD database in UTC because the collectd service is not running /etc/default/graphs1090. This only affects the graphs at build time - they end up with the timezone displayed in the 'Drawn: xxxxx' note at the bottom of a graph.

The changes to /etc/default/graphs1090 above result as in the example below after restarting using sudo systemctl restart graphs1090:

Screen Shot 2022-08-15 at 19 31 17

I can fork and PR if you want to include this or if you don't then that's fine with me too - I have my local hack ;-)

CPU Utilization graph is very difficult to read

That graph uses green, green and green for the colors. A one line change will make the "Other" graph a yellow/orange color but make it whatever you want.

Search for "CPU Utilization" to home in on it. Nice tool! SO much data!!

This is in /usr/share/graphs1090/graphs1090.sh

    rrdtool graph \
            "$1.tmp" \
            --start end-$4 \
            $small \
            --title "$3 CPU Utilization" \
            --units-exponent 0 \
            --vertical-label "CPU %" \
            --lower-limit 0 \
            --upper-limit 5 \
            $upper \
            --right-axis 1:0 \
            --left-axis-format "%.0lf" \
            --right-axis-format "%.0lf" \
            "DEF:demod=$(check $2/dump1090_cpu-demod.rrd):value:AVERAGE" \
            "CDEF:demodp=demod,10,/" \
            "DEF:reader=$(check $2/dump1090_cpu-reader.rrd):value:AVERAGE" \
            "CDEF:readerp=reader,10,/" \
            "DEF:background=$(check $2/dump1090_cpu-background.rrd):value:AVERAGE" \
            "CDEF:backgroundp=background,10,/" \
            $airspy_graph1 \
            $airspy_graph2 \
            $airspy_graph3 \
            "AREA:readerp#008000:USB" \
            "AREA:backgroundp#FFC000:Other:STACK" \                     # Change the "Other" color here to a yellow/orangey color.  Was 00C000
            "AREA:demodp#$GREEN:Demodulator\c:STACK" \
            "COMMENT: \n" \
            --watermark "Drawn: $nowlit";
    mv "$1.tmp" "$1"
    }

SDR Gain Graph

Now that dump1090 v6.1 has adaptive-gain and adaptive-burst modes, I would welcome an additional graph showing the SDR gain values, maybe together with some related values like the actual dynamic range and the alternative noise value. Is that something that is easy to implement? For me it would certainly add significant value ...

Update breaks on Debian Bullseye...

...with the error message
E: Command line option 'n' [from -no-install-suggests] is not understood in combination with the other options. ERROR on line number 40

Bandwidth Usage graph does not populate.

image
All other graphs appear fine, have attempted to reinstall multiple times using the following command: sudo bash -c "$(wget -q -O - https://raw.githubusercontent.com/wiedehopf/graphs1090/master/install.sh)" but does not appear to resolve things. Unsure what else I may be doing incorrectly, as I've recently migrated from RPi (ARM) running Raspbian 10 Lite to an old PC (x86_64) running pure Debian 10. Thanks in advance for any assistance. Perhaps it's just a quirk of this old hardware.

       _,met$$$$$gg.          [email protected]
    ,g$$$$$$$$$$$$$$$P.       ------------
  ,g$$P"     """Y$$.".        OS: Debian GNU/Linux 10 (buster) x86_64
 ,$$P'              `$$$.     Host: EL1330
',$$P       ,ggs.     `$$b:   Kernel: 4.19.0-13-amd64
`d$$'     ,$P"'   .    $$$    Uptime: 1 day, 21 hours, 25 mins
 $$P      d$'     ,    $$P    Packages: 1767 (dpkg)
 $$:      $$.   -    ,d$$'    Shell: bash 5.0.3
 $$;      Y$b._   _,d$P'      Terminal: /dev/pts/0
 Y$$.    `.`"Y$$$$P"'         CPU: AMD Athlon 2850e (1) @ 1.800GHz
 `$$b      "-.__              GPU: NVIDIA GeForce 6150SE nForce 430
  `Y$$                        Memory: 665MiB / 1740MiB
   `Y$$.
     `$$b.
       `Y$$b.
          `"Y$b._
              `"""

Add graph last 1 Hours ?

Is it possible to add the last hour elapsed in the Performance Graphs display?

And for your information I was able to import the graphs of my old application adsb-receiver_2.6.3_dump1090-mutability_raspbian-stretch-lite by following your Backup and Restore advice (different architecture), then relaunch the script :
sudo /bin/bash /usr/share/graphs1090/service-graphs1090.sh

Thank you for your work @wiedehopf !

RPi3B (non plus) issue after latest Raspberry Pi OS [formerly Raspbian] updates.

After issuing the following command to update my installation, which have not been recording graphs in 2+ weeks now, I was presented with the following issues/errors:

sudo bash -c "$(wget -q -O - https://raw.githubusercontent.com/wiedehopf/graphs1090/master/install.sh)"

Already on 'master'
Your branch is up to date with 'origin/master'.
remote: Enumerating objects: 21, done.
remote: Counting objects: 100% (21/21), done.
remote: Compressing objects: 100% (10/10), done.
remote: Total 18 (delta 12), reused 14 (delta 8), pack-reused 0
Unpacking objects: 100% (18/18), done.
From https://github.com/wiedehopf/graphs1090
   e34be81..5e4bc4c  master     -> origin/master
HEAD is now at 5e4bc4c workaround for skybup
Job for collectd.service failed because the control process exited with error code.
See "systemctl status collectd.service" and "journalctl -xe" for details.
--------------
--------------
All done! Graphs available at http://192.168.1.42/graphs1090
It may take up to 10 minutes until the first data is displayed

The collectd.service isn't happy:

systemctl status collectd.service

● collectd.service - Statistics collection and monitoring daemon
   Loaded: loaded (/lib/systemd/system/collectd.service; enabled; vendor preset: enabled)
   Active: activating (auto-restart) (Result: exit-code) since Tue 2020-06-30 20:44:00 EDT; 9s ago
     Docs: man:collectd(1)
           man:collectd.conf(5)
           https://collectd.org
  Process: 21335 ExecStartPre=/usr/sbin/collectd -t (code=exited, status=203/EXEC)

OS: Raspbian GNU/Linux 10 Lite (buster) armv7l
Host: Raspberry Pi 3 Model B Rev 1.2
Kernel: 4.19.118-v7+

Graph: ADS-B Msg Rate / AC is off scale

I am running the latest 1090Graph as of 3/22/2021 and recently optimized my system for higher message rates. Below is an image from the aforementioned graph for the 8 hour period over night. As you can see the messages per aircraft (blue) is off scale. The data indicates the max was 28.9, but the drawn blue line is maxing out at 30.

Screen Shot 03-22-21 at 08 15 AM

Longer Time Period for Graphs

This is a great plugin. Ive had it installed for +2.5 years. Is there any way to extend the graphs beyond 3 years, maybe 5 years or all time?
Thanks

Unlisted network interface

When a network interface is not listed in , network graphs cannot be produced, or data can be incomplete. Submitted a pull request to scan for unlisted interfaces at install time and insert into this plugin.

CPU Memory Temperature Graph Enhancements

Would it be possible to get some details on the CPU Utilization, Temperature, and maybe the Memory Graphs like some of the other graphs showing high/low/average, it doesn't have to be graphed, just text reports at the bottom of the graph. Thanks

Collectd fails on OrangePi

OS: Linux orangepizero2 4.9.170-sun50iw9 #5 SMP PREEMPT Thu Dec 9 11:16:31 CST 2021 aarch64 aarch64 aarch64 GNU/Linux

Error:

Sep 01 14:44:43 orangepizero2 systemd[1]: Stopped Statistics collection and monitoring daemon.
Sep 01 14:44:43 orangepizero2 systemd[1]: Starting Statistics collection and monitoring daemon...
Sep 01 14:44:43 orangepizero2 collectd[3279264]: plugin_load: plugin "syslog" successfully loaded.
Sep 01 14:44:43 orangepizero2 collectd[3279264]: plugin_load: plugin "rrdtool" successfully loaded.
Sep 01 14:44:43 orangepizero2 collectd[3279264]: plugin_load: plugin "table" successfully loaded.
Sep 01 14:44:43 orangepizero2 collectd[3279264]: plugin_load: plugin "interface" successfully loaded.
Sep 01 14:44:43 orangepizero2 collectd[3279264]: plugin_load: plugin "cpu" successfully loaded.
Sep 01 14:44:43 orangepizero2 collectd[3279264]: plugin_load: plugin "aggregation" successfully loaded.
Sep 01 14:44:43 orangepizero2 collectd[3279264]: plugin_load: plugin "match_regex" successfully loaded.
Sep 01 14:44:43 orangepizero2 collectd[3279264]: plugin_load: plugin "df" successfully loaded.
Sep 01 14:44:43 orangepizero2 collectd[3279264]: plugin_load: plugin "disk" successfully loaded.
Sep 01 14:44:43 orangepizero2 collectd[3279264]: ERROR: dlopen("/usr/lib/collectd/python.so") failed: /usr/lib/collectd/python.so: undefined symbol: PyFloat_Type. The most common cause for this problem is missing dependencies. Use ldd(1) to check the dependencies of the plugin / shared object.
Sep 01 14:44:43 orangepizero2 collectd[3279264]: dlopen("/usr/lib/collectd/python.so") failed: /usr/lib/collectd/python.so: undefined symbol: PyFloat_Type. The most common cause for this problem is missing dependencies. Use ldd(1) to check the dependencies of the plugin / shared object.
Sep 01 14:44:43 orangepizero2 collectd[3279264]: plugin_load: Load plugin "python" failed with status 2.
Sep 01 14:44:43 orangepizero2 collectd[3279264]: Error: Parsing the config file failed!
Sep 01 14:44:43 orangepizero2 collectd[3279264]: Found a configuration for the `python' plugin, but the plugin isn't loaded or didn't register a configuration callback.
Sep 01 14:44:43 orangepizero2 collectd[3279264]: Plugin python failed to handle option ModulePath, return code: -1
Sep 01 14:44:43 orangepizero2 systemd[1]: collectd.service: Main process exited, code=exited, status=1/FAILURE
Sep 01 14:44:43 orangepizero2 systemd[1]: collectd.service: Failed with result 'exit-code'.
Sep 01 14:44:43 orangepizero2 systemd[1]: Failed to start Statistics collection and monitoring daemon.
Sep 01 14:44:51 orangepizero2 systemd[1]: Stopped Statistics collection and monitoring daemon.
Sep 01 14:44:51 orangepizero2 systemd[1]: Starting Statistics collection and monitoring daemon...
Sep 01 14:44:51 orangepizero2 collectd[3279281]: plugin_load: plugin "syslog" successfully loaded.
Sep 01 14:44:51 orangepizero2 collectd[3279281]: plugin_load: plugin "rrdtool" successfully loaded.
Sep 01 14:44:51 orangepizero2 collectd[3279281]: plugin_load: plugin "table" successfully loaded.
Sep 01 14:44:51 orangepizero2 collectd[3279281]: plugin_load: plugin "interface" successfully loaded.
Sep 01 14:44:51 orangepizero2 collectd[3279281]: plugin_load: plugin "cpu" successfully loaded.
Sep 01 14:44:51 orangepizero2 collectd[3279281]: plugin_load: plugin "aggregation" successfully loaded.
Sep 01 14:44:51 orangepizero2 collectd[3279281]: plugin_load: plugin "match_regex" successfully loaded.
Sep 01 14:44:51 orangepizero2 collectd[3279281]: plugin_load: plugin "df" successfully loaded.
Sep 01 14:44:51 orangepizero2 collectd[3279281]: plugin_load: plugin "disk" successfully loaded.
Sep 01 14:44:51 orangepizero2 collectd[3279281]: ERROR: dlopen("/usr/lib/collectd/python.so") failed: /usr/lib/collectd/python.so: undefined symbol: PyFloat_Type. The most common cause for this problem is missing dependencies. Use ldd(1) to check the dependencies of the plugin / shared object.
Sep 01 14:44:51 orangepizero2 collectd[3279281]: dlopen("/usr/lib/collectd/python.so") failed: /usr/lib/collectd/python.so: undefined symbol: PyFloat_Type. The most common cause for this problem is missing dependencies. Use ldd(1) to check the dependencies of the plugin / shared object.
Sep 01 14:44:51 orangepizero2 collectd[3279281]: plugin_load: Load plugin "python" failed with status 2.
Sep 01 14:44:51 orangepizero2 collectd[3279281]: Error: Parsing the config file failed!
Sep 01 14:44:51 orangepizero2 collectd[3279281]: Found a configuration for the `python' plugin, but the plugin isn't loaded or didn't register a configuration callback.
Sep 01 14:44:51 orangepizero2 collectd[3279281]: Plugin python failed to handle option ModulePath, return code: -1
Sep 01 14:44:51 orangepizero2 systemd[1]: collectd.service: Main process exited, code=exited, status=1/FAILURE
Sep 01 14:44:51 orangepizero2 systemd[1]: collectd.service: Failed with result 'exit-code'.
Sep 01 14:44:51 orangepizero2 systemd[1]: Failed to start Statistics collection and monitoring daemon.

graphs for 978 without dump1090

There are many 1090 sites around my area. Not many 978UAT sites. Is there a way to get 978 maps only, and not 1090 as there would be no data? RPI -Bullseye and at times the piaware sd image.

Suggestion: Avoiding 'no space left on device' when running rrd-dump.sh for migration

I was migrating a complete piaware installation from 32-bit Debian bullseye to 64-bit (completely fresh installation). I wanted to keep the 32-bit source running dump1090-fa for a while to compare performance (piaware shut down after migration from the source). Since it might be unlikely that someone would want to keep the source running after a migration, this situation might be rare. I thought I would share my experience with an unexpected failure (and resolution) if it would help anyone else.

When using the guide backup and restore on different architecture in the source host. ran into a problem where /run (on tmpfs) ran out of space after collectd attempted to restart after the command

/usr/share/graphs1090/rrd-dump.sh /var/lib/collectd/rrd/localhost/

Symptom:

May 13 10:19:35 pi-outside collectd[28906]: copying DB from disk to /run/collectd
May 13 10:19:35 pi-outside collectd[28910]: cp: error writing '/run/collectd/localhost/disk-sda/disk_octets.xml': No space left on device
May 13 10:19:35 pi-outside collectd[28910]: cp: error writing '/run/collectd/localhost/disk-sda/disk_merged.xml': No space left on device
May 13 10:19:35 pi-outside systemd[1]: collectd.service: Control process exited, code=exited, status=1/FAILURE
May 13 10:19:35 pi-outside collectd[28918]: readback didn't complete, no writeback of /run/collectd to disk!
May 13 10:19:35 pi-outside systemd[1]: collectd.service: Control process exited, code=exited, status=1/FAILURE
May 13 10:19:35 pi-outside systemd[1]: collectd.service: Failed with result 'exit-code'.
May 13 10:19:35 pi-outside systemd[1]: Failed to start Statistics collection and monitoring daemon.

It seems that the readback.sh and writeback.sh take all files in /var/lib/collectd/rrd/localhost/ which now include all the rrd dumps (*.xml) and attempts to write them all to /run/collectd/... when attempting collectd service startup. I have several years' worth of data for graphs1090, and that blew away the /run tmpfs causing collectd to not run anymore.

I copied off and removed the xml files from the regular filesystem, removed them from the archives, and was able to restart collectd in the source OK.

One suggestion for migrations: change the process in the /usr/share/graphs1090/rrd-dump.sh to not starting collectd.service until the rrd dump files and folders are moved out. This will avoid potentially overruning the available tmpfs storage for /run

# Add this before starting collectd.service
cd /var/lib/collectd/rrd
sudo /usr/share/graphs1090/gunzip.sh /var/lib/collectd/rrd/localhost
sudo tar -cz -f rrd.tar.gz localhost
find /var/lib/collectd/rrd/localhost -mindepth 2 -type f ! -name \*.rrd -delete
mv rrd.tar.gz /tmp

Another alternative would be to temporarily increase the size of /run with an entry in /etc/fstab and run your migration script, followed by deleting the .xml files in the /run/collectd/ tree.

# temporary add to /etc/fstab:
tmpfs /run tmpfs nosuid,noexec,size=256M 0  0

SNR

Hello!

Is it possible to add SNR to the signal level graph? Formula should be signal minus noise.

I use this to quickly get the value:

cat /run/readsb/stats.json | jq '.total.local.signal - .total.local.noise'

Adding option in installation.sh to specify custom port for lighttpd

First, great set of graphs!
I migrated my setup from an RPi3+ to a NUC when I got my airspy mini. The RPi3+ didn't keep up and the NUC is way more powerful.
The NUC is used for various tasks (running debian stretch). I had to install dump1090-fa (and lighttpd) on a different port (I choose 8111) and that didn't work so well with your install.sh-script. I had to make some changes in the script to suit my needs.

I suggest that you add an option to specify a port used by lighttpd to install.sh to make the process smoother.

Undefined Graph Scale

There are 3 graphs that have an unlabeled scale on the right that is different from the labeled scale on the left. I could not find a description in the read me file. What do those unlabeled scales represent? The graphs are ADS-B Message Rate, ADS-B Message Rate / Aircraft, and ADS-B Maxima.

.rrd file only containd 1 Year

I have a strange behavior here, but this is not a bug from grah1090.
So my problem is that my .rrd file only contains 1 year of data.
If I restore from a backup from March 2020, as it is in the instructions, all data older than 1 year will simply be deleted.
I looked it up by comparing the .rrd files from / var / lib / collectd / rrd / localhost / dump1090-localhost folder that export.xml with the xml export files from the backup.
Can someone help me so that I can save all the data?

Error while using Installation Script / Read-only file system

Using: Pi24 with Dump1090 Dev 1.15

Hi Widehopf thanks for this addon,
i'am unable to run the installation script out of the box.

Output:

pi@raspberrypi:~ $ sudo bash -c "$(wget -q -O - https://raw.githubusercontent.com/wiedehopf/graphs1090/master/install.sh)"
mkdir: cannot create directory ‘/usr/share/graphs1090’: Read-only file system
mkdir: cannot create directory ‘/var/lib/graphs1090’: Read-only file system
touch: cannot touch '/usr/share/graphs1090/installed/rrdtool': No such file or directory
touch: cannot touch '/usr/share/graphs1090/installed/collectd-core': No such file or directory
[.....]

Thanks for any hints,
Cheers

Some graphs do not generate if collectd interval is changed

I recently added a Python plugin to collectd (Import "weather" in <Plugin python>) to collect some weather data and needed to increase the granularity so I set the global interval in collectd.conf to 5 (default was 60). This works fine for my weather data and the system graphs but almost all of the dump1090 graphs are now no longer showing.
image

I'm very new to collectd/rrdtool, but ls -la shows the dump1090-localhost rrd files are still being updated, although with no/invalid data?
pi@raspberrypi:/var/lib/collectd/rrd/localhost/dump1090-localhost $ rrdtool info dump1090_messages-positions.rrd filename = "dump1090_messages-positions.rrd" rrd_version = "0003" step = 5 last_update = 1595823950 header_size = 3300 ds[value].index = 0 ds[value].type = "DERIVE" ds[value].minimal_heartbeat = 10 ds[value].min = 0.0000000000e+00 ds[value].max = 8.0000000000e+03 ds[value].last_ds = "44761" ds[value].value = NaN ds[value].unknown_sec = 0

Not sure what's happening, maybe something to do with the RRARows/RRATimespan but I don't fully understand yet. Would appreciate some help, thanks.

Possible typo: libpython2.7 referenced twice

in:

|| ! dpkg -s libpython2.7 2>/dev/null | grep 'Status.*installed' &>/dev/null

	if ! dpkg -s libpython2.7 2>/dev/null | grep 'Status.*installed' &>/dev/null \
		|| ! dpkg -s libpython2.7 2>/dev/null | grep 'Status.*installed' &>/dev/null
	then
		apt-get update
		apt-get install -y 'libpython2.7'
		apt-get install -y 'libpython3.7'

libpython2.7 is referenced twice, but the following lines install 2.7 AND 3.7. Maybe the second should be 3.7?

Martin

Can't upgrade graphs1090 to newest version

The install/upgrade scripts fails when the kernel can't be updated on the target system.

`adminuser@systemname:/var/log# bash -c "$(curl -L -o - https://github.com/wiedehopf/graphs1090/raw/master/install.sh)"
% Total % Received % Xferd Average Speed Time Time Time Current
Dload Upload Total Spent Left Speed
100 138 100 138 0 0 352 0 --:--:-- --:--:-- --:--:-- 351
100 8269 100 8269 0 0 8824 0 --:--:-- --:--:-- --:--:-- 8824

Installing required packages: git rrdtool collectd-core

Hit:1 http://security.debian.org/debian-security buster/updates InRelease
Hit:2 http://deb.debian.org/debian buster InRelease
Hit:3 http://deb.debian.org/debian buster-updates InRelease
Reading package lists... Done
Building dependency tree
Reading state information... Done
1 package can be upgraded. Run 'apt list --upgradable' to see it.
Reading package lists... Done
Building dependency tree
Reading state information... Done
collectd-core is already the newest version (5.8.1-1.3).
git is already the newest version (1:2.20.1-2+deb10u3).
rrdtool is already the newest version (1.7.1-2).
0 upgraded, 0 newly installed, 0 to remove and 1 not upgraded.

Failed to install required packages: git rrdtool collectd-core
`
As you can see the required packages are all of the latest version for my platform (Buster x86_64) and the install-scripts fails due to the kernel can't be upgraded by the script:

adminuser@systemname:/var/log# apt list --upgradable -a Listing... Done linux-image-amd64/oldstable 4.19+105+deb10u12 amd64 [upgradable from: 4.19+105+deb10u11] linux-image-amd64/now 4.19+105+deb10u11 amd64 [installed,upgradable to: 4.19+105+deb10u12] linux-image-amd64/oldstable 4.19+105+deb10u9 amd64

I guess that the latest kernel isn't required for graphs1090 to work properly. If it requires newer versions of git, rrdtool and collectd-core than what Debian buster can provide it would be beneficial with a more detailed error message or test explaining that you need to be running Debian bullseye.

Edit comments: Tried to make it look nice and readable, but it failed miserably...

Collectd error installing graphs

Instaled readsb for feeding ADSB Exchange. Also successfully installed were tar1090 and ADSB Exchange but I got collectd errors doing the install script about two weeks after installing readsb.

Toshiba Satellite L15 notebook running Linux Mint 20.3.

lsb_release -a
No LSB modules are available.
Distributor ID: Linuxmint
Description: Linux Mint 20.3
Release: 20.3
Codename: una

From System Reports --
System: Kernel: 5.15.0-33-generic x86_64 bits: 64 compiler: N/A Desktop: MATE 1.26.0 wm: marco
dm: LightDM Distro: Linux Mint 20.3 Una base: Ubuntu 20.04 focal
Machine: Type: Laptop System: TOSHIBA product: Satellite L15-B v: PSKVGU-00G00E serial:
Chassis: type: 10 serial:
Mobo: TOSHIBA model: MA20 serial: UEFI [Legacy]: TOSHIBA v: 1.20

Can't figure out how to attach the text file with the requested 40 lines so will paste.

cat eckert-adsb-graphs-error.txt
Jul 03 17:05:49 satellite collectd[313149]: copying DB from disk to /run/collectd
Jul 03 17:05:49 satellite collectd[313165]: plugin_load: plugin "syslog" successfully loaded.
Jul 03 17:05:49 satellite collectd[313165]: plugin_load: plugin "rrdtool" successfully loaded.
Jul 03 17:05:49 satellite collectd[313165]: plugin_load: plugin "table" successfully loaded.
Jul 03 17:05:49 satellite collectd[313165]: plugin_load: plugin "interface" successfully loaded.
Jul 03 17:05:49 satellite collectd[313165]: plugin_load: plugin "cpu" successfully loaded.
Jul 03 17:05:49 satellite collectd[313165]: plugin_load: plugin "aggregation" successfully loaded.
Jul 03 17:05:49 satellite collectd[313165]: plugin_load: plugin "match_regex" successfully loaded.
Jul 03 17:05:49 satellite collectd[313165]: plugin_load: plugin "df" successfully loaded.
Jul 03 17:05:49 satellite collectd[313165]: plugin_load: plugin "disk" successfully loaded.
Jul 03 17:05:49 satellite collectd[313165]: ERROR: dlopen("/usr/lib/collectd/python.so") failed: /usr/lib/collectd/python.so: undefined symbol: PyFloat_Type. The most common cause for this problem is missing dependencies. Use ldd(1) to check the dependencies of the plugin / shared object.
Jul 03 17:05:49 satellite collectd[313165]: dlopen("/usr/lib/collectd/python.so") failed: /usr/lib/collectd/python.so: undefined symbol: PyFloat_Type. The most common cause for this problem is missing dependencies. Use ldd(1) to check the dependencies of the plugin / shared object.
Jul 03 17:05:49 satellite collectd[313165]: plugin_load: Load plugin "python" failed with status 2.
Jul 03 17:05:49 satellite collectd[313165]: Found a configuration for the python' plugin, but the plugin isn't loaded or didn't register a configuration callback. Jul 03 17:05:49 satellite collectd[313165]: Plugin python failed to handle option ModulePath, return code: -1 Jul 03 17:05:49 satellite collectd[313165]: Error: Parsing the config file failed! Jul 03 17:05:49 satellite systemd[1]: collectd.service: Main process exited, code=exited, status=1/FAILURE Jul 03 17:05:49 satellite collectd[313166]: writing DB from /run/collectd to disk Jul 03 17:05:50 satellite collectd[313166]: writeback size on disk: 4.0K /var/lib/collectd/rrd/localhost.tar.gz Jul 03 17:05:50 satellite systemd[1]: collectd.service: Failed with result 'exit-code'. Jul 03 17:05:50 satellite systemd[1]: Failed to start Statistics collection and monitoring daemon. Jul 03 17:06:00 satellite systemd[1]: collectd.service: Scheduled restart job, restart counter is at 3076. Jul 03 17:06:00 satellite systemd[1]: Stopped Statistics collection and monitoring daemon. Jul 03 17:06:00 satellite systemd[1]: Starting Statistics collection and monitoring daemon... Jul 03 17:06:00 satellite collectd[313235]: copying DB from disk to /run/collectd Jul 03 17:06:00 satellite collectd[313251]: plugin_load: plugin "syslog" successfully loaded. Jul 03 17:06:00 satellite collectd[313251]: plugin_load: plugin "rrdtool" successfully loaded. Jul 03 17:06:00 satellite collectd[313251]: plugin_load: plugin "table" successfully loaded. Jul 03 17:06:00 satellite collectd[313251]: plugin_load: plugin "interface" successfully loaded. Jul 03 17:06:00 satellite collectd[313251]: plugin_load: plugin "cpu" successfully loaded. Jul 03 17:06:00 satellite collectd[313251]: plugin_load: plugin "aggregation" successfully loaded. Jul 03 17:06:00 satellite collectd[313251]: plugin_load: plugin "match_regex" successfully loaded. Jul 03 17:06:00 satellite collectd[313251]: plugin_load: plugin "df" successfully loaded. Jul 03 17:06:00 satellite collectd[313251]: plugin_load: plugin "disk" successfully loaded. Jul 03 17:06:00 satellite collectd[313251]: ERROR: dlopen("/usr/lib/collectd/python.so") failed: /usr/lib/collectd/python.so: undefined symbol: PyFloat_Type. The most common cause for this problem is missing dependencies. Use ldd(1) to check the dependencies of the plugin / shared object. Jul 03 17:06:00 satellite collectd[313251]: dlopen("/usr/lib/collectd/python.so") failed: /usr/lib/collectd/python.so: undefined symbol: PyFloat_Type. The most common cause for this problem is missing dependencies. Use ldd(1) to check the dependencies of the plugin / shared object. Jul 03 17:06:00 satellite collectd[313251]: plugin_load: Load plugin "python" failed with status 2. Jul 03 17:06:00 satellite collectd[313251]: Found a configuration for the python' plugin, but the plugin isn't loaded or didn't register a configuration callback.
Jul 03 17:06:00 satellite collectd[313251]: Plugin python failed to handle option ModulePath, return code: -1
Jul 03 17:06:00 satellite collectd[313251]: Error: Parsing the config file failed!
den@satellite ~/ADSB $

Dennis Eckert denhamlist at gmail.com
JUL 5 2022 1150AM Pacific

PS -- As a beginner, filing an error report this way appeared the proper way to submit.

Recommend Projects

  • React photo React

    A declarative, efficient, and flexible JavaScript library for building user interfaces.

  • Vue.js photo Vue.js

    🖖 Vue.js is a progressive, incrementally-adoptable JavaScript framework for building UI on the web.

  • Typescript photo Typescript

    TypeScript is a superset of JavaScript that compiles to clean JavaScript output.

  • TensorFlow photo TensorFlow

    An Open Source Machine Learning Framework for Everyone

  • Django photo Django

    The Web framework for perfectionists with deadlines.

  • D3 photo D3

    Bring data to life with SVG, Canvas and HTML. 📊📈🎉

Recommend Topics

  • javascript

    JavaScript (JS) is a lightweight interpreted programming language with first-class functions.

  • web

    Some thing interesting about web. New door for the world.

  • server

    A server is a program made to process requests and deliver data to clients.

  • Machine learning

    Machine learning is a way of modeling and interpreting data that allows a piece of software to respond intelligently.

  • Game

    Some thing interesting about game, make everyone happy.

Recommend Org

  • Facebook photo Facebook

    We are working to build community through open source technology. NB: members must have two-factor auth.

  • Microsoft photo Microsoft

    Open source projects and samples from Microsoft.

  • Google photo Google

    Google ❤️ Open Source for everyone.

  • D3 photo D3

    Data-Driven Documents codes.