Git Product home page Git Product logo

watermarkhu / qsurface Goto Github PK

View Code? Open in Web Editor NEW
53.0 3.0 25.0 4.19 MB

Python package for simulation and visualization of quantum error-correction on surface codes. The package provides the ability to inspect the error-correcting code during the decoding process, and tools to benchmark the decoder.

Home Page: https://qsurface.readthedocs.io/en/latest

License: BSD 3-Clause "New" or "Revised" License

Python 98.04% C++ 0.28% Makefile 0.15% Jupyter Notebook 1.53%
quantum-error-correction surface-code

qsurface's Introduction

Qsurface

PyPI version Build Documentation Status codecov Binder License DOI Unitary Fund

Qsurface is a simulation package for the surface code, and is designed to modularize 3 aspects of a surface code simulation.

  1. The surface code
  2. The error model
  3. The used decoder

New types of surface codes, error modules and decoders can be added to Qsurface by using the included templates for each of the three core module categories.

The current included decoders are:

  • The Mininum-Weight Perfect Matching (mwpm) decoder.
  • Delfosse's and Nickerson's Union-Find (unionfind) decoder, which has almost-linear worst-case time complexity.
  • Our modification to the Union-Find decoder; the Union-Find Node-Suspension (ufns) decoder, which improves the threshold of the Union-Find decoder to near MWPM performance, while retaining quasi-linear worst-case time complexity.

The compatibility of these decoders with the included surface codes are listed below.

Decoders toric code planar code
mwpm
unionfind
ufns

Installation

All required packages can be installed through:

pip install qsurface

Requirements

  • Python 3.7+
  • Tkinter or PyQt5 for interactive plotting.
  • Matplotlib 3.4+ for plotting on a 3D lattice (Refers to a future release of matplotlib, see pull request)

MWPM decoder

The MWPM decoder utilizes networkx for finding the minimal weights in a fully connected graph. This implementation is however rather slow compared to Kolmogorov's Blossom V algorithm. Blossom V has its own license and is thus not included with Qsurface. We do provided a single function to download and compile Blossom V, and to setup the integration with Qsurface automatically.

>>> from qsurface.decoders import mwpm
>>> mwpm.get_blossomv()

Usage

To simulate the toric code and simulate with bitflip error for 10 iterations and decode with the MWPM decoder:

>>> from qsurface.main import initialize, run
>>> code, decoder = initialize((6,6), "toric", "mwpm", enabled_errors=["pauli"])
>>> run(code, decoder, iterations=10, error_rates = {"p_bitflip": 0.1})
{'no_error': 8}

Benchmarking of decoders can be enabled by attaching a benchmarker object to the decoder. See the docs for the syntax and information to setup benchmarking.

>>> from qsurface.main import initialize, run
>>> benchmarker = BenchmarkDecoder({"decode":"duration"})
>>> run(code, decoder, iterations=10, error_rates = {"p_bitflip": 0.1}, benchmark=benchmarker)
{'no_error': 8,
'benchmark': {'success_rate': [10, 10],
'seed': 12447.413636559,
'durations': {'decode': {'mean': 0.00244155000000319,
'std': 0.002170364089572033}}}}

Plotting

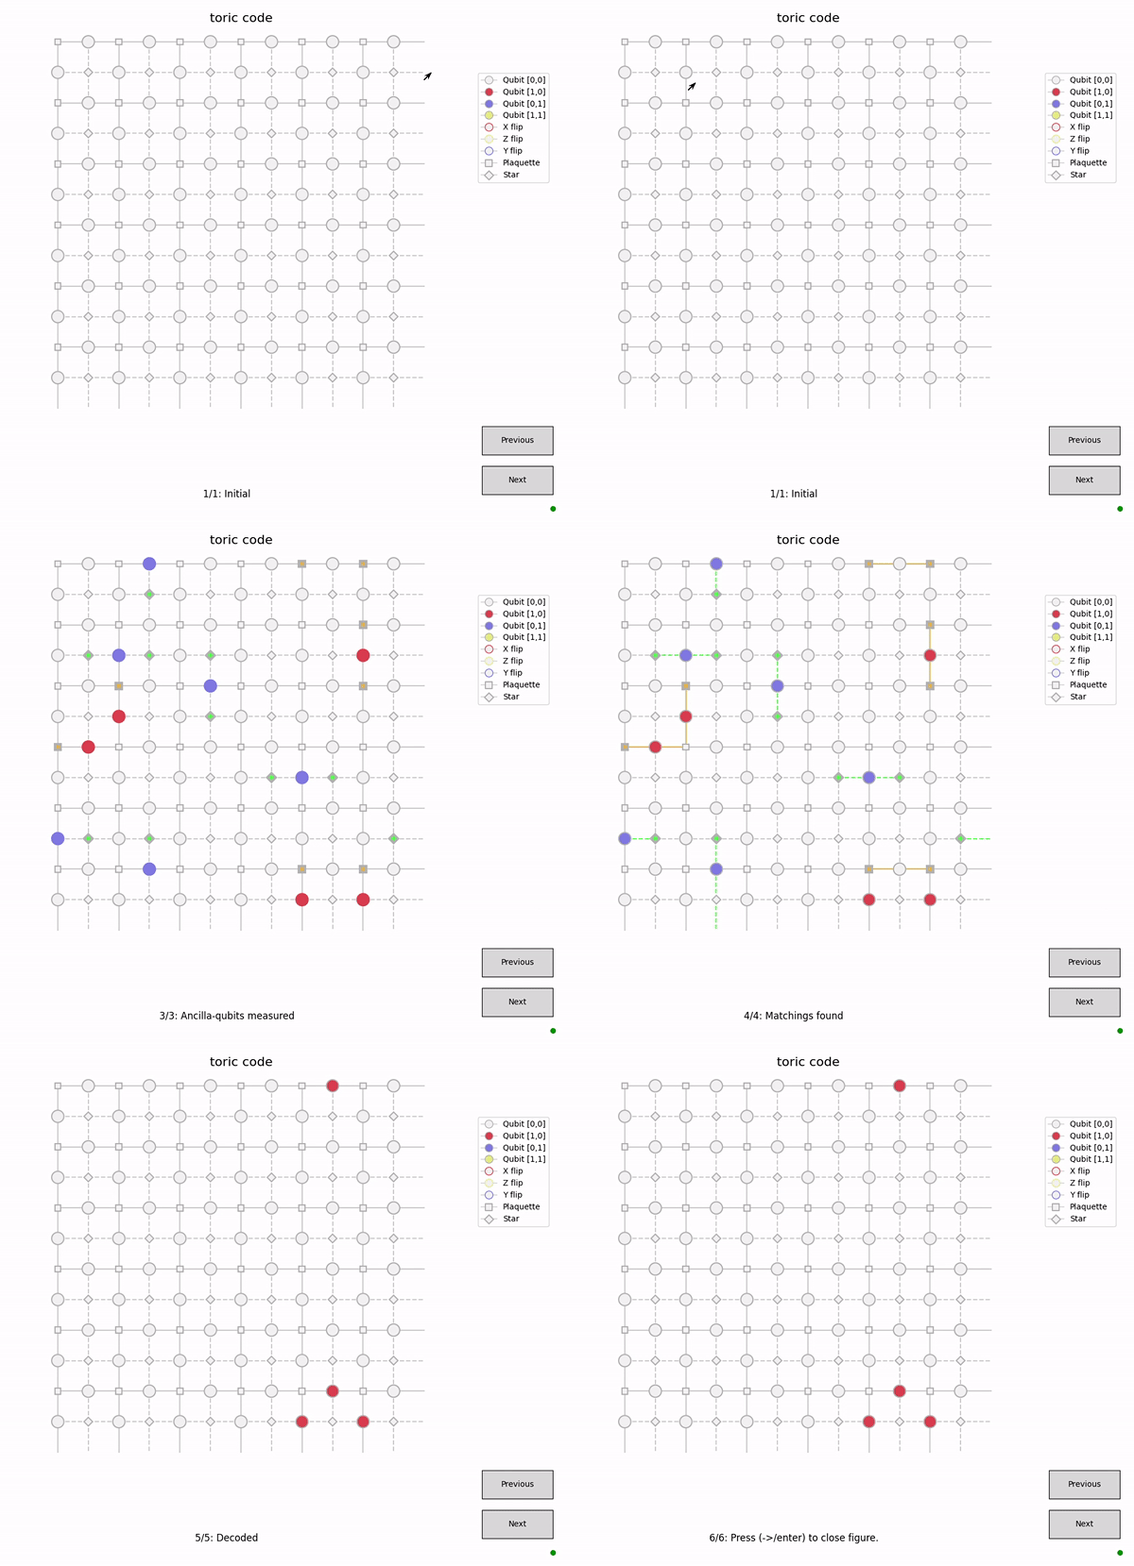
The figures in Qsurface allows for step-by-step visualization of the surface code simulation (and if supported the decoding process). Each figure logs its history such that the user can move backwards in time to view past states of the surface (and decoder). Press h when the figure is open for more information.

>>> from qsurface.main import initialize, run
>>> code, decoder = initialize((6,6), "toric", "mwpm", enabled_errors=["pauli"], plotting=True, initial_states=(0,0))
>>> run(code, decoder, error_rates = {"p_bitflip": 0.1, "p_phaseflip": 0.1}, decode_initial=False)

Interactive plotting on a 6x6 toric code.

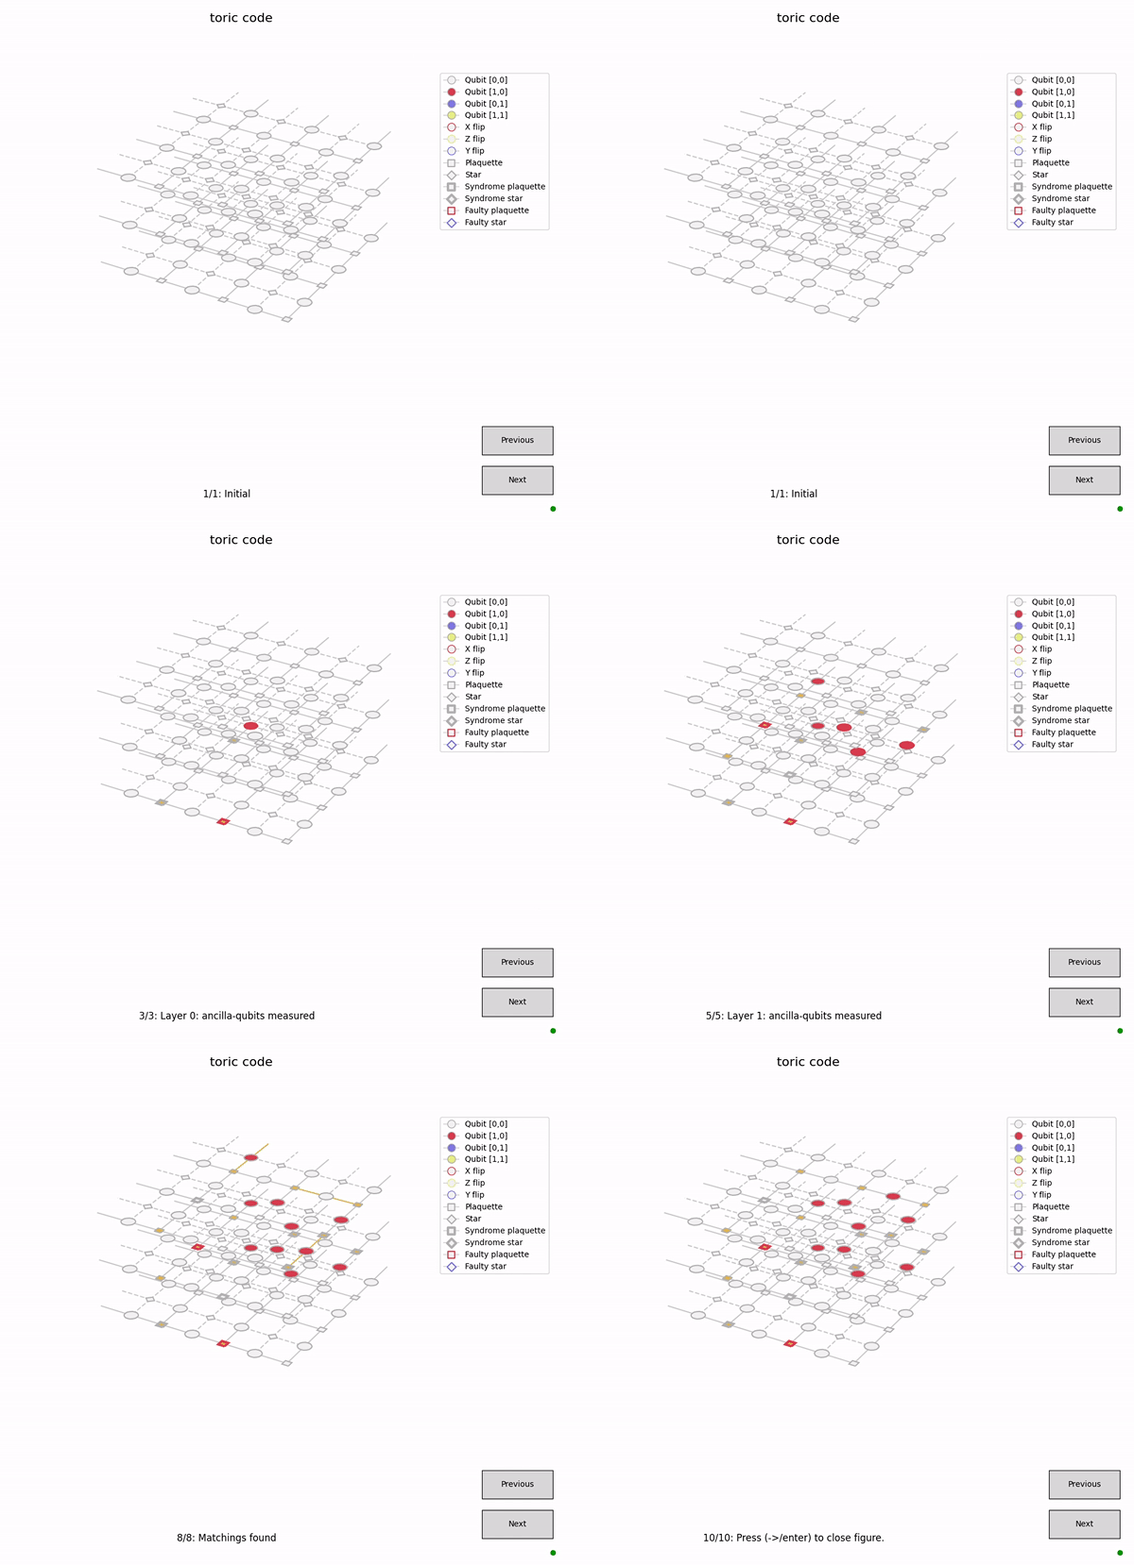
Plotting will be performed on a 3D axis if faulty measurements are enabled.

>>> code, decoder = initialize((3,3), "toric", "mwpm", enabled_errors=["pauli"], faulty_measurements=True, plotting=True, initial_states=(0,0))
>>> run(code, decoder, error_rates = {"p_bitflip": 0.05, "p_bitflip_plaq": 0.05}, decode_initial=False)

Interactive plotting on a toric code with faulty measurements.

In IPython, inline images are created for each iteration of the plot, which can be tested in the example notebook.

Command line interface

Simulations can also be initiated from the command line

$ python -m qsurface -e pauli -D mwpm -C toric simulation --p_bitflip 0.1 -n 10
{'no_error': 8}

For more information on command line interface:

$ python -m qsurface -h
usage: qsurface
...

This project is proudly funded by the Unitary Fund.

qsurface's People

Contributors

watermarkhu avatar

Stargazers

 avatar  avatar  avatar  avatar  avatar  avatar  avatar  avatar  avatar  avatar  avatar  avatar  avatar  avatar  avatar  avatar  avatar  avatar  avatar  avatar  avatar  avatar  avatar  avatar  avatar  avatar  avatar  avatar  avatar  avatar  avatar  avatar  avatar  avatar  avatar  avatar  avatar  avatar  avatar  avatar  avatar  avatar  avatar  avatar  avatar  avatar  avatar  avatar  avatar  avatar  avatar  avatar  avatar

Watchers

 avatar  avatar  avatar

qsurface's Issues

Add configuration file to repeat simulations

The run_oopsc.py file has been refactored. It should be updated in the Readme file.
If possible, I'd suggest having also one basic example that produces a plot without any additional command line appended command. I.e., typing

python simple_example.py

generates a plot / intended outcome. I wonder whether a configuration / settings file could help to store command line configurations that one is re-using (e.g., 8 -l planar -px 0.03 -pmx 0.03 -i 1000).

Confusing simulation setup

For a simulation one need a graph object and a decoder object, which are mutually dependent.
Currently, their relation are defined by the configuration.py module, but is not as straight forward as it could be.
From the CLI, this is no problem. However, if one would like to run a simulation step by step from for example a jupyter notebook, this is quite complicated.

Cannot plot non-interactively

Steps to reproduce

from opensurfacesim.main import initialize, run
code, decoder = initialize((6,6), "toric", "mwpm", enabled_errors=["pauli"])
run(code, decoder, iterations=10, error_rates = {"p_bitflip": 0.1})

Issue

Matplotlib is using Qt5Agg backend. Interactive plotting is disabled.
Drawing 1/1: Initial
Traceback (most recent call last):
  File "*\stuff.py", line 2, in <module>
    code, decoder = initialize((6, 6), "toric", "mwpm", enabled_errors=["pauli"], plotting=True, initial_states=(0, 0))
  File *\opensurfacesim\main.py", line 91, in initialize
    code.initialize(*enabled_errors, **kwargs)
  File "*\opensurfacesim\codes\_template\plot.py", line 35, in initialize
    self.figure.draw_figure("Initial")
  File "*\opensurfacesim\plot.py", line 649, in draw_figure
    self.display(self.figure)
AttributeError: 'Figure' object has no attribute 'display'

Suggested fix

load_interactive_backend(self) should create a self.display for non-inline/non-interactive mpl backends (such as Qt5Agg).

debug decorator class

Debugging is now performed by added attributes to the decoder classes or the graph classes.
Instead, debug information should be stored in its own class, where all methods related to debugging are self-contained.
Furthermore, debugging is now not available in single simulation

License

Properly reference Blossom5 and Python integration.
Address license issues

KeyError: 'max_cardinality'

I am trying to run the following from the example:
from qsurface.main import initialize, run, BenchmarkDecoder
code, decoder = initialize((6,6), "toric", "mwpm", enabled_errors=["pauli"])
run(code, decoder, iterations=10, error_rates = {"p_bitflip": 0.1})

I am getting the following error:
KeyError Traceback (most recent call last)
in
......
in match_syndromes(self, syndromes, use_blossomv, **kwargs)
60 matching = matching_graph(
61 edges,
---> 62 maxcardinality=self.config["max_cardinality"],
63 num_nodes=len(syndromes),
64 **kwargs,

KeyError: 'max_cardinality'

I have made sure I am on the same version of python as the one in the hub online example, which runs without issues.

=====UPDATE=====

I discovered that the cause of this error is the missing *.ini files when installing with pip.

Floating point used as pandas index for error probability

Steps to reproduce

  1. python run_threshold.py uf toric 1000 -l 8 10 12 -p 0.09 0.10 0.11 (directly from README)
  2. python run_threshold.py uf toric 1000 -l 8 9 10 12 -p 0.09 0.10 0.11

Issues

  1. toric_graph_2D_uf_.csv contains seemingly duplicate rows where the p index is the same, i.e.

L,p,N,succes
8,0.09,1000.0,816.0
8,0.09,2000.0,1588.0
8,0.1,1000.0,732.0
8,0.1,2000.0,1470.0
8,0.11,1000.0,627.0
8,0.11,2000.0,1272.0
10,0.09,0.0,0.0
10,0.09,1000.0,795.0
10,0.1,0.0,0.0
10,0.1,1000.0,710.0
10,0.11,0.0,0.0
10,0.11,1000.0,659.0
12,0.09,0.0,0.0
12,0.09,1000.0,819.0
12,0.1,0.0,0.0
12,0.1,1000.0,721.0
12,0.11,0.0,0.0
12,0.11,1000.0,638.0

  1. Exception: cannot handle a non-unique multi-index!

This is because sim.py appends decoder data to a pandas MultiIndex through a floating point, introducing slight variations depending on how this value is read.

Proposed solution
Write the p column as data, not as an index. Replace with labels that can be uniquely defined, e.g. integers.

Add my binder integration

Adding a My Binder badge in the Readme file will allow prospective users to try out the software without installing anything locally. I tried it and it works, thanks to the new package structure, with the requirements.txt file in the topmost folder.

Pasting this in README.md should suffice:
Binder
(this is how it looks like: [![Binder](https://mybinder.org/badge_logo.svg)](https://mybinder.org/v2/gh/watermarkhu/OpenSurfaceSim/master))

To be most effective, the My Binder link could point directly to a tutorial, e.g. in the form of a Jupyter notebook, or to a script (using Jupyter Labs as My Binder default). Happy to help in this with PR or feedback along the way.

Inquiry on plots for unionfind decoder

Hi, first or all, thank you for making this amazing repo.
I really like the plotting feature that allows me to understand what is happening.
I have three issues/questions, and I would really appreciate if you could solve these, especially the first one.

1. Plotting unionfind decoder

I'm running the following in jupyter notebook.

%matplotlib qt
from qsurface.main import initialize, run
code, decoder = initialize((5,5), "toric", "unionfind", enabled_errors=["pauli"], plotting=True, initial_states=(0,0))
run(code, decoder, error_rates = {"p_bitflip": 0.05, "p_phaseflip": 0.05}, decode_initial=False)

For the first three plots (initialization, error applied, ancilla qubits measured, everything is fine.
But when I hit next, another window pops up, and the grid doesn't show anymore.
It looks like this:
Capture

Could you please solve this, so that the grid shows up, just like when I use the mwpm decoder?

  1. Warning when I press "previous" in interactive plot

I have the following message:
Traceback (most recent call last):
File "C:\Users\lg\anaconda3\lib\site-packages\matplotlib\cbook_init_.py", line 270, in process
func(*args, **kwargs)
File "C:\Users\lg\anaconda3\lib\site-packages\matplotlib\widgets.py", line 225, in
return self._observers.connect('clicked', lambda event: func(event))
File "C:\Users\lg\anaconda3\lib\site-packages\qsurface\plot.py", line 695, in _draw_prev
return self._draw_from_history(self.history_iter > 1, -1, **kwargs)
File "C:\Users\lg\anaconda3\lib\site-packages\qsurface\plot.py", line 682, in _draw_from_history
self.draw_figure(**kwargs)
File "C:\Users\lg\anaconda3\lib\site-packages\qsurface\plot.py", line 648, in draw_figure
self.focus()
File "C:\Users\lg\anaconda3\lib\site-packages\qsurface\plot.py", line 471, in focus
output = self.blocking_input(self.params.blocking_wait)
File "C:\Users\lg\anaconda3\lib\site-packages\qsurface\plot.py", line 159, in call
return super().call(n=1, timeout=timeout)
File "C:\Users\lg\anaconda3\lib\site-packages\matplotlib\blocking_input.py", line 93, in call
self.fig.canvas.start_event_loop(timeout=timeout)
File "C:\Users\lg\anaconda3\lib\site-packages\matplotlib\backends\backend_qt5.py", line 424, in start_event_loop
raise RuntimeError("Event loop already running")
RuntimeError: Event loop already running

  1. Question: What is info / bitflip / phaseflip in this image?
    image

Again, I really appreciate this repo, and I hope you reply!

Split graph objects and base elements; use inherited graph objects

Graph objects should be separated from the graph base elements (GBE) such as Vertex and Edge.
We should define a base graph class and base GBE classes that are stripped from decoder specific attributes.
Every decoder should add decoder specific methods and attributes through inheritance, defined in their modules_decoder folder.

This allows graph object attributes and methods to be added at the decoder level in stead of the main level.

Format docstrings

The two most common docstring formats are Numpy-style and Google-style (more compact). They both contain standard keywords for arguments, returned objects and the possibility to annotate the signature with type hints or within the docstring itself.

This is particularly helpful to automatically build the API-doc as part of the documentation with Sphinx's autodoc's feature.

Numpydoc helps ensuring this happens, https://numpydoc.readthedocs.io/en/latest/format.html#.

Happy to help on this with contributions or feedback.

Update tests

With the updated codebase, existing tests are not valid anymore.

Multiprocessing `RecursionError: maximum recursion depth exceeded while calling a Python object` [WINDOWS ISSUE]

Running multiprocessed codes on larger lattices (for both union-find and MWPM) results in a recursion depth error for the pickled input arguments, i.e. code and decoder objects. For faulty measurements, this error happens for lattices as small as 4x4.
This happens on Windows. While it works perfectly in the Unix environment.
Steps to reproduce

from qsurface.main import initialize, run_multiprocess

code, decoder = initialize((4, 4), "toric", "unionfind", enabled_errors=["pauli"], faulty_measurements=True)
if __name__ == "__main__":
    run_multiprocess(code, decoder, iterations=100, error_rates={"p_bitflip": 0.01})

Error

Traceback (most recent call last):
  File "c:\Users\*\Desktop\test.py", line 5, in <module>
    run_multiprocess(code, decoder, iterations=100, error_rates={"p_bitflip": 0.01})
  File "C:\Users\*\AppData\Local\Programs\Python\Python310\lib\site-packages\qsurface\main.py", line 276, in run_multiprocess
    worker.start()
  File "C:\Users\*\AppData\Local\Programs\Python\Python310\lib\multiprocessing\process.py", line 121, in start
    self._popen = self._Popen(self)
  File "C:\Users\*\AppData\Local\Programs\Python\Python310\lib\multiprocessing\context.py", line 224, in _Popen
    return _default_context.get_context().Process._Popen(process_obj)
  File "C:\Users\*\AppData\Local\Programs\Python\Python310\lib\multiprocessing\context.py", line 327, in _Popen
    return Popen(process_obj)
  File "C:\Users\*\AppData\Local\Programs\Python\Python310\lib\multiprocessing\popen_spawn_win32.py", line 93, in __init__
    reduction.dump(process_obj, to_child)
  File "C:\Users\*\AppData\Local\Programs\Python\Python310\lib\multiprocessing\reduction.py", line 60, in dump
    ForkingPickler(file, protocol).dump(obj)
RecursionError: maximum recursion depth exceeded while calling a Python object
PS C:\Users\*> Traceback (most recent call last):
  File "<string>", line 1, in <module>
  File "C:\Users\*\AppData\Local\Programs\Python\Python310\lib\multiprocessing\spawn.py", line 116, in spawn_main
    exitcode = _main(fd, parent_sentinel)
  File "C:\Users\*\AppData\Local\Programs\Python\Python310\lib\multiprocessing\spawn.py", line 126, in _main
    self = reduction.pickle.load(from_parent)
EOFError: Ran out of input

An Example Code for the simplest Case

Hello,
I am a new starter and trying to produce the simplest case for the surface code by using qsurface.

I will be appreciate, if you can check the code:
I will put no error to the simulation
1)I want to create the surface code for distance 3
2)I want to initialize all the data qubits in 0 state
3)I want to put X and Z stabilizers
4)Then I want to measure all the X stabilizers. In this case they will randomly change and commute with Z stabilizers and Z stabilizers will not change
With this scenario, I want to see how mwpm is working

As code:
code, decoder = initialize((3,3), "planar", "mwpm", enabled_errors=[], plotting=True, initial_states=(0,0))
run(code, decoder, error_rates = {}, decode_initial=True) #"p_bitflip": 0.1, "p_phaseflip": 0.1

But I could see nothing. Could you help me for my first code?

How to generate .gif as in example

Hi,
could you provide some basic hints on how to produce an animations from a jupyter notebook like the ones you show in the example?
Thanks a lot

Recommend Projects

  • React photo React

    A declarative, efficient, and flexible JavaScript library for building user interfaces.

  • Vue.js photo Vue.js

    🖖 Vue.js is a progressive, incrementally-adoptable JavaScript framework for building UI on the web.

  • Typescript photo Typescript

    TypeScript is a superset of JavaScript that compiles to clean JavaScript output.

  • TensorFlow photo TensorFlow

    An Open Source Machine Learning Framework for Everyone

  • Django photo Django

    The Web framework for perfectionists with deadlines.

  • D3 photo D3

    Bring data to life with SVG, Canvas and HTML. 📊📈🎉

Recommend Topics

  • javascript

    JavaScript (JS) is a lightweight interpreted programming language with first-class functions.

  • web

    Some thing interesting about web. New door for the world.

  • server

    A server is a program made to process requests and deliver data to clients.

  • Machine learning

    Machine learning is a way of modeling and interpreting data that allows a piece of software to respond intelligently.

  • Game

    Some thing interesting about game, make everyone happy.

Recommend Org

  • Facebook photo Facebook

    We are working to build community through open source technology. NB: members must have two-factor auth.

  • Microsoft photo Microsoft

    Open source projects and samples from Microsoft.

  • Google photo Google

    Google ❤️ Open Source for everyone.

  • D3 photo D3

    Data-Driven Documents codes.