Git Product home page Git Product logo

grafana_status_panel's Introduction

Grafana Status Panel

This is a plugin meant to be used as a centralized view for the status of component in a glance. It is very similar to the Single Stat panel, but it can hold multiple values from the same data source. Each value can be used to customize the panel in different ways:

  • Mark the severity of the component
  • Mark if the component is disabled
  • Show extra data in the panel about the component

The General Idea

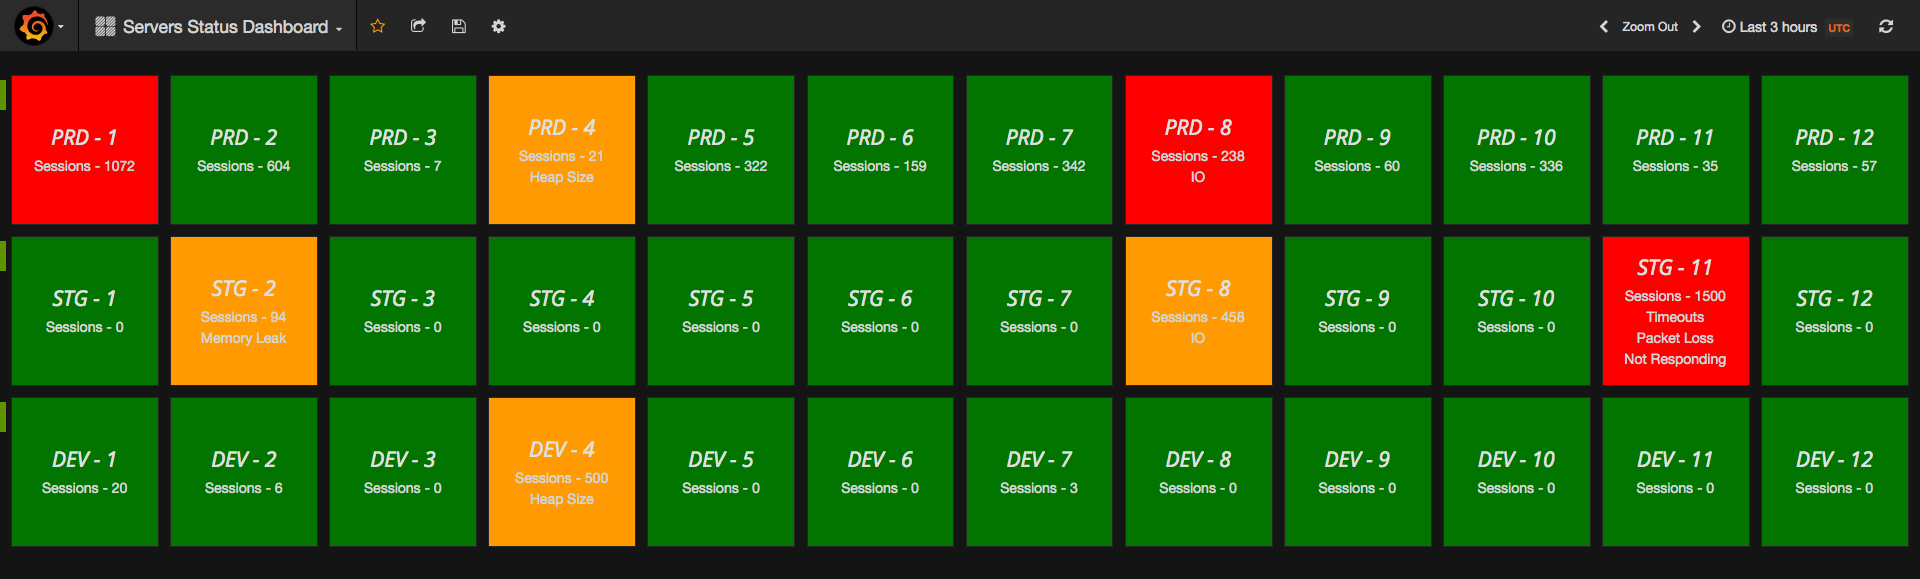
Lets say that you want to monitor a bunch of servers, and you want to keep track of multiple stats for each of them, and see in a glance the status of all of them.

This plugin will make it easier to do. You just add all the metrics you want to track, and choose how you want their values to be treated:

  1. Component severity marker - Set the threshold for each and you get an overview that will report to you if there is anything wrong with any of the metrics. This means that if all the metrics are in the OK state, the panel will be green. If even one of the metrics is in the WARNING state, it will be yellow, and red if any of them is CRITICAL.
  2. Component disable marker - Set the exact value that represents if the component is disabled, the panel will be grey.
  3. Display as text - show extra information about the component in the panel.

Severity and text values can be shown in 2 modes:

  1. Regular - under the panel title.
  2. Annotation - In the top left side of the panel.

Note: The disable markers are prioritized over the severity ones.

You can also repeat the panel on a template if you have multiple instances that you want to watch.

How to install (for debugging purposes only)

  1. Copy the contents of "Grafana_Status_panel" to the "/var/lib/grafana/plugins" folder
  2. Restart grafana by using "service grafana-server restart"
  3. Now this panel should be installed.

How to use

  1. Add the queries you want to the panel and give each of them a unique alias
  2. Choose the name of the panel to be displayed in the Panel Title field. Note: this field supports Grafana templates, so if you repeat the panel the correct name will show
  3. Go to the Options tab, and choose how to treat each metric.
    1. For severity display, select one of the Threshold option types (Number Threshold / String Threshold / Date Threshold) under Handler Type. Enter the Warning and Critical thresholds for each of your queries.
      • You can configure when the alias name and its value will be displayed in the dashboard panel by changing the fields: Display Alias, Display Value
      • String Threshold option makes equality check to the values
      • Number Threshold and Date Threshold options make range check with the values. The plugin automatically detects if higher values are good, or lower values are good by checking which threshold is higher/lower. i.e. if in your metric higher values are better, put a lower value in the critical threshold than the warning threshold.
    2. For disable display, select the Disable Criteria option type under Handler Type. Enter the Disable Value for each of your queries.
    3. For display the text without any condition, select the Text Only option type under Handler Type. The alias + the value of the metric will be shown on the panel by the Display Type value.
  4. If the query returns multiple values, choose the type of aggregation you want to be used (None will use first item from the result)

Other Features

Remove Prefix

The plugins has a 'Remove Prefix' field in the configuration. This field is meant for easier renaming of the panels when you repeat them from a Grafana template.

i.e. you recognize your servers by domain, and they are all named in the following way www.general-prefix.server.com, and you would like to remove the prefix from the display, then you enter www.general-prefix. and all the panels will only display the server.com part.

Display Value by Regex

When you want to display just part of the value for a specific metric in the screen, you can pass a regex in the Value Regex field, and if there is match, Only the first match will be displayed. Otherwise, the original value will be displayed.

Measurement URL

Lets say that you want your user to be able to get instructions on what to do when a certain metric is at Warning or Critical levels. Just put a link in this field and the name will become clickable, and send your user to the URL (like an internal wiki).

Threshold preferences

Panel display tuning is available when metric value gets to different states (ok / warning / critical / disabled):

  1. You can change the relevant color for each state.
  2. You can configure if the color will change the panel background or the metric text.
  3. You can change the text format (bold / italic) for metric text in warning / critical / disabled states.

Show disable for no data

If there is not data from any of the metrics, you can show the panel as disabled (in Grey), by checking the value Make panel gray when no data on the top of the options tab

Supported Data Sources

Currently the plugin was tested with influxDB and Graphite. Support for other data sources could be added by demand

Release Notes

Upgrading Tips

When upgrading there might be some changes in the data the plugin uses and saves, so some of the configurations you made might be removed by accident. To prevent this loss of configuration you should save the panel JSON of all panels you have (by exporting the panel or dashboards) and keep them somewhere safe until you made sure everything is working after the upgrade.

Version 1.0.8 - What's new?

  • Adding support for Grafana 5.0.x:
    • Added option to auto scroll the alerts in case the text overflows the panel view
    • Fix header padding when title is absent

Screenshots

Panel States

ok warning error

The end result should look like this

Result

License

See the LICENSE file for license rights and limitations (Apache License, Version 2.0)

grafana_status_panel's People

Contributors

abadyan-vonage avatar chris-heath avatar dependabot[bot] avatar dg-nvm avatar gpegel avatar kgullion-vonage avatar lliyrik avatar marc-assmann avatar mefhigoseth avatar msuterski avatar nibynool avatar peteba avatar pigueiras avatar tmongero-vonage avatar tomer-amir-vonage avatar yehonatanvonage avatar

Stargazers

 avatar  avatar  avatar  avatar  avatar  avatar  avatar  avatar  avatar  avatar  avatar  avatar  avatar  avatar  avatar  avatar  avatar  avatar  avatar  avatar  avatar  avatar  avatar  avatar  avatar  avatar  avatar  avatar  avatar  avatar  avatar  avatar  avatar  avatar  avatar  avatar  avatar  avatar  avatar  avatar  avatar  avatar  avatar  avatar  avatar  avatar  avatar  avatar  avatar  avatar  avatar  avatar  avatar  avatar  avatar  avatar  avatar  avatar  avatar  avatar  avatar  avatar  avatar  avatar  avatar  avatar  avatar  avatar  avatar  avatar  avatar  avatar  avatar  avatar  avatar  avatar  avatar  avatar  avatar  avatar  avatar  avatar  avatar  avatar  avatar  avatar  avatar  avatar  avatar  avatar  avatar  avatar  avatar  avatar  avatar  avatar  avatar  avatar  avatar  avatar

Watchers

 avatar  avatar  avatar  avatar  avatar  avatar  avatar  avatar  avatar  avatar  avatar  avatar  avatar  avatar  avatar  avatar  avatar  avatar  avatar  avatar  avatar  avatar  avatar  avatar  avatar  avatar  avatar  avatar  avatar  avatar  avatar  avatar  avatar  avatar  avatar  avatar  avatar  avatar  avatar  avatar  avatar  avatar  avatar  avatar  avatar  avatar  avatar  avatar  avatar  avatar  avatar  avatar  avatar  avatar  avatar  avatar

grafana_status_panel's Issues

[Feature Request] Have status tile names be clickable without using Metric URL / Warning Thresholds

Currently, the only way to look at a specific dashboard for a specific node (Panel Title) is to use the metric URL and link the dashboard with the node (Panel Title) variable. This is unfortunate because it clutters the beautiful status panel with useless text. Would it be possible to make the text for any panel title a hyperlink? That link could then be set in the Status Panel options and could parse variables such as the current node. Basically, that hyperlink would act the same way as the Metric URL but for the Panel Title.

[Feature request] Restricting number of metrics displayed on panel to preserve layout

I understand that the idea of Status panel is to aggregate many metrics into a single panel.
But when too many of these metrics have an issue, the list in the panel gets too long and the panel stretches vertically.

This breaks the layout and reduces the transparency of the whole board, as rows grow very high and won't fit on a single screen at some point.

I'd love an option to restrict the metrics displayed in the panel, e.g. restriction of 5 failing metrics to 3 could look like:
My Status Panel
Red Metric 1
Red Metric 2
Red Metric 3
(... and 2 more)

Alternative: Restriction of a panel to a maximum height (the property height of a Status panel cannot be used for that currently), where extraneous metrics could simply be cut off.

What do you think of this?

Drill-down links open in new tab even without selecting this option

Defining drill-down links on a status panel makes its title (the center text) clickable.
I'd like this to use to link to detail dashboard, and I want it to open in the current tab. So I don't check the option "Open in new Tab"

Still, the link will open in a new tab (Firefox) or new browser window (Internet Explorer).

Also, while I don't define any Url parameters, and don't include time range or variables, the link ends with ?undefined

Can you take a look into this?
Aside from these issues, this panel type suits our need really well, so thumbs up!

Hide metrics if null

When using Status Panel to repeat panels, it is very necessary to hide the metrics in the repeat panels if they were to be null.
Saves a lot of work time by having to create each status panel individually.

Regex filtering seems not to work

The javascript seems in the current version to throw an error (tested with Chrome v58) and seems like the input variable is not set and therefore the regular expression matching seems to be unhappy:

Background: I was trying to round a float (coming from a sumSeries graphite operation) and limit the number of digits displayed in the status panel to ease reading the status for multiple servers.

boot.d709d8d5.js:51 TypeError: Cannot read property 'match' of null
    at numberOrTextFilter (/public/plugins/vonage-status-panel/status_ctrl.js?bust=1497007999965:131)
    at fn (eval at compile (boot.d709d8d5.js:53), <anonymous>:4:321)
    at boot.d709d8d5.js:51
    at o.$digest (boot.d709d8d5.js:51)
    at o.$apply (boot.d709d8d5.js:52)
    at boot.d709d8d5.js:52
    at f (boot.d709d8d5.js:50)
    at boot.d709d8d5.js:50

screen shot 2017-06-09 at 13 44 03

Sliding time-window for ES, instead of fixed blocks...

Hi,

When I use ElasticSearch as datasource, and put my query time to 10m, I see that the blocks are not a sliding window, but blocks of time 00:00-00:10 / 00:10-00:20 etc.

For a status panel, this is not working, because the thresholds are set for a complete set of occurrences in the full 10 minute timeframe.

Am I doing something wrong or is this a current limitation?

Thanks!
Sjoerd

Support for DataDog Premium Plugin

Grafana Labs is currently working on DataDog plugin in beta. I'm currently beta-testing it. Would love to use your plugin with this plugin. Could you see about enhancement to support the DataDog plugin?

You can request the code by submitting as a beta evaluator.

Add Stronger Threshold Support

The current threshold system assumes that larger values are a problem.

In a current use-case I have, larger values are a good thing (indicating number of operational systems).

Support for Date Thresholds and formatting

I use the status panel in many of my dashboard and had extending your code to include String and Date Thresholds. I had also added the standard formatting options for Decimals, Units and Time/Date.

image

I was going to create a pull request but have just seen your recent commits that have "overloaded" the Threshold mode to cover both Numbers and Strings. Nice code factoring but makes it difficult to present formatting options as you don't know whether the measurement is going to be a string or a number.

I wondered whether you would be amenable to having separate Number Threshold, String Threshold and Date Threshold modes with each having their own formatting options (i.e. decimals and units for Number Thresholds, time/date formats for Date Thresholds) ?

If this is OK then I could look to adapt my changes to your latest code base and submit a pull request.

How can I add data source support?

Hi Guys,

I want to know how can I support other data source? Currently we are using OpenTSDB as data source, I've tried this plugin in my project, seems it works with OpenTSDB. Could someone tell me for what reason it's not supported ? If I know the reason I may help on this.

Datasource for Grafana Status Panel

HI !
Thank you for your status panel, i think that's exactly what i need, but I couldn't export any data from zabbix to this panel. Have you tested it? I mean Zabbix plugin for Grafana, it provides "Zabbix Datasource" within. Is there any way to add this functionality ?

Template variables not working when used in graphite queries

When a template variable is used in a graphite query, the corresponding data is not being displayed.
Ex:
maxSeries(com.test.backend_01.jvm.heap.max) - this returns a value.
But
maxSeries(com.test.$server.jvm.heap.max) - where $server is a template variable defined to hold differing values, does not return any data.

Support for boolean and null in thresholds

Hello,
We have a case where we'd like to monitor boolean value from influx.
Ideally, we'd like to have for example green status for boolean true, warning for boolean false, and probably critical for data missing.
Currently Warning and Critical boxes don't support anything except [0-9,.+-]

Threshold for numbers is not working

Hi guys,

Thanks for the great work, it seems this status panel is the only one which can aggregate multiple metrics.

Though it doesn't fire thresholds if I specify them as numbers. I've found out that it happens due to incorrect propagation of the threshold values into the parseThresholds method, i.e. they are passed as strings anyway, so when you do the checking of angular.isNumber it's always a string. I'm on grafana 4.2.2 by the way.

Here is a work around that helped to fix it in meanwhile:

{
	key: "parseThresholds",
	value: function parseThresholds(metricOptions) {
		var res = {};

		res.warnIsNumber = NUMBER_REGEXP.test(res.warn);
		if (res.warnIsNumber) {
			res.warn = parseFloat(metricOptions.warn);
		} else {
			res.warn = metricOptions.warn;
		}

		res.critIsNumber = NUMBER_REGEXP.test(res.crit);
		if (res.critIsNumber) {
			res.crit = parseFloat(metricOptions.crit);
		} else {
			res.crit = metricOptions.crit;
		}
		return res;
	}
}

[Feature Request] Configurable text colour

Thanks a ton for this great panel!

We make use of both the dark and light Grafana themes (depending on the customer). With the dark theme the text is clearly legible:

screen shot 2017-08-24 at 12 31 08

However with the light theme it's not:

screen shot 2017-08-24 at 12 30 30

It would be super if you could include an option to change the text colour.

Adding a detail link (absolute) to a panel turns panel title into an invalid link

When I add an absolute link (say www.github.com) to a status panel (General tab), the link appears as an annotation/popup.

However, the panel title also becomes clickable, but leads to the local URL [this-grafana]/dashboard/undefined?undefined

I guess it was intended for the Panel title to also become a link to www.github.com? This would be my expected behaviour, as the popup in the left upper corner is a bit too subtle.

Context:
Grafana 4.1.2.
Status Panel 1.0.3

Alertmanager support

Can you add alert feature to your plugin like in built in dasboard. And it'll be good to mark failed metric.
Thanks for your work.

Vrong value

On grafana 4.1.2 I installed the latest status panel version (1.0.1).
For testing I added one status panel and one singlestat panel with the same query on the metric tab to see the differences between them but I noticed the values displayed were different.
I installed the panel through grafana-cli command.
What can I do to solve the problem?

Thanks
statuspanel

Support for Grafana 4.x

It looks like Grafana Status Panel isn't working with Grafana 4.1.x. Do you have plans to support Grafana 4.x?

It seems I can't configure Grafana Status Panel in 4.1.1 because I'm not able to define thresholds on the Options tab.

Show disable for no data - doesn't work

Hi there,

I'm using
Plugin version: 1.0.3
Grafana: v4.2.0 (commit: 349f3eb)
Influxdb: 1.2.2

and Show disable for no data options doesn't work. it always shows dead host as green.

That's the query browser sends to influxdb

SELECT mean("usage_idle") * -1 + 100 FROM "cpu" WHERE "cpu" = 'cpu-total' AND "host" =~ /^ SERVERNAME $/ AND time > now() - 60s;SELECT "used_percent" FROM "mem" WHERE "host" =~ /^ SERVERNAME $/ AND time > now() - 60s;SELECT mean("percent_packet_loss") FROM "ping" WHERE "host" =~ /^SERVERNAME$/ AND "url" = '45.32.86.215' AND time > now() - 60s

and here is the return.

{
    "results": [
        {
            "statement_id": 0
        },
        {
            "statement_id": 1
        },
        {
            "statement_id": 2
        }
    ]
}

I've ran the same query via CLI and no data was returned either.

Screenshot: https://www.evernote.com/l/AAq0aLsiJEBIeZFm8uSi7OnaWD2eypfOeW4

Any ideas?

[Feature request] Higher urgency for missing values / threshold for 'No data'

Hi,

while the Make panel gray when no data option is very useful, it should be applicable on a per metric basis.

So imagine I aggregate 2 metrics Metric A and Metric B in a single Status panel, where there's no data for Metric A, but 'good' values for Metric B.

With Status Panel 1.0.4, the panel turns green. But there are cases (like ours :)) where 'no values' is just as problematic as 'bad values'.

Thus I propose to add an option to the threshold of each metric,
e.g.
Warning..............90
Critical.............50
Alert 'No data'......โœ”
Show always..........

This would imply that panels with metrics without data will no longer be green, but gray. Also, the 'gray' metrics would be listed on the panel.

If there are metrics that satisfy the Warning or Critical thresholds, these should probably outrule the no data threshold. To visualize the prioritization Critical > Warning > No data > No threshold met, you could consider switching Warning with Critical in the Threshold section.

What's your opinion?

Support Prometheus

Add support for Prometheus data sources.
I would really appreciate it to use this add-on with prometheus data source.

Value Regex does not function with numeric values (perhaps graphite only?)

The regex values were not being applied to numbers. (Grafana 4.4.3 - Graphite Datasource) - I was unable to find a suitable way of getting graphite to round its values (perhaps there is one that I'm unaware of). But In any case, I feel the behavior of the valuedisplayregex is improved by having it also support numerical values.

I modified dist/status_ctrl.js as follows to achieve the desired result: (I don't typically code in javascript - I didn't submit it as a patch as I suspect you may wish to alter significantly)

It uses the original filter for number in the cases where regex fails.

                                            coreModule.filter('numberOrTextWithRegex', function () {
                                                    var numberOrTextFilter = function numberOrTextFilter(input, textRegex) {
                                                    var stringInput;
                                                    var failReturn;

                                                    if (angular.isNumber(input)) {
                                                       stringInput = input.toString();
                                                       failReturn = _this2.filter('number')(input);
                                                    } else {
                                                       stringInput = input;
                                                       failReturn = input;
                                                    }


                                                    if (textRegex == null || textRegex.length == 0) {
                                                        return failReturn;
                                                    } else {
                                                        var regex = void 0;

                                                        try {
                                                            regex = new RegExp(textRegex);
                                                        } catch (e) {
                                                            return failReturn;
                                                        }

                                                        var matchResults = stringInput.match(regex);
                                                        if (matchResults == null) {
                                                            return failReturn;
                                                        } else {
                                                            return matchResults[0];
                                                        }

                                                    }
                                                    }; 

Feature request: Option to inverse

I need an indicator that goes to red in case that a value goes below a threshold and not above.

This could be done by changing the css, but would impact all panels. An additional configuration option should be easy to implement and would be the right way to go.

Kind regards,
Nadir

[Enhancement] Add support for units

It would be very useful to be able to apply the standard Grafana units to each measurement in the panel, especially on a per-measurement basis. Our use case is monitoring server hardware (CPU, memory, disk, IO, etc.).

"Show Metric" check box

Hi
Uncheck the "Show Value" checkbox show the alias but not the value
Click on the eye icon hide the metric at all with no way to set a threshold for this field.
What we look for is a mix of the two above. Means not showing the value and the metric . However, be able to set a threshold color according to the field value.
Please advise.
Thanks,
Eli

Template doesn't work

The metric is not shown when using template in query. I forced to show the data but still didn't work. But when I query the server straight from the query everything work fine.

Graphite v. 0.9
Grafana v. 4.5
Status panel v. 1.05

Sorting fields in pannel

Hi,
Status panel plugin is very useful for us and I'm using it to display several values at each panel.
In my case, the panel can be much usable if fields appear in the same sorting manner.

Thanks a lot !
Doron

Where to set Warning and Critical thresholds (they appear to be missing!)

In the README it says in the 3rd item on How to use: Go the the Options tab, and enter the Warning and Critical thresholds for each of your queries

My Options tab only shows:

  • Panel Title
  • Remove Prefix

I cannot find the threshold settings in any of the tabs (General Metrics Options Time range)

My (repeated) status panels are shown green (and only geen). Furthermore my query shows a correct graph when clicked on the Link to Graph in Prometheus

Can it be caused by the Panel data souce which is Prometheus?

Version Info

  • I am using Grafana v4.1.1
  • Same with Grafana v3.1.1 (commit: a4d2708)
  • The status_panel is version 1.0.0
  • Query on Prometheus

[Feature request] Hide panels depending on threshold

Hi, thank you for the awesome plugin!

It would be awesome if you could add the option to hide panels that are in the green. Use case example: I have a list of ~150 servers, and while it is nice to see that a lot of the servers are doing fine, it takes up a lot of screen space, to the point where I can barely fit them all on one screen. I would like to be able to only display the ones that require my attention, that is, only show the ones that are above the warning/critical threshold.

Not working with Zabbix as datasource

Hi.
I know it's not supposed to be included, but it seems like a very useful panel for Zabbix.
So far I was able to select the metrics as if it was supported but then I get no values.
Not sure if this is the right way to do such a request, please delete if inapropriate.

[Feature request] Support tags in Alias & limit decimals

I am trying to group all measurements from, for example, disk usage in one panel, so it can alert if any of the hosts is using more than x% of disk.

The panel does not seem to support tags in the Alias. This means I will have to add every host manually?
screen shot 2016-12-30 at 15 36 36
screen shot 2016-12-30 at 15 36 40

Would it also be possible to display a maximum number of decimals displayed for readability?

Add font control

Controlling the font will allow for better display options.
Using something like the SingleStat percentage or having the option to user Markup/HTML would be great.

"Same alias" error

Hello,

I'm trying to use your plug-in to build status tiles for each of our apps, for which I need to add multiple Bosun queries for each panel. The problem is that when I add the second query I get the error saying: "Error: There are multiple measurements with the same alias. Please give each measurement a unique name." No matter how I change the alias names the same error always appears. I debugged your code and if I understood it correctly it not only checks for unique alias, but also for unique targets (https://github.com/Vonage/Grafana_Status_panel/blob/master/src/status_ctrl.js#L96) which is weird as I can't even set different targets per query (and I don't even want to).
Could you please clarify the exact behavior as I can't solve this problem myself...?

Thanks,
Balazs

Recommend Projects

  • React photo React

    A declarative, efficient, and flexible JavaScript library for building user interfaces.

  • Vue.js photo Vue.js

    ๐Ÿ–– Vue.js is a progressive, incrementally-adoptable JavaScript framework for building UI on the web.

  • Typescript photo Typescript

    TypeScript is a superset of JavaScript that compiles to clean JavaScript output.

  • TensorFlow photo TensorFlow

    An Open Source Machine Learning Framework for Everyone

  • Django photo Django

    The Web framework for perfectionists with deadlines.

  • D3 photo D3

    Bring data to life with SVG, Canvas and HTML. ๐Ÿ“Š๐Ÿ“ˆ๐ŸŽ‰

Recommend Topics

  • javascript

    JavaScript (JS) is a lightweight interpreted programming language with first-class functions.

  • web

    Some thing interesting about web. New door for the world.

  • server

    A server is a program made to process requests and deliver data to clients.

  • Machine learning

    Machine learning is a way of modeling and interpreting data that allows a piece of software to respond intelligently.

  • Game

    Some thing interesting about game, make everyone happy.

Recommend Org

  • Facebook photo Facebook

    We are working to build community through open source technology. NB: members must have two-factor auth.

  • Microsoft photo Microsoft

    Open source projects and samples from Microsoft.

  • Google photo Google

    Google โค๏ธ Open Source for everyone.

  • D3 photo D3

    Data-Driven Documents codes.