virtsionis / torch-nilm Goto Github PK
View Code? Open in Web Editor NEWLicense: MIT License
License: MIT License


Sir
I successfully created the environment with the YAML file given in the repository. But I got the following error. Could you please help me to sort it out. For your information I am using NVIDIA RTX A5000 GPU.

Sometimes in evaluation of a chunk during CrossValidation, an error regarding NATType object occurs...
Reproduce: 5fold CV experiment on fridge appliance.
train dates: UKDALE,1,2013-01-15,2013-10-01
TIMING: NILMTK select using appliances: 0.01
Traceback (most recent call last):
File "/mnt/B40864F10864B450/WorkSpace/PHD/PHD_exps/torch_nilm/hyp_tuning_cv.py", line 161, in
train_eval(model_name,
File "/mnt/B40864F10864B450/WorkSpace/PHD/PHD_exps/torch_nilm/modules/helpers.py", line 246, in train_eval
test_dataset = ElectricityDataset(datasource=datasource, building=int(building),
File "/mnt/B40864F10864B450/WorkSpace/PHD/PHD_exps/torch_nilm/datasources/torchdataset.py", line 268, in init
super().init(datasource, building, device,
File "/mnt/B40864F10864B450/WorkSpace/PHD/PHD_exps/torch_nilm/datasources/torchdataset.py", line 36, in init
self._init_generators(datasource, building, device, start_date, end_date, sample_period, chunksize)
File "/mnt/B40864F10864B450/WorkSpace/PHD/PHD_exps/torch_nilm/datasources/torchdataset.py", line 53, in _init_generators
self._reload()
File "/mnt/B40864F10864B450/WorkSpace/PHD/PHD_exps/torch_nilm/datasources/torchdataset.py", line 69, in _reload
mainchunk = next(self.mains_generator)
File "/home/nick/anaconda3/envs/torch-nilm/lib/python3.8/site-packages/nilmtk/electric.py", line 626, in load_series
for chunk in generator:
File "/home/nick/anaconda3/envs/torch-nilm/lib/python3.8/site-packages/nilmtk/metergroup.py", line 718, in load
start = normalise_timestamp(section.start, freq)
File "/home/nick/anaconda3/envs/torch-nilm/lib/python3.8/site-packages/nilmtk/utils.py", line 338, in normalise_timestamp
resampled = series.resample(freq).mean()
File "/home/nick/anaconda3/envs/torch-nilm/lib/python3.8/site-packages/pandas/core/resample.py", line 906, in g
return self._downsample(_method)
File "/home/nick/anaconda3/envs/torch-nilm/lib/python3.8/site-packages/pandas/core/resample.py", line 1049, in _downsample
self._set_binner()
File "/home/nick/anaconda3/envs/torch-nilm/lib/python3.8/site-packages/pandas/core/resample.py", line 181, in _set_binner
self.binner, self.grouper = self._get_binner()
File "/home/nick/anaconda3/envs/torch-nilm/lib/python3.8/site-packages/pandas/core/resample.py", line 189, in _get_binner
binner, bins, binlabels = self._get_binner_for_time()
File "/home/nick/anaconda3/envs/torch-nilm/lib/python3.8/site-packages/pandas/core/resample.py", line 1038, in _get_binner_for_time
return self.groupby._get_time_bins(self.ax)
File "/home/nick/anaconda3/envs/torch-nilm/lib/python3.8/site-packages/pandas/core/resample.py", line 1463, in _get_time_bins
first, last = _get_timestamp_range_edges(
File "/home/nick/anaconda3/envs/torch-nilm/lib/python3.8/site-packages/pandas/core/resample.py", line 1691, in _get_timestamp_range_edges
first, last = _adjust_dates_anchored(
File "/home/nick/anaconda3/envs/torch-nilm/lib/python3.8/site-packages/pandas/core/resample.py", line 1765, in _adjust_dates_anchored
start_day_nanos = first.normalize().value
AttributeError: 'NaTType' object has no attribute 'normalize'
Hi,
the fct "get_statistical_report" of "nilm_reporting.py" intends to allow passing through plotting arguments to the function call "plot_dataframe". But currently, the plot_args are unpacked already by get_statistical_report:
def get_statistical_report(save_name: str = None, data: pd.DataFrame = None, data_filename: str = None,
                           root_dir: str = None, output_dir: str = DIR_OUTPUT_NAME, stat_measures: list = None,
                           save_plots: bool = True, **plot_args):
This causes issues later on as you can not unpack plot_args again on the call to plot_dataframe.
So it should look like this:
def get_statistical_report(save_name: str = None, data: pd.DataFrame = None, data_filename: str = None,
                           root_dir: str = None, output_dir: str = DIR_OUTPUT_NAME, stat_measures: list = None,
                           save_plots: bool = True, plot_args: dict = None):


the kl loss is always the same, so the mu and std.
Hi,
the fct "get_statistical_report" of "nilm_reporting.py" intends to allow passing through plotting arguments to the function call "plot_dataframe". But currently, the plot_args are unpacked already by get_statistical_report:
def get_statistical_report(save_name: str = None, data: pd.DataFrame = None, data_filename: str = None,
                           root_dir: str = None, output_dir: str = DIR_OUTPUT_NAME, stat_measures: list = None,
                           save_plots: bool = True, **plot_args):
This causes issues later on as you can not unpack plot_args again on the call to plot_dataframe.
So it should look like this:
def get_statistical_report(save_name: str = None, data: pd.DataFrame = None, data_filename: str = None,
                           root_dir: str = None, output_dir: str = DIR_OUTPUT_NAME, stat_measures: list = None,
                           save_plots: bool = True, plot_args: dict = None):
I had prosed the issue about the vae. The problem was that the mu and std were always the same and the VAE loss didn't drop well.
Now I know the problem is that your VAE decoder is wrong ! As you can see from the picture blow , all the deconvolution layers use the same layer named self.deconv1 , which seriously affects network performance.
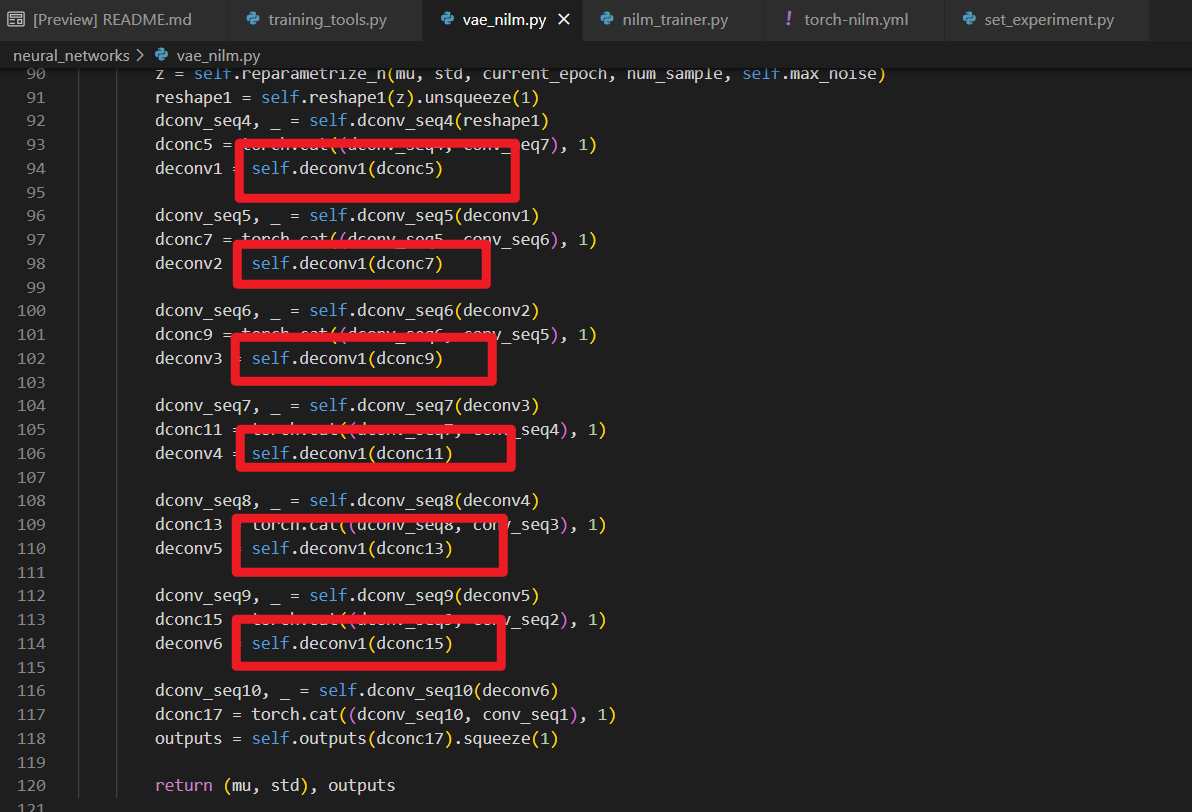
After my change, the vae loss drops well

Hi,
I was having some performance issues caused by NILMmetrics. Using Seq2Seq preprocessing and even small volume data, after testing I would be stuck for ~ 10 minutes until the metrics were done.
Profiling shows the main culprits being the thresholding list comprehensions for ground and preds aswell as several sum() calls. Replacing the former with np.where() and the latter with np.sum cut the time for NILMmetrics down to just a few seconds.
So I suggest implementing that in the code.
    {
        'model_name': 'VAE',
        'hparams': {'window_size': 1024, 'cnn_dim': 256, 'kernel_size': 3, 'latent_dim': 16},
    },
I am facing problems when installing your environment using conda, it states it cannot find the packages to install:
After running: conda env create --name torchenv -f torch-nilm.yml
Solving environment: failed

ResolvePackageNotFound:
  - markupsafe==2.0.1=py38h497a2fe_0
  - libstdcxx-ng==9.3.0=h6de172a_19
  - tornado==6.1=py38h497a2fe_1
  - c-ares==1.17.1=h7f98852_1
  - bzip2==1.0.8=h7f98852_4
  - readline==8.1=h46c0cb4_0
  - libgomp==9.3.0=h2828fa1_19
  - kiwisolver==1.3.1=py38h1fd1430_1
  - pysocks==1.7.1=py38h578d9bd_3
  - terminado==0.10.1=py38h578d9bd_0
  - scipy==1.6.3=py38h7b17777_0
  - numpy==1.19.5=py38h18fd61f_1
  - pandas==0.25.3=py38hb3f55d8_0
  - freetype==2.10.4=h0708190_1
  - libsodium==1.0.18=h36c2ea0_1
  - mistune==0.8.4=py38h497a2fe_1003
  - argon2-cffi==20.1.0=py38h497a2fe_2
  - yaml==0.2.5=h516909a_0
  - python==3.8.10=h49503c6_1_cpython
  - libnghttp2==1.43.0=h812cca2_0
  - libpng==1.6.37=h21135ba_2
  - jedi==0.18.0=py38h578d9bd_2
  - libgfortran-ng==9.3.0=hff62375_19
  - anyio==3.1.0=py38h578d9bd_0
  - scikit-learn==0.24.2=py38hdc147b9_0
  - icu==64.2=he1b5a44_1
  - ca-certificates==2021.5.30=ha878542_0
  - websocket-client==0.57.0=py38h578d9bd_4
  - sqlite==3.35.5=h74cdb3f_0
  - pyrsistent==0.17.3=py38h497a2fe_2
  - pyzmq==22.1.0=py38h2035c66_0
  - libev==4.33=h516909a_1
  - libgfortran5==9.3.0=hff62375_19
  - libopenblas==0.3.15=pthreads_h8fe5266_1
  - mock==4.0.3=py38h578d9bd_1
  - setuptools==49.6.0=py38h578d9bd_3
  - certifi==2021.5.30=py38h578d9bd_0
  - _openmp_mutex==4.5=1_gnu
  - cffi==1.14.5=py38ha65f79e_0
  - chardet==4.0.0=py38h578d9bd_1
  - libcurl==7.77.0=h2574ce0_0
  - sniffio==1.2.0=py38h578d9bd_1
  - hdf5==1.10.6=nompi_h6a2412b_1114
  - matplotlib-base==3.1.3=py38h250f245_0
  - numexpr==2.7.3=py38h51da96c_0
  - hmmlearn==0.2.5=py38h5c078b8_0
  - libedit==3.1.20191231=he28a2e2_2
  - ipykernel==5.5.5=py38hd0cf306_0
  - ld_impl_linux-64==2.35.1=hea4e1c9_2
  - jupyter_core==4.7.1=py38h578d9bd_0
  - _libgcc_mutex==0.1=conda_forge
  - libgcc-ng==9.3.0=h2828fa1_19
  - ncurses==6.2=h58526e2_4
  - pyyaml==5.4.1=py38h497a2fe_0
  - libffi==3.3=h58526e2_2
  - importlib-metadata==4.5.0=py38h578d9bd_0
  - nbconvert==6.0.7=py38h578d9bd_3
  - libssh2==1.9.0=ha56f1ee_6
  - ipython==7.24.1=py38hd0cf306_0
  - cryptography==3.4.7=py38ha5dfef3_0
  - blosc==1.21.0=h9c3ff4c_0
  - openssl==1.1.1k=h7f98852_0
  - pytables==3.6.1=py38hc386592_3
  - zlib==1.2.11=h516909a_1010
  - brotlipy==0.7.0=py38h497a2fe_1001
  - xz==5.2.5=h516909a_1
  - pandoc==2.14.0.2=h7f98852_0
  - zeromq==4.3.4=h9c3ff4c_0
  - tk==8.6.10=h21135ba_1
  - krb5==1.19.1=hcc1bbae_0
- lzo==2.10=h516909a_1000Hi,
I noticed that the predictions when using Seq2Seq preprocessing are not further processed before the metrics. This means that the overlapping predictions for the same timeseries point are treated as if they were singular predictions. I'm not sure if this is intentional, but I think it makes sense to apply some statistical measure (mean, median) to aggregate those overlapping predictions into one value and then calculate the metrics for these.
In case you agree with me, you could take a look at my implementation of this:
    def _average_overlap(self, a):
        # for seq 2 seq, (almost) each point gets predicted <window_size> times.
        # this function averages the overlapping predictions for each point.

        # the idea is to turn the output array back into a 2d array with <window_size>
        # columns, such that each predicted sequence is one row. Each predicted point
        # will shift from right to left every row. This means all the overlapping
        # predictions for one timeseries point lay on the same anti-diagonal of the 2D
        # array. Thus, one simply needs to average over all the anti-diagonals in the
        # array.

        a = np.reshape(a, (-1, self.window_size)) # turn into 2d array
        a = np.fliplr(a) # need to flip the array to turn the anti-diagonals into diagonals, as np.diag only works on diagonals
        a = a.T # need to transpose for the offset of np.diag to work properly

        # the array now looks something like this - same numbers are overlapping predictions
        # -----------------------------------------------
        # 5 6 7 8 9 10 ...
        # 4 5 6 7 8 9 ....
        # 3 4 5 6 7 8 ....
        # 2 3 4 5 6 7 ....
        # 1 2 3 4 5 6 ....

        # the main diagonal (offset = 0) is the one with the 5s in this case. Thus, we
        # need to begin our offset in the negative (below the diagonal) and continue
        # from there to also average the predictions where there are less then <window_size>
        # overlapping predictions.


        a = np.array(
            [np.mean(np.diag(a, k=k)) for k in range(1 - self.window_size, a.shape[1])]
            )

        return a
I call this function in the _metrics call of the classic training tools. You will also have to hand over window size and preprocessing method to that class, though.
This takes about 9 seconds for testing with the small experiment volume, when I use it for both preds and ground. Certainly, one could also store the ground before it is preprocessed inititally and avoid having to call this function on the ground - I was too lazy for that though :)
I imagine that a similar issue also exists with seq2subseq, but as I'm not using that right now, someone else might take a look at that.
It`s still hard to fully understand how I should use this framework.A comprehensive and more detailed notebook(take NFED for example)cound be quite useful.Thanks for your contribution to NILM
A declarative, efficient, and flexible JavaScript library for building user interfaces.
🖖 Vue.js is a progressive, incrementally-adoptable JavaScript framework for building UI on the web.
TypeScript is a superset of JavaScript that compiles to clean JavaScript output.
An Open Source Machine Learning Framework for Everyone
The Web framework for perfectionists with deadlines.
A PHP framework for web artisans
Bring data to life with SVG, Canvas and HTML. 📊📈🎉
JavaScript (JS) is a lightweight interpreted programming language with first-class functions.
Some thing interesting about web. New door for the world.
A server is a program made to process requests and deliver data to clients.
Machine learning is a way of modeling and interpreting data that allows a piece of software to respond intelligently.
Some thing interesting about visualization, use data art
Some thing interesting about game, make everyone happy.
We are working to build community through open source technology. NB: members must have two-factor auth.
Open source projects and samples from Microsoft.
Google ❤️ Open Source for everyone.
Alibaba Open Source for everyone
Data-Driven Documents codes.
China tencent open source team.