Contents
| Objective | 1 | 2 | 3 |
|---|---|---|---|
| Research Question | Student does not have a coherent research question. The question is either incomplete, non-existent or is poorly communicated. | Student research question is concise, direct, and practical. Student can communicate their main findings in 1-2 sentences. Student potentially had to alter their course on the projects based on the problem and the data, these learnings are documented and articulated by the project. | Student powerfully communicated a compelling research question and student's data insights are particularly valuable and well-communicated. |
| Source Dataset | Student did not source an appropriate or usable dataset. Student did not avoid datasets that are overused in student data science projects. | Student sourced a useful dataset that was not too complex to work with and that had enough usable features so as to provide insights relating to the research question. Data set was cleaned appropriately for the project. | Student went above and beyond to source data. Student may have successfully: cleaned particularly dirty data, scraped a dataset from a website, merged multiple datasets or generated particularly creative new features on a dataset that allowed for unique insights. |
| Notebook | Student notebook is incomplete, messy, does not run from top to bottom. | Student has a notebook that documents their data cleaning, exploration, and visualizations. Notebook runs successfully from top to bottom. | Student notebook is very clean and readable. Notebook runs from top to bottom and contains appropriate markdown and code comments. |
| Two Visualizations | Student does not create at least two basic visualizations. | Student creates two explanatory visualizations that communicate insights from their dataset. | Student's visualizations are particularly polished and consumable. Viewers will correctly interpret the main data insight in seconds without reading supporting text. |
| Blog Post | Student does not write or publish a data storytelling blog post | Student writes and publishes a data storytelling blog post that includes two visualizations and effectively communicates data insights. Blog post should be written for a non-technical audience. | Student blog post is particularly well written, compelling, and consumable by non-technical readers. |
| Portfolio | Student does not link to blog post from portfolio. | Student links to their blog post from their portfolio site. | Student links to their blog post from their portfolio site and also works to share their post on social media. |
| Presentation | Student does not present or provide a recording of a presentation. | Student gives a two minute presentation or records a two-minute presentation to their peers. | Student's two-minute presentation is well rehearsed, easy to understand and communicates main ideas within the two minute time limit. |
Please Note: There is no "Sprint Challenge" associated with this Build Sprint. In order to pass the Build Sprint, you need to get a score of 2 or higher on every section of the rubric above. A score of 1 on any of the objectives will result in a 1 for the entire Sprint.
Be able to communicate your research question in 1 or 2 sentences: 280 characters or less. Your research question is extremely important and you should have one in mind before you set out. This does not mean that your research question can't change or be adapted over time. As you search for available datasets or explore your data you may learn that your question can't be answered with your dataset. That's OK! This is part of the process. Feel free to revise your research question, but at all times you need to know what you're driving at and what you're trying to communicate with your visualizations. You will need to state your research question at the beginning of your two-minute presentation at the end of the sprint.
Required
- Create Python notebook(s) to wrangle, analyze, and visualize your data.
- Push your notebook(s) to your GitHub.
- Final notebook should be clean and organized
- Notebook should run from top to bottom without errors by the end of the sprint.
Recommended
- Keep it simple. Don’t use machine learning. (You’ll do this in future projects!)
- Use helpful inline code comments and markdown where applicable. Your notebook is not your main deliverable, but on ocassion hiring managers may want to see your code after looking at one of your portfolio projects so it's good for it to be presentable.
Required
- Choose your own topic and data.
- Write a blog post with at least two data visualizations, to communicate insights on your topic.
- Publish your post on Medium, your portfolio site or some other publicly accessible webpage.
- Don’t use data from Kaggle competitions or popular “toy” datasets.
Recommended
- Don't write a "wall of text." Format your post to be skimmable. Edit it to be readable.
- Describe both your insights and your process, but focus more on the insights. Don’t include much code, if any, in your blog post.
- Remember that you're writing for a non-technical audience that doesn't have training in data science. Imagine that you're writing for an executive or boss at a company who doesn't have code/statistics training. Make the data insights as compelling and consumable as possible.
- Share your blog post with TLs, instructors, or fellow students to get feedback on it before you publish. Check out the #ds_writers and #medium channels on Slack.
Required
- Add your short summary to your portfolio site.
- Link from your portfolio site to your blog post and code.
Recommended
- Host your site with GitHub Pages.
- Include your name, bio, and contact info on your site.
- Add Google Analytics to your portfolio site and then share your post on social media and watch the pageviews roll in.
Required
- Give a two minute presentation on Zoom for your cohort.
- State your research question at the beginning of
Recommended
- Practice beforehand, out loud and timed. Two minutes will go by so much faster than you think it will. The more you rehearse the more awesome and polished your presentation will be.
- There will not be sufficient time to go over any code, you'll barely have time to go over the main takeaways from your visualizations in two minutes -trust me.
- If you end up including more than two visualizations in your project pick your favorites to talk about as you might not have time to talk about all of them.
These milestones are suggested to help you have confidence that you're on track for a great project!
End of Sprint 2
- Look at examples of past projects.
- Start your GitHub Pages portfolio site.
End of Sprint 3
- Finalize your topic and dataset.
- Write the first draft of your research question.
Module 1, Sprint 4 (Build Sprint)
- Begin to analyze and visualize your data. Try and have all data cleaning and reshaping wrapped up by the end of the first day so as to allow you ample time to create super awesome visualizations.
Module 2, Sprint 4 - end of day
- Create your first polished explanatory visualization.
Module 3, Sprint 4 - end of day
- Create your second polished explanatory visualization.
Module 4, Sprint 4 — end of day
- Complete your code and blog post.
- Share your draft with classmates for feedback.
Last day of Sprint 4 - before you give your 2 minute presentation
- Practice your 2 minute presentation.
- Publish your blog post on Medium or GitHub Pages.
- Push your code to GitHub.
- Add a short summary and link to your portfolio project to your portfolio site.
- Link from your portfolio to your blog post and code.
During Class - Last day of Sprint 4 (Build Week)
- Give your 2 minute presentation for your cohort.
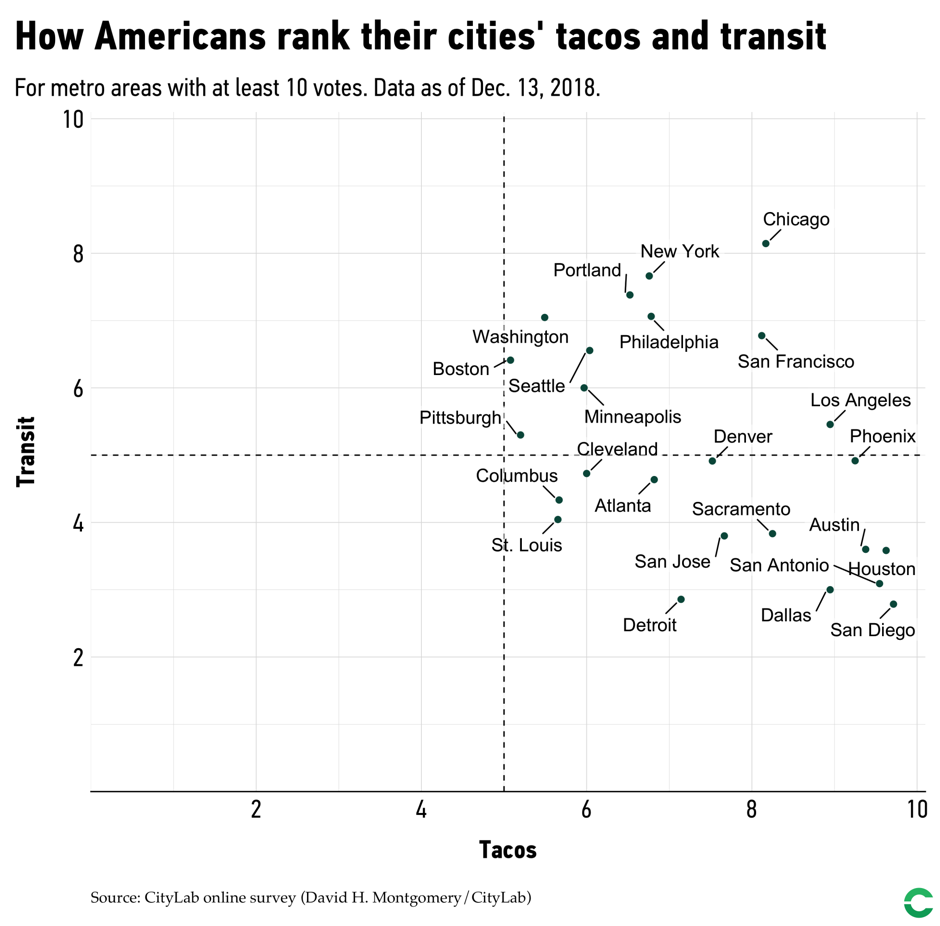
- How Americans rank their cities' tacos and transit. (You can do something this simple!)
- Mountains and Money in Colorado’s Ageless Alps: A Visual Exploration of Longevity in the Mountains. (Or this complex!)
- Training Kit has many more examples, and a process to help you find ideas.
- Max Woolf: GitHub Pages, Jekyll. Image + short description per project. You don’t need so many projects. He moved from QA Engineer to Data Scientist, without going back to school.
- Sara Simon: GitHub Pages. Former bootcamp student. Just one page, one photo, two paragraphs, six links. Less is more!
-
Dmitriy Kavyazin, Analyzing Prescription Rates in Medicaid Drug Utilization Data
-
Trista Paul, Movie Night Coming Up? An Analysis of What Goes Into Bad IMDb Ratings
-
Mac Scheffer, Play Calling in the NFL: The Road to Improvement
-
Daniel Carter, Is ‘Buy and Hold’ a Good Investment Strategy?
-
Michael Brady, Peak Kickstarter? What 182K Kickstarter Campaigns Tell Us
-
Lily Su, Motor Vehicle Injuries and Deaths from November 2018 — April 2019
-
Liv Johnson, Untapped Potential: Making the U.S. An Energy Leader
This will assist the TLs in gathering up links to everybody's portfolio site. Remember that we should be able to get to your code on github and your blog post from your portfolio site, so this should be the only link that we need in order to access the rest of your project deliverables.
