Post on Medium == https://medium.com/@valerielangat/are-landlords-in-the-business-of-bullying-c211f68f1661
Contents
The project has five parts. For each part, we've listed what's required to pass the Sprint Challenge, and what's recommended but not required.
Required
- Choose your own topic and data.
- Write a blog post with at least two data visualizations, to communicate insights on your topic.
- Publish your post on Medium or your portfolio site.
- Don’t use data from Kaggle competitions or popular “toy” datasets.
Recommended
- Don't write a "wall of text." Format your post to be skimmable. Edit it to be readable.
- Describe both your insights and your process, but focus more on the insights. Don’t include much code, if any, in your blog post.
Required
- Create Python notebook(s) to wrangle, analyze, and visualize your data.
- Push your notebook(s) to your GitHub.
Recommended
- Keep it simple. Don’t use machine learning. (You’ll do this in future projects!)
Required
- Describe your project in 280 characters or less.
- Choose one data visualization (static image or animated gif) from your blog post.
- Annotate your visualization so it’s understandable on its own, without reading your blog post.
Recommended
- Share your short project summary on Twitter or LinkedIn, and link to your blog post.
Required
- Add your short summary to your portfolio site.
- Link from your portfolio site to your blog post and code.
Recommended
- Host your site with GitHub Pages.
- Include your name, bio, and contact info on your site.
Required
- Give a two minute presentation on Zoom for your cohort.
Recommended
- Practice beforehand, out loud and timed.
These milestones are suggested to help you have confidence that you're on track for a great project!
Friday, Sprint 2
- Look at examples
Thursday, Sprint 3
- Start your GitHub Pages portfolio site
Thursday, Sprint 4
- Finalize your topic and dataset
Friday, Sprint 4
- Write the first draft of your project description, for your short summary
Monday, Sprint 5 — start of day
- Begin to analyze and visualize your data
Tuesday, Sprint 5 — end of day
- Revise your description for your short summary
- Create your first annotated visualization for your short summary
Thursday, Sprint 5 — end of day
- Complete your code and blog post
Friday, Sprint 5 — AM
- Practice your 2 minute presentation
- Publish your blog post on Medium or GitHub Pages
- Push your code to GitHub
- Add your short summary to your porfolio site
- Link from your portfolio site to your blog post and code
Friday, Sprint 5 — PM
- Give your 2 minute presentation for your cohort
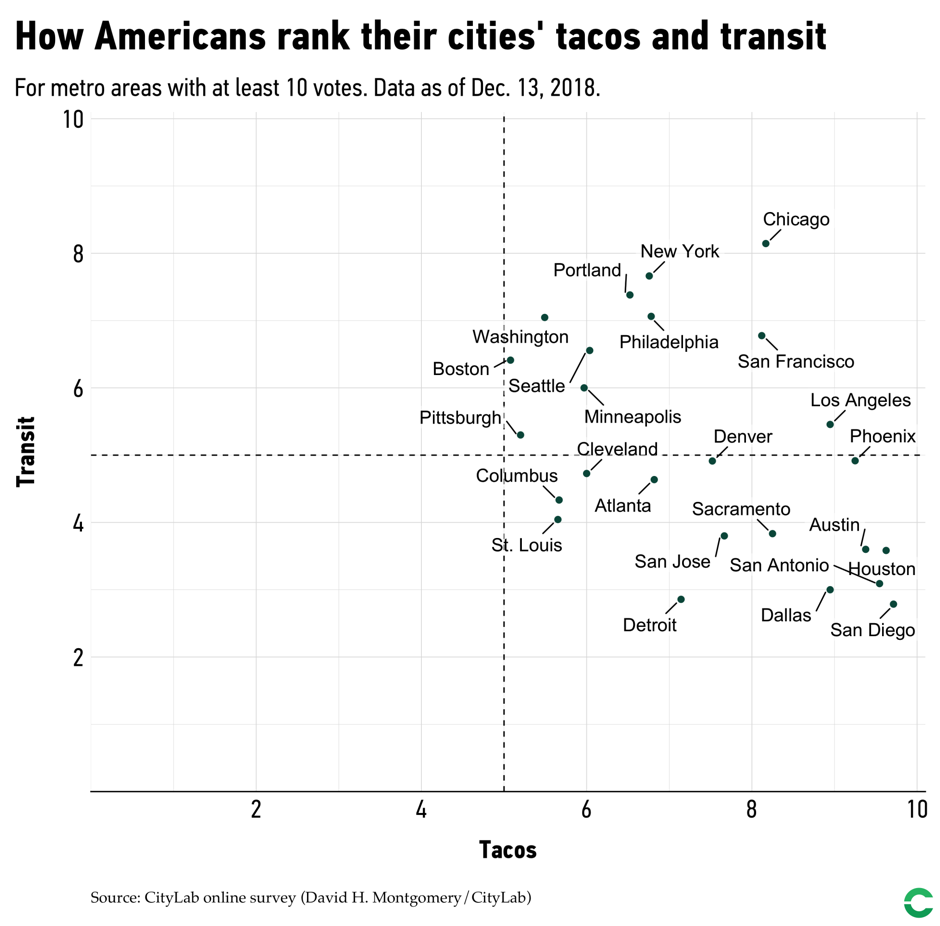
- How Americans rank their cities' tacos and transit. (You can do something this simple!)
- Mountains and Money in Colorado’s Ageless Alps: A Visual Exploration of Longevity in the Mountains. (Or this complex!)
- Training Kit has many more examples, and a process to help you find ideas.
- Max Woolf: GitHub Pages, Jekyll. Image + short description per project. You don’t need so many projects. He moved from QA Engineer to Data Scientist, without going back to school.
- Sara Simon: GitHub Pages. Former bootcamp student. Just one page, one photo, two paragraphs, six links. Less is more!


