Assignments done during the Applied Data Science with Python course
Several pandas-related tasks - data slicing and dicing
Joining three different datasets (UN, World Bank, Sciamgo) and producing a DataFrame, analyzing it and making some basic visualizations.
Plot: Country renewable energy ratio (UN) vs its rank (Sciamgo) and GDP (World Bank)

Hypothesis testing - Do university towns perform better during recession? Joining datasets, making a hypothesis and testing it.
Plot: GDP per quarter 2007-2010 - marking the recession start, bottom and end

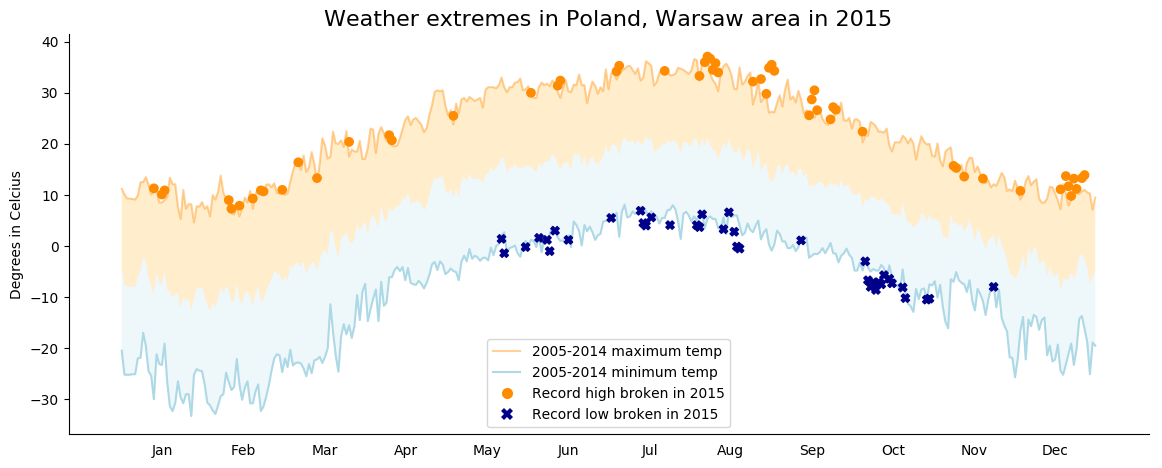
Pulling the data from weather stations around a particular area (Warsaw, Mazovia, Poland) and checking for decade-high record extremes in 2015
Plot: Max and min daily temperatures in 2005-2014 versus weather extremes (record highs and record lows) in 2015
Understanding distributions through sampling
Plot: different distributions - approximations by number of bins

Adding interactivity to the plot.
Plot: clickable barplot that is redrawn depending on the mouseclick-indicated threshold, based on the level of confidence.

Becoming an Independent Data Scientist
Plot: Sports trends in Poland in 2002-2016


