Git Product home page Git Product logo

flowchart-fun's Introduction

Flowchart Fun

Flowchart Fun is a webapp for quickly generating flowcharts from text. With a fast and intuitive workflow, you can visualize your ideas and plans in minutes.

screenshot

📝 Example

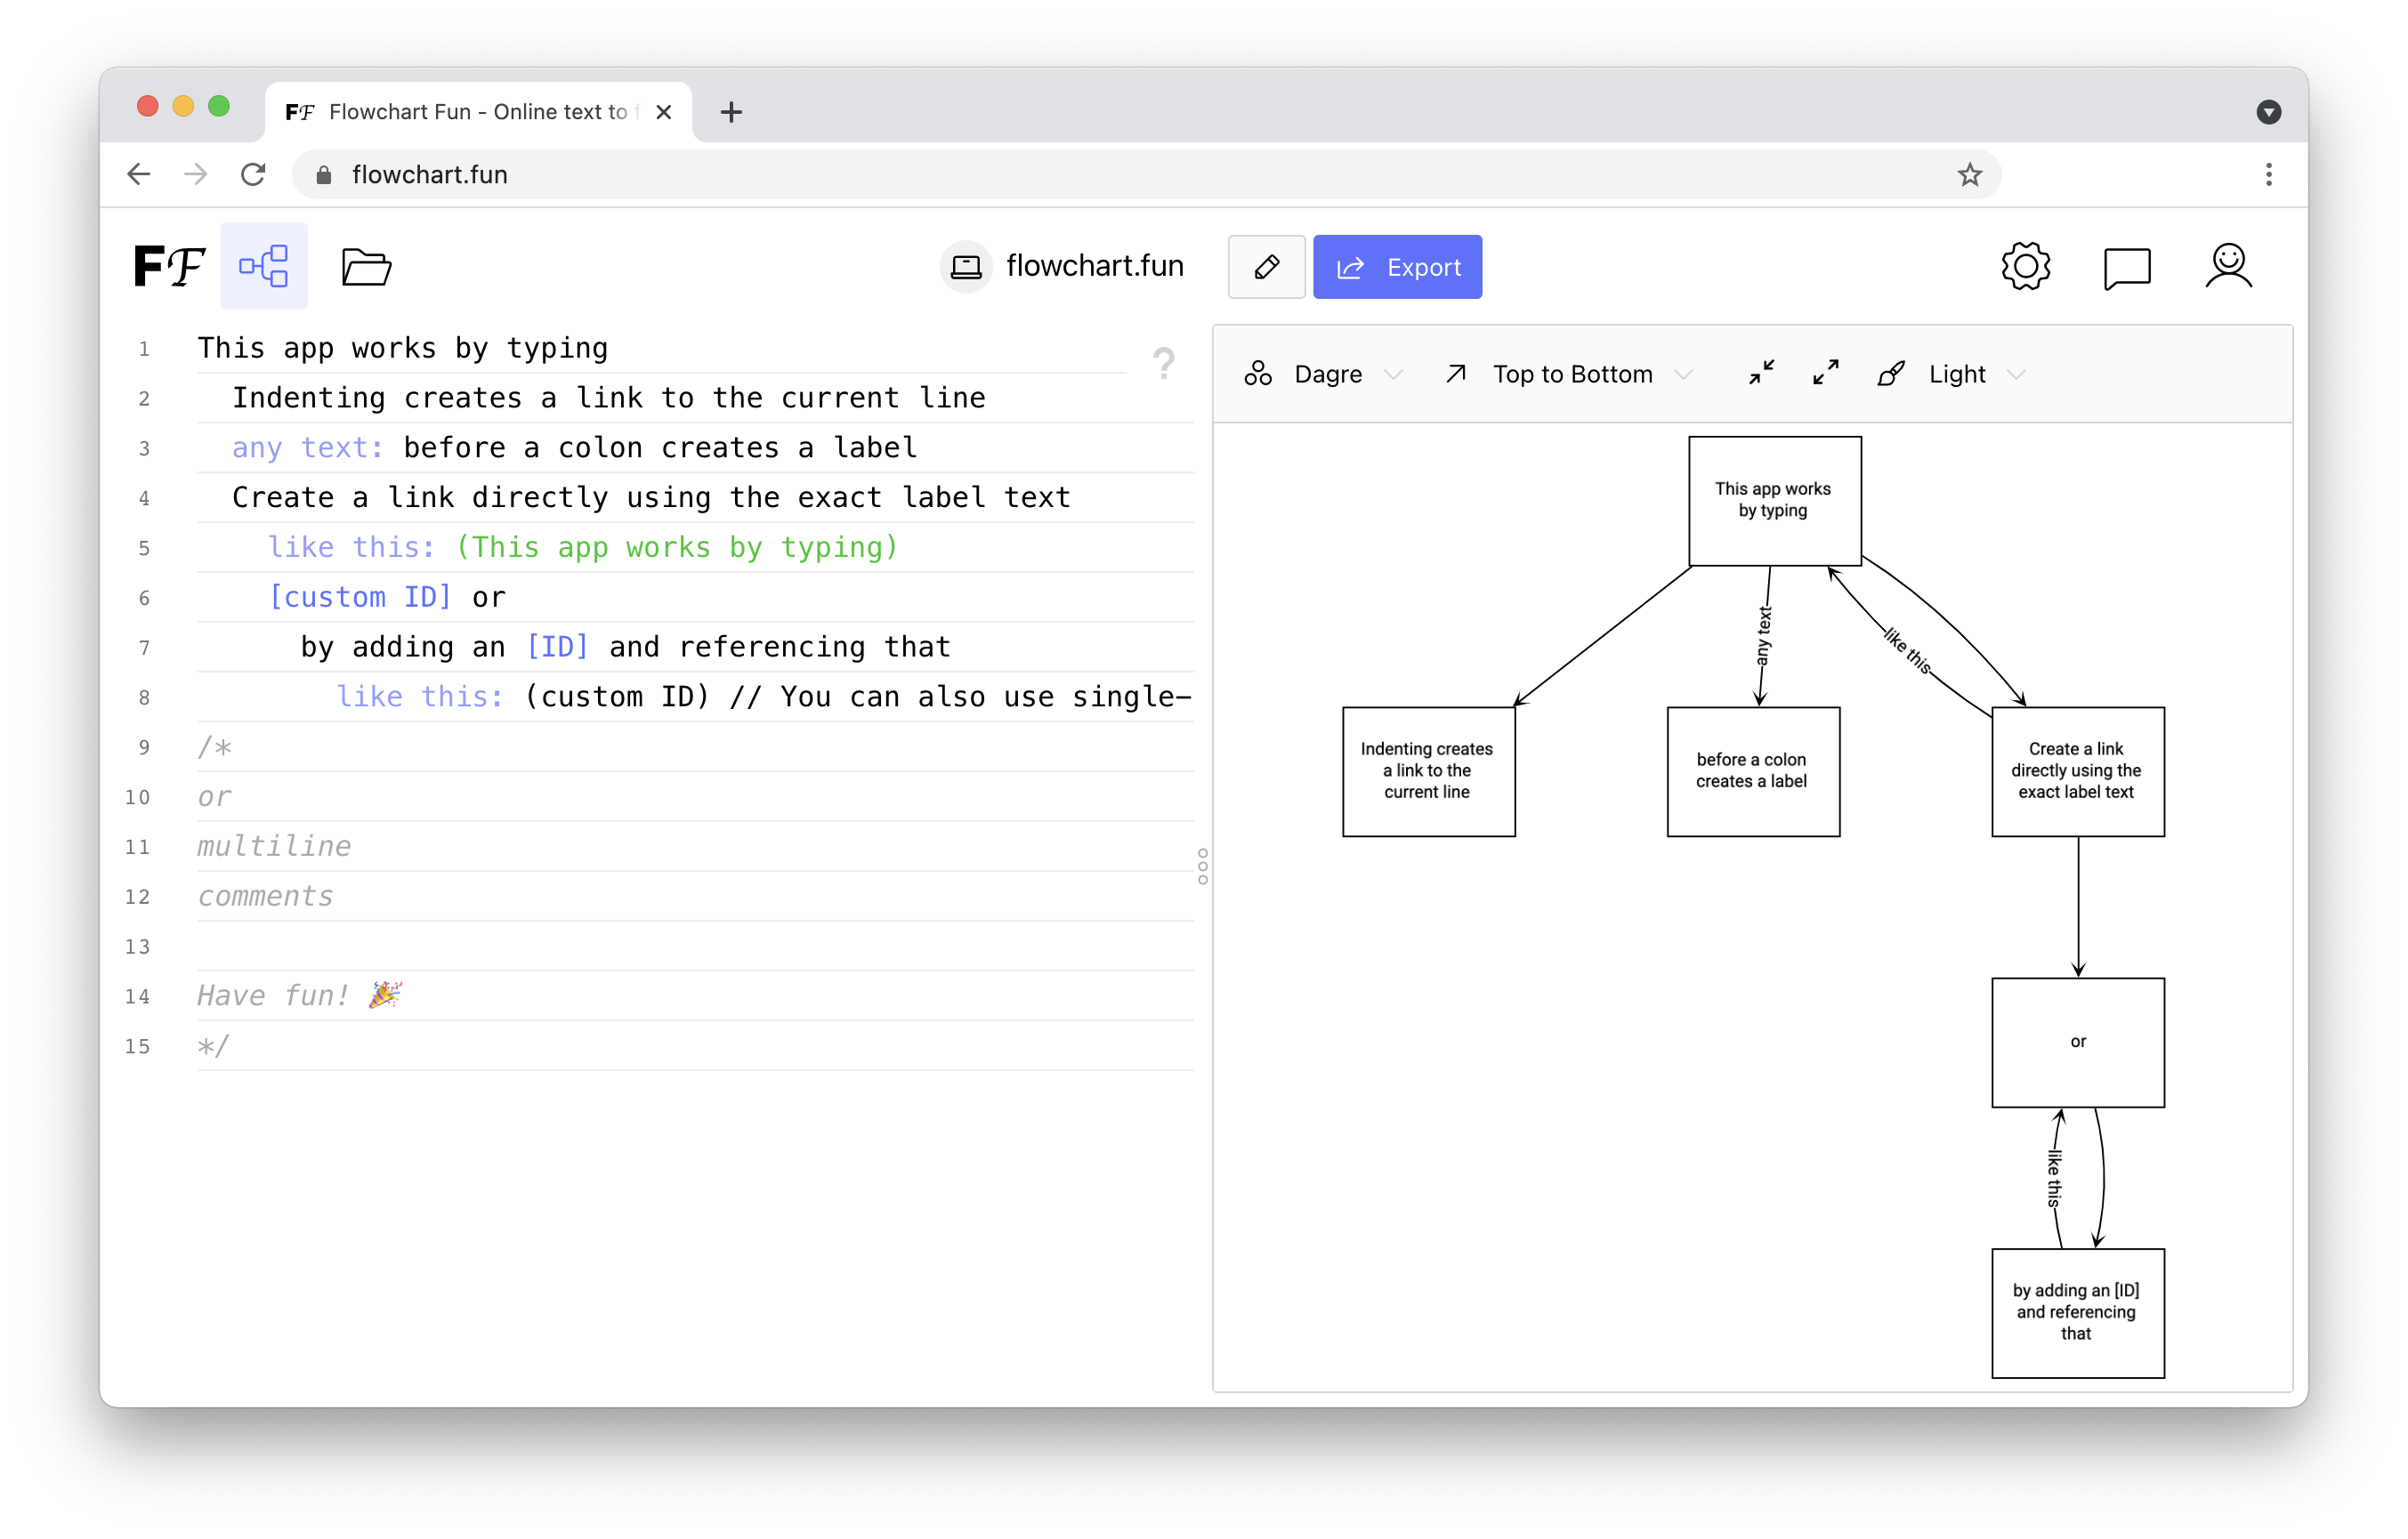
For an example of how Flowchart Fun works, take the following input:

Node A
  goes to: Node B
  and: Node C
    goes back to: (Node A)

You can generate this flowchart with just a few clicks:

example flowchart

🛠️ Development

Flowchart Fun is built with React and cytoscape.js.

💡 Prerequisites

If you plan on developing the premium features, you will need accounts on Vercel, Supabase, Stripe and Sendgrid.

🚀 Getting Started

  1. Clone the repository
  2. Copy .env.example to .env and add env variables
  3. pnpm install and vercel dev

🔒 To run with login features:

vercel dev

Note: You will need to create a Vercel account and install the CLI to run the app locally. To deploy the app, you will need a Pro Vercel account because it uses more than 12 serverless functions.

⚙️ To run without login features:

pnpm dev

🌐 Translations

We welcome anyone interested in helping us add translations to Flowchart Fun. Translations can be added to the .po files located in /app/src/locales/[language]/messages.po. After adding translations, please run pnpm -F app compile. We would appreciate your help in making Flowchart Fun accessible in even more languages!

💬 Interested in Adding a Language?

Let us know about your plans in the Discord, and we'd be glad to lend a helping hand.

🧪 Tests

To ensure quality and accuracy, Flowchart Fun employs Jest for unit testing and Playwright for e2e testing.

Unit Tests

pnpm -F app test

E2E Tests

pnpm -F app e2e

🔍 Analyzing the Bundle

pnpm -F app build && pnpm -F app analyze

🤝 Contributing

If you're interested in contributing, we'd love to have your help with the underlying syntax parser - Graph Selector. Our community welcomes all contributions, big or small!

To get started, please fork the dev branch and start developing and testing your feature. If you have any questions, don't hesitate to join the discussion on Discord. We're always happy to help and answer any questions you may have.

flowchart-fun's People

Contributors

andersmandersen avatar arrayjam avatar coffidev avatar heypano avatar hmu332233 avatar rick-stanley avatar rickstanley avatar rob-gordon avatar trasherdk avatar

Stargazers

 avatar  avatar  avatar  avatar  avatar  avatar  avatar  avatar  avatar  avatar  avatar  avatar  avatar  avatar  avatar  avatar  avatar  avatar  avatar  avatar  avatar  avatar  avatar  avatar  avatar  avatar  avatar  avatar  avatar  avatar  avatar  avatar  avatar  avatar  avatar  avatar  avatar  avatar  avatar  avatar  avatar  avatar  avatar  avatar  avatar  avatar  avatar  avatar  avatar  avatar  avatar  avatar  avatar  avatar  avatar  avatar  avatar  avatar  avatar  avatar  avatar  avatar  avatar  avatar  avatar  avatar  avatar  avatar  avatar  avatar  avatar  avatar  avatar  avatar  avatar  avatar  avatar  avatar  avatar  avatar  avatar  avatar  avatar  avatar  avatar  avatar  avatar  avatar  avatar  avatar  avatar  avatar  avatar  avatar  avatar  avatar  avatar  avatar  avatar  avatar

Watchers

 avatar  avatar  avatar  avatar  avatar  avatar  avatar  avatar  avatar  avatar  avatar  avatar  avatar  avatar  avatar  avatar  avatar  avatar  avatar  avatar  avatar  avatar  avatar  avatar  avatar  avatar  avatar  avatar  avatar  avatar  avatar  avatar  avatar  avatar  avatar

flowchart-fun's Issues

HTTP ERROR 414

I tried to share a long flowchart I had created but it shows a 414 HTTP Error. I know that probably this issue is related with the server instead of properly being a issue with flowchart-fun.

I though a way to solve this error would be:

  1. To use the Lempel–Ziv–Markov chain algorithm to encode the shareable URL as the same way itty-bitty uses.
  2. Change the hosting provider or fix the proxy server to allow long URLs(??).

Anyways, thank's for create and maintaining this amazing tool.

Adding an order of next branch

Hi,

I'm really a big fan of this neat and fancy tool.

What would be great for me is, having a order on next branch.
Let say I have entered data below with dagre layout:

`
first

  1. Second 1
  2. Second 2
  3. Second 3
    `

Expected:
I'd like to see the Seconds in order of its number
e.g.)
first

  1. Second 1
  2. Second 2
  3. Second 3

Actual behavior:
Actually the order is random, I cannot control their order
e.g.)
first

  1. Second 3
  2. Second 1
  3. Second 2

Thanks, appreciate for all of your job

Do not render blank lines(shapes)

Blank lines should be ignored, or toggle-able to suppress.

In general blank lines help create organization which helps the user, having extra objects created because of a blank line in the left hand text area is not very user friendly.

Additionally comments should be ignored?

Screen Shot 2021-03-03 at 12 14 19 PM

Embed the program in a readable pretty deep link?

Instead of:

https://flowchart.fun/c/NoZwLghgTmC6AEAjArgSwDYBMByBTA7gEwAiAMhAHYDmyEVuAUPAA4D24AggApStVQQAtgBVWALnjwAQqjABhdK2Rgm8dLmgUJACnDQwASiA

Have you thought about just including the url encoded contensts?

https://jtree.treenotation.org/sandbox/#tree%0A%20%5Bstart%5D%20buildNew2DLanguage%0A%20%20postAProgramTo%3A%20%20BitClout%0A%20%20%20learn%3A%20(start)

A related lib: https://github.com/breck7/patch

Feature: Comments

Be able to comment out a single line or block.

Examples

// Production
User
  Load Balancer
    Webserver
      Database

"""
Development Environment
"""
User
  Webserver
    Database

For me this would be useful for noting down extra details that come up during collabourative brainstorming sessions.

A future idea would be to optionally render the comment text in the SVG nearby the child node.

PS: Great tool!

Bug?: Downloading SVG reflows the graph

Repro: Create a simple graph, drag a node to a new position, and download the SVG. The node will return to its original position.
Expected: No change to the graph from downloading the SVG.

My "workflow" (if you can really call it that) with this app so far has been

  1. write out the graph description -> 2. drag boxes around so that everything looks nice -> 3. download an SVG.

It makes sense to me that adding new text reflows the graph, no obvious solution to that problem, but it would be nice if downloading an SVG didn't reset everything.

Only kind of related, but I've noticed sometimes the download SVG button disappears and necessitates a page refresh to get it back. I'm not really sure what that's about. If I can figure out how to reproduce it reliably I'll open an issue.

Feature - add tags to nodes

Only linking via the line numbers is problematic, because one has to readjust all the numbers again if a line is added to the middle. If we have a tag for each node, then we can link by using these tags and that would eliminate the line number sliding problem

Graph disappears after inserting a space before code line

To recreate:

  • open new instance of app
  • Add a single space on line 7, just before "lines have (...)"
  • Refresh page (Ctrl+R)
    Chart vanishes.

I think storing chart state between separate sessions might be troublesome, but that's a topic for another discussion.

[Show case & suggestion]

Show case , built Wu xing relationship graph.

image

image

Suggestion:

Why we need type twice the same words, such as, [Wood]Wood ??

Is it possible only type 1 time words, like backlink [[ ]] ?

image

it looks like more simple, right ?

When opening a new tab, the app presents the same view.

Problem:
I opened a new tab because I wanted to have the sample instructions in one window while I played with the app in the other. When I did this, it duplicated my view in both tabs. Changes in one tab affected the other.

Expected Result:
Duplicate tabs running the app should be independent of each other.

Preconditions:

  • As Of Commit: 33dca86
  • Device: BOXX Desktop
  • OS: Windows 10 Enterprise v2004
  • Browser: Firefox
  • Reproducibility: 100%

Steps to Reproduce:

  1. Navigate to https://flowchart.fun/.
  2. Right click the resultant tab.
  3. Click "duplicate tab"
  4. Make changes in the original tab.
  5. Observe to see if those changes are reflected in the new tab.

Notes:
This issue also manifests if you open a new window or tab without the "duplicate tab" option and navigate to https://flowchart.fun/

This app is awesome! I have been looking for something like this for years! Thanks!

Unable to run source code

Have been using flowchart.fun for that last couple of weeks. But I'm missing a feature to export directly to JPG and PNG.

I wanted to create my own implementation and submit it as a PR, if it's in the interrest of the owner.

But I'm having issue with running the source code. I get errors on the external module "@tone-row/slang".
For example within app/src/App.tsx it can't find Box and Type within "@tone-row/slang". Seems like that can be fixed by changing to "Box Component".

But I'm hitting a rock on Graph.tsx, it's importing layout from "@tone-row/slang". And that is no where to be found.

I know this issue is a bit misplaced since it's properly a thing with "@tone-row/slang". But I think yarn/npm is downloading the wrong version.

package.json

"@tone-row/slang": "^1.2.30",

Can someone help getting the source code to run.

Different shapes

Very, very cool, thanks for making this!

Part of the appeal is its simplicity, of course, but: any plans to extend with a handful of different typical shapes (eg. oval, parallelogram, diamond)?

Saving/exporting/importing/tabs/bookmarks?

Some features that would be super useful:

  • entire chart save in query string for easy bookmarking?
  • allow exporting chart data for savings or later importing (json/csv/whatever)?
  • Save chart data somewhere like localstorage and add tabs at the top to work on multiple charts at once?

Support for multiple charts with headings

It would be useful to be able to render multiple charts, separated by blank lines, each with its own heading.

Example:

_Scenario 1
Service 1
 connection: (3)
Service 2
 connection: (2)

_Scenario 2
Service 1
 connection: (10)
Service3
 connection: (8)

Feature: questions (decisions) are presented in diamonds

I love it :-) How about a sentence ending in a question mark (?) could be drawn as a diamond, with arrows coming from the corners (for the first three branches anyway). e.g.

Is it morning yet?
  yes: get up
  no: go back to sleep
    wake up: (1)

Text and graph updating

  1. Default text:
a
b
  edge: (a)

pAeskknxEv

Change textato c ,
Check the edge: (a) and graph text .

Result: the edge: (a) didn't change to edge: (c) , but the graph is changed to c (correct) .

I'm not sure that edge: (a) whether should be updating after the a change to c .

rGb0ni08bf

Back to Default text ,
Change edge: (a) to edge: (c)
Check graph and graph in text.

Result: b still connected a

I'm not sure in graph the b whether should be disconnected a, after change edge: (a) to edge: (c) .

Dark mode

Github, StackOverflow, and Google all have dark mode now. Can your app have it too? At the very least, @media (prefers-color-scheme: dark) { ... }, if not any toggles or anything?

Multi-line labels

Thank you a lot for this tool! It's super practical!

Is there a way to insert line breaks in the text? Say, if I have a long edge label which I'd like to split in two lines?

way to change side of parent the child goes?

is there a way to change where the child is created?

it always seems to create the child to the right of the parent. I've noticed you can drag the boxes around, but if you make a 'grandchild' from a child that was dragged to the left , the grandchild, and child automatically move to the right of the parent.

i think this is a such a great tool for easy flowcharting and maybe mindmapping too!!!

thank you, and sorry if this is easily done. im still learning.

Add ability to define node background color

I was thinking about adding an option to add a background color to a node by providing an rgb hex code with a # at the end of a line e.g. (pic below)
node label text #ffaaaa

I was also thinking about adding automatic brightness detection for the background color so that if it's > 50% it shows black text and if it's < 50% it shows whites text.

How does that sound?
We could also accept color words with two ## like node label text ##red

image

Suggestion: eliminate all sandwich delimiters

Despite the fact that >99% of programming languages use "sandwich delimiters" like quotes, brackets, parens, et cetera, I figured out they are never necessary, and it's pretty fun to get rid of them entirely:

Here are some examples: https://jtree.treenotation.org/designer/

For flowchart-fun, I suggest:

[1] Drop /* */ and replace with a "comment" block.

/*
or 
multiline 
comments

Have fun! 🎉
*/

Becomes:

comment
 or 
 multiline 
 comments
 
 Have fun! 🎉

For the 0.0001% edge case where someone wants to have a node that is just the text "comment", they can capitalize the "c" to "Comment" or switch to a different tool. Not a big deal.

For circular references, I'd maybe go with hashtags. #[int] would be the line number. ##[string] would be insert a custom node id. and #[string] would be a link to the named node.

this app works by typing
  ##linking you can link to nodes using their ID in parentheses
    like this: #1
    lines have a default ID of their line-number
      but you can also supply a custom ID in brackets
        like this: #linking

Provide a way to find the line related to a particular box

With greater amount of boxes in a chart, it gets harder to navigate through existing instructions and find the desired one. Displaying line ID somewhere in a box (maybe greyed text in a corner), or highlighting the proper line when a box is selected would be really useful.

Artifacts after leaving the app open for long period

Is there a possibility that something on the app side is infinitely accumulating storage?
After leaving the tab with the app open for a while, I was surprised to see lots of artifacts on the graph.
Refreshing the page didn't work, copy-pasting code from the clear version didn't work either, I had to restart the browser, and it had finally helped.

flowchart

Add resizer

I'd like to resize the divider in the middle.

Support inserting a box in the middle of existing flowchart

Currently if I wanted to insert a box in the middle, I would have to tediously insert a space in all subsequent rows. I believe it could be solved by allowing multiline selection or creating a functionality which would traverse all derived boxes and insert it automatically.
image

Add a "Reset" / "Clear Chart" button

It would be helpful to have a reset button that would reset the chart to the default "fresh" chart with the syntax examples. The first thing I did was remove some of the examples while playing around before realizing that I couldn't find out how to do more stuff without finding the github page.

Many nodes going to a single box

Hi, congrats for your tool!

In order to do something like "many nodes go to 1 node":

image

is there a better way than doing:

A
  container
B
  (2)
C
  (2)
D
  (2)
E
  (2)

to avoid the repetition of newlines with (2)?

Incremental update?

Is it possible to incremental update the node and the connection from the text without refresh the entire graph?

Bug: Pressing tab with text selected overwrites selection & bypasses undo

Repro: enter text in the text area, select it, and press tab. Then, try using Undo to undo the change. The change will not be undoable.
Expected: Undo functions as usual.

Presumably this has something to do with how the tab functionality is implemented. Breaking undo is a bug, but I think it would be best if pressing tab with text selected indented each line of the selected text (trying this is how I discovered the issue).

Object pinning

Scenario: Assume you draw out a large arbitrary number of boxes and connections. After initial keyboard bashing you clean up the automatically rendered output by dragging them into a better layout which makes more sense to you as a user than the computer. Except after 2 hours of work you realize you need to add one last shape and connection. Doing so causes the push strength to recalculate and all your hard work organizing disappear. You have to start all over.

Ideal solution: a toggle that freezes the existing shapes in place, new shapes would at best be placed and pushed away by previous shapes without the new shape pushing on those older "Frozen" shapes.

Can the link ID to be unchanged or auto "+1"?

Everytime insert a new line, the Link ID will be changed, and then the link id is wrong . we have to modify the all Link ID.

Is it possible there's a unchanged link ID or auto "+1", after insert a new line ?

Thank you .

Feature - Include the original code/text in the SVG

The idea is to be able to track the code/text that was used to generate the SVG without needing a separate file for the original code/text. It could a simple XML comment or some better way to track data.

We could even go a step further to be able to load existing SVG (created by flowchart-fun) for quick edits later on if the original code/text was lost. E.g. somebody who attached the SVG on a wiki or something without the original code.

Automatically adjust indents on a new line to match the previous one

When creating/editing a chart, most of the time is spent on creating new paths that derive from the last box created, or branching the previous one. To make that easier, after hitting "enter" the newly created line should automatically insert matching indents, sort of in the same way that WorkFlowy does . Then the text could be inserted almost immediately, without having to smash space key several times prior to that

Self-building

Can I build it by myself
Can you provide tutorials or Dockerfile?

Radial layouts

First of all, what an awesome tool! Thank you for making this!

Second, would love the ability to toggle between various layouts. Specifically:

  • Radial (I like making mind maps and prefer to visualize them this way)
  • Horizontal hierarchical (current default)
  • Vertical hierarchical (sounds like this has already been requested in #81)

Recommend Projects

  • React photo React

    A declarative, efficient, and flexible JavaScript library for building user interfaces.

  • Vue.js photo Vue.js

    🖖 Vue.js is a progressive, incrementally-adoptable JavaScript framework for building UI on the web.

  • Typescript photo Typescript

    TypeScript is a superset of JavaScript that compiles to clean JavaScript output.

  • TensorFlow photo TensorFlow

    An Open Source Machine Learning Framework for Everyone

  • Django photo Django

    The Web framework for perfectionists with deadlines.

  • D3 photo D3

    Bring data to life with SVG, Canvas and HTML. 📊📈🎉

Recommend Topics

  • javascript

    JavaScript (JS) is a lightweight interpreted programming language with first-class functions.

  • web

    Some thing interesting about web. New door for the world.

  • server

    A server is a program made to process requests and deliver data to clients.

  • Machine learning

    Machine learning is a way of modeling and interpreting data that allows a piece of software to respond intelligently.

  • Game

    Some thing interesting about game, make everyone happy.

Recommend Org

  • Facebook photo Facebook

    We are working to build community through open source technology. NB: members must have two-factor auth.

  • Microsoft photo Microsoft

    Open source projects and samples from Microsoft.

  • Google photo Google

    Google ❤️ Open Source for everyone.

  • D3 photo D3

    Data-Driven Documents codes.