Data Science Case Study / Think Tank
Context: Imagine you are a Data Scientist in the Supply Chain Delivery Assurance Department of BMW Group. Before and during new production of model cars, supplier audits are conducted by audit experts, and it is an important process to ensure the reliability of suppliers. Selected suppliers must go through the audit process before they are fully entrusted to deliver parts for BMW production processes. You are responsible for predicting the supplier audit results so that the audit experts can foresee the qualification of certain suppliers and know if there will be enough qualified suppliers in the future.
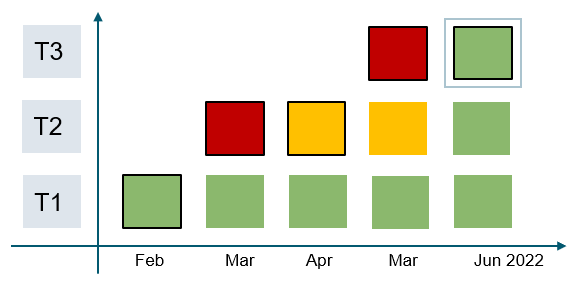
Supplier Audit Process: T1, T2, T3 (sequentially) represent the different stages of the production, and the result corresponds to the most recent stage.
Colors are used by the audit experts to easily show the qualification of a supplier:
Green indicates that the suppliers are qualified in the current audit process.
Yellow means that they receive warnings.
Red means that the suppliers are disqualified.
Example:
An example of a single supplier and a single derivative (the supplier is providing parts for specific types of model car) is shown below for their audit period between February and June 2022. Throughout the stages of their supplier audit process from T1 to T3, the supplier received some qualifications. This supplier was added to T2 after one month of the start of T1, and was added to T3 after another two months. Note that this timeline does not necessarily apply for other suppliers and a supplier does not have to achieve green in one stage to be transferred to the next stage, this is based on the planning of audits from experts. This one supplier received a green qualification in their latest stage of their latest qualification, therefore the latest result is green. Your task is to predict the result which is the latest qualification of certain supplier and certain derivative in their latest audit stage.
| Supplier Name | Derivative Name | Recent Month | T1 Color | T2 Color | T3 Color | Result |
|---|---|---|---|---|---|---|
| S1 | D1 | Feb 2022 | Green | - | - | Green |
| S1 | D1 | Mar 2022 | Green | Red | - | Red |
| S1 | D1 | Apr 2022 | Green | Yellow | - | Yellow |
| S1 | D1 | May 2022 | Green | Yellow | Red | Red |
| S1 | D1 | Jun 2022 | Green | Green | Green | Green |
Two sample datasets are available for this case study:
-
Audit History: Dataset of supplier audit histories.
* SupplierId: The supplier who is involved in the audit process. * RecentMonth: Update of result for the month. * RecentTimeStamp: The time when the audit is conducted. * DerivativeName: The type of model car the supplier is providing parts for. One supplier can supply for different types of cars. * DerivativeRegion: The region where the derivative is in production. * ProductionLine: The name code of the production line. * T1Color: The color shows the qualification of the supplier if they are in stage T1. * T2Color: The color shows the qualification of the supplier if they are in stage T2. * T3Color: The color shows the qualification of the supplier if they are in stage T3. * Result: The color of the current result. -
Supplier Performance KPIs: Dataset for key supplier performance indicators. The audit experts take KPIs into account when selecting suppliers for audits and giving qualification.
  * SupplierId: The supplier who has records of wrong deliveries, backlogs or LPKM score.

  * Amount_WD_3M, Amount_WD_6M, Amount_WD_12M: Wrong deliveries happen when suppliers send wrong material parts. These features are the amount of wrong deliveries in the last 3 months, 6 months or 12 months for each supplier.

  * Amount_Backlogs_3M, Amount_Backlogs_6M, Amount_Backlogs_12M: Backlogs happen when suppliers cannot deliver parts on time. These features are the amount of backlogs in the last 3 months, 6 months or 12 months for each supplier.

  * 12_Month_LPKM: LPKM score is a 5-star rating of the supplier regarding the KPIs for the last 12 months (the higher the better).

  * BadSupplierIndicator: Indicator of whether the supplier has bad performance before.
- Explore the datasets and write down your assumptions.
- Preprocess the data. Define the target and predictor variables. List them.
- Explain why did you select those predictors, what is your hypothesis.
- Predict the latest results (green, yellow or red) of the supplier audit process, for all the (supplier, derivative) pairs. Note that T1/T2/T3 shouldn't be used directly as predictors.
- Show how did you select the best model.
- Give business recommendations based on your model.
- Describe how would you maintain the model in the future and how could you improve it.
Send us your solution either in Python or R.
After submitting your case study, you will be presenting your solution to a small group of both technical and non-technical people. Make sure to keep your explanations short and simple. We will ask the techinal questions when needed. Hint: Visulization can be helpful to show your analysis and results.
