Git Product home page Git Product logo

thinkingmachines / ph-poverty-mapping Goto Github PK

View Code? Open in Web Editor NEW
76.0 14.0 31.0 66.4 MB

Mapping Philippine Poverty using Machine Learning, Satellite Imagery, and Crowd-sourced Geospatial Information

Home Page: https://stories.thinkingmachin.es/philippines-most-vulnerable-communities/

License: MIT License

Makefile 0.01% Python 1.08% Jupyter Notebook 98.91%
poverty-prediction poverty-mapping unicef satellite-imagery

ph-poverty-mapping's Introduction

This repo is no longer maintained. Checkout our latest poverty mapping repo here!

Setup | Code Organization | Data Sources | Models | Key Results | Acknowledgements

Philippine Poverty Mapping

This repository accompanies our research work, "Mapping Philippine Poverty using Machine Learning, Satellite Imagery, and Crowd-sourced Geospatial Information".

The goal of this project is to provide a means for faster, cheaper, and more granular estimation of poverty measures in the Philippines using machine learning, satellite imagery, and open geospatial data.

pampanga map

Setup

To get started, run the jupyter notebooks in notebooks/ in order. Note that to run the notebooks, all dependencies must be installed. We provided a Makefile to accomplish this task:

make venv
make build

This creates a virtual environment, venv, and installs all dependencies found in requirements.txt. In order to run the notebooks inside venv, execute the following command:

ipython kernel install --user --name=venv

Notable dependencies include:

  • matplotlib==3.0.2
  • seaborn==0.9.0
  • numpy==1.16.0
  • pandas==0.24.0
  • torchsummary==1.5.1
  • torchvision==0.2.1
  • tqdm==4.30.0

Code Organization

This repository is divided into three main parts:

  • notebooks/: contains all Jupyter notebooks for different wealth prediction models.
  • utils/: contains utility methods for loading datasets, building model, and performing training routines.
  • src/: contains the transfer learning training script.

It is possible to follow our experiments and reproduce the models we've built by going through the notebooks one-by-one. For model training, we leveraged a Google Compute Engine (GCE) instance with 16 vCPUs and 60 GB of memory (n1-standard-16) and an NVIDIA Tesla P100 GPU.

Downloading Datasets

Demographic and Health Survey (DHS)

We used the poverty indicators in the 2017 Philippine Demographic and Health Survey as a measure of ground-truth for socioeconomic indicators. The survey is conducted every 3 to 5 years, and contains nationally representative information on different indicators across the country.

Due to data access agreements, users need to independently download data files from the Demographic and Health Survey Website. This may require you to create an account and fill out a Data User Agreement form.

Once downloaded, copy and unzip the file in the /data directory. The notebook /notebooks/00_dhs_prep.ipynb will walk you through how to prepare the dataset for modeling.

Google Static Maps

We used the Google Static Maps API to download 400x400 px zoom 17 satellite images. To download satellite images and generate training/validation sets, run the following script in the src/ directory:

python data_download.py Note that this script downloads 134,540 satellite images from Google Static Maps and may incur costs. See this page for more information on Maps Static API Usage and Billing.

To download satellite images and generate training/validation sets, run the following script in src/:

python data_download.py

Training the Model

To train the nighttime lights transfer learning model, run the following script in src/:

python train.py

Usage is as follows:

usage: train.py [-h] [--batch-size N] [--lr LR] [--epochs N] [--factor N]
                [--patience N] [--data-dir S] [--model-best-dir S]
                [--checkpoint-dir S]
Philippine Poverty Prediction
optional arguments:
  -h, --help          show this help message and exit
  --batch-size N      input batch size for training (default: 32)
  --lr LR             learning rate (default: 1e-6)
  --epochs N          number of epochs to train (default: 100)
  --factor N          factor to reduce learning rate by on pleateau (default:
                      0.1)
  --patience N        number of iterations before reducing lr (default: 10)
  --data-dir S        data directory (default: "../data/images/")
  --model-best-dir S  best model path (default: "../models/model.pt")
  --checkpoint-dir S  model directory (default: "../models/")

Data Sources

Models

We developed wealth prediction models using different data sources. You can follow-through our analysis by looking at the notebooks in the notebooks/ directory.

  • Nighttime Lights Transfer Learning Model (notebooks/03_transfer_model.ipynb): we used a transfer learning approach proposed by Xie et al and Jean et al. The main assumption here is that nighttime lights act as a good proxy for economic activity. We started with a Convolutional Neural Network (CNN) pre-trained on ImageNet, and used the feature embeddings as input into a ridge regression model.
  • Nighttime Lights Statistics Model (notebooks/01_lights_eda.ipynb, notebooks/03_lights_model.ipynb): in this model, we generated nighttime light features consisting of summary statistics and histogram-based features. We then compared the performance of three different machine learning algorithms: ridge regression, random forest regressor, and gradient boosting method (XGBoost).
  • OpenStreetMaps (OSM) Model (notebooks/04_osm_model.ipynb): we extracted three types of OSM features, roads, buildings, and points-of-interests (POIs) within a 5-km radius for rural areas and 2-km radius for urban areas. We then trained a random forest regressor on these features.
  • OpenStreetMaps (OSM) + Nighttime Lights (NTL) (notebooks/02_lights_eda.ipynb, notebooks/04_osm_model.ipynb): we also trained a random forest model combining OSM data and nighttime lights-derived features as input.

Citation

Use this bibtex to cite this repository:

@misc{ph_poverty_prediction_2018,
  title={Mapping Poverty in the Philippines Using Machine Learning, Satellite Imagery, and Crowd-sourced Geospatial Information},
  author={Tingzon, Isabelle and Orden, Ardie and Sy, Stephanie and Sekara, Vedran and Weber, Ingmar and Fatehkia, Masoomali and Herranz, Manuel Garcia and Kim, Dohyung},
  year={2018},
  publisher={Github},
  journal={GitHub repository},
  howpublished={\url{https://github.com/thinkingmachines/ph-poverty-mapping}},
}

Acknowledgments

This work was supported by the UNICEF Innovation Fund.

ph-poverty-mapping's People

Contributors

ardieorden avatar ibtingzon425 avatar issa-tingzon avatar jtmiclat avatar ljvmiranda921 avatar marksteve avatar tm-ardie-orden avatar

Stargazers

 avatar  avatar  avatar  avatar  avatar  avatar  avatar  avatar  avatar  avatar  avatar  avatar  avatar  avatar  avatar  avatar  avatar  avatar  avatar  avatar  avatar  avatar  avatar  avatar  avatar  avatar  avatar  avatar  avatar  avatar  avatar  avatar  avatar  avatar  avatar  avatar  avatar  avatar  avatar  avatar  avatar  avatar  avatar  avatar  avatar  avatar  avatar  avatar  avatar  avatar  avatar  avatar  avatar  avatar  avatar  avatar  avatar  avatar  avatar  avatar  avatar  avatar  avatar  avatar  avatar  avatar  avatar  avatar  avatar  avatar  avatar  avatar  avatar  avatar  avatar  avatar

Watchers

 avatar  avatar  avatar  avatar  avatar  avatar  avatar  avatar  avatar  avatar  avatar  avatar  avatar  avatar

ph-poverty-mapping's Issues

Add project scaffold

  • Add readme file
  • Add Makefile
  • Add src and tests directories
  • Add .gitignore
  • Add requirements file

Best Model

Hi @ardieorden

While running the 03_transfer_model notebook.

I am getting the following error message. How to select the Best_model.pt, Do we have to do this manually or code will do this for us.

image

Pop_sum and spatial join for nightlights.csv

Hi @ardieorden ardieorden

How you are getting the pop_sum in the nightlights file. and while performing a spatial join using (1) the layer with the longitude and latitude and (2) the buffered layer with the DHS clusters.

are you using one to one or one to many spatial join?

Thanks

boundaries CSV files

Quick question. I am trying to reproduce the work and while running the 03_transfer_model.ipynb

It is expecting the following files which seem to be missing:

dhs_provinces_file = data_dir+'dhs_provinces.csv'
dhs_regions_file = data_dir+'dhs_regions.csv'

I don't see where they were created. Should they have been generated in the preparation? If so It could be that the original DHS data mentioned in the 00_dhs_prep.ipynb (PHHR70DT/PHHR70FL.DTA, PHHR70DT/PHHR70FL.DO) isn't available instead I was able to find these :

dhs_file = dhs_zip + 'PHHR71DT/PHHR71FL.DTA'
dhs_dict_file = dhs_zip + 'PHHR71DT/PHHR71FL.DO'

Any pointers would be greatly appreciated! Thanks again for publishing your work and merry christmas! ๐ŸŽ„ ๐ŸŽ…

Regarding 03_lights_model

Can you let me know for the ntl_summary_stats_file is same file name ph_ntl_ntl_points.csv or another file which is not uploaded in the git.

I got confused with the code on

Define feature columns

feature_cols = ['cov', 'kurtosis', 'max', 'mean', 'median', 'min', 'skewness', 'std']

because in the Correlations section code
I'm getting an error -> " KeyError: 'cov' "

Issue on 02_lights_eda.ipynb

I have encountered a few issues while working on the notebook file.

In Night Time Lights (NTL) Dataset EDA Section
-> # Get sum of population per cluster Cell

There is one error in which nightlights_unstack.csv file doesn't create with a pop_sum column where it's giving 'no object found' error, while in the nightlights.csv has a pop_sum column

Need suggestion whether to use unstack file or nightlight file for population clustering.

In Load DHS Dataset Section
-> merging nightlights and indicators data showing this error
DHS Merge Issue

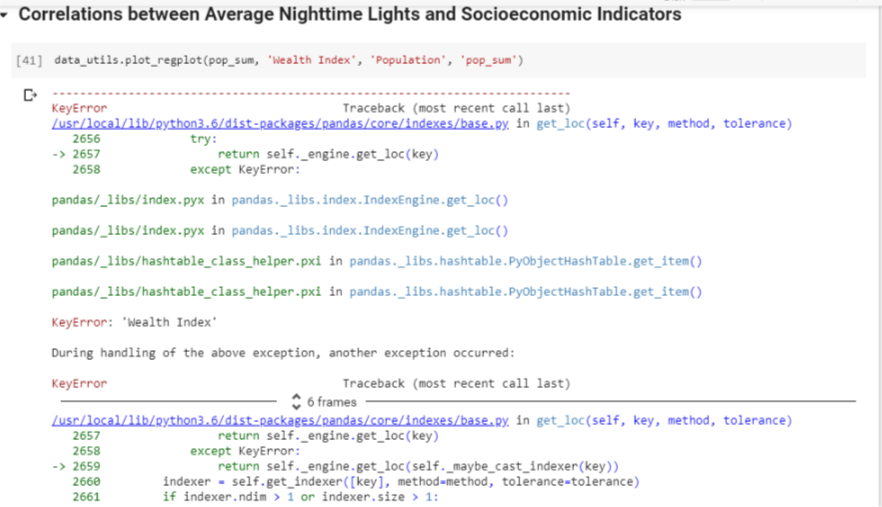
In Correlations between Average Nighttime Lights and Socioeconomic Indicators Section
-> Data is not loading properly
Coorelation Issue

In Balancing Nighttime Lights Intensity Levels
-> It requires report.csv files.

Please let me know the following solutions on this issue.
I request you to provide data files as there are lots of missing data while executing the program. In other case generating the file, it's getting little confusion on plotting data properly or data getting mismatch for further analysis its taking lots of time for getting into the processing.
So if possible can share the data files to [email protected] till osm model.
Further would share research work which would be helpful for both.

dhs csv data

In the first notebook, I saw that you have changed many of the duplicated data of Time to get to water source minutes from 996 to 0. May I ask that what was the reason for this change?

Thanks from now.

Update README

Add the following:

  • Setup instructions (c/o @ljvmiranda921 )
  • Some description on the models and results (c/o @ibtingzon )

Note: don't forget to link on our blog post!

dhs_regions

Hi

I hope you are doing well.

Can you please let me know how you are getting the dhs_regions.csv file?

Thanks

Transformation of VIIRS DNB data to .csv file ('nightlights.csv')

Dear ph-pverty-mappers! How did you manage to transform the VIIRS DNB data to the .csv file 'nightlights.csv'? I would like to apply your approach to different countries. Therefore, I need to generate a 'nightlights.csv' equivalent for these other countries.
I am still downloading the VIIRS data, but it seems to be image data only. How did you manage to extract longitude, altitude and nighttime light intensity information from this data?
Thanks in advance fro your answer!

00_dhs_prep.ipynb Code error

Hi @ardieorden ardieorden

For the following notebook 00_dhs_prep.ipynb
data = dhs[[
'Cluster number',
'Wealth index factor score combined (5 decimals)',
'Education completed in single years',
'Has electricity'
]].groupby('Cluster number').mean()

data['Time to get to water source (minutes)'] = dhs[[
'Cluster number',
'Time to get to water source (minutes)'
]].replace(996, 0).groupby('Cluster number').median()

data.columns = [[
'Wealth Index',
'Education completed (years)',
'Access to electricity',
'Access to water (minutes)'
]]

print('Data Dimensions: {}'.format(data.shape))
data.head(2)

For the bold part, I am getting the error message, how to resolve this, please.
image

Thanks

Recommend Projects

  • React photo React

    A declarative, efficient, and flexible JavaScript library for building user interfaces.

  • Vue.js photo Vue.js

    ๐Ÿ–– Vue.js is a progressive, incrementally-adoptable JavaScript framework for building UI on the web.

  • Typescript photo Typescript

    TypeScript is a superset of JavaScript that compiles to clean JavaScript output.

  • TensorFlow photo TensorFlow

    An Open Source Machine Learning Framework for Everyone

  • Django photo Django

    The Web framework for perfectionists with deadlines.

  • D3 photo D3

    Bring data to life with SVG, Canvas and HTML. ๐Ÿ“Š๐Ÿ“ˆ๐ŸŽ‰

Recommend Topics

  • javascript

    JavaScript (JS) is a lightweight interpreted programming language with first-class functions.

  • web

    Some thing interesting about web. New door for the world.

  • server

    A server is a program made to process requests and deliver data to clients.

  • Machine learning

    Machine learning is a way of modeling and interpreting data that allows a piece of software to respond intelligently.

  • Game

    Some thing interesting about game, make everyone happy.

Recommend Org

  • Facebook photo Facebook

    We are working to build community through open source technology. NB: members must have two-factor auth.

  • Microsoft photo Microsoft

    Open source projects and samples from Microsoft.

  • Google photo Google

    Google โค๏ธ Open Source for everyone.

  • D3 photo D3

    Data-Driven Documents codes.