
![]()
Profile your Pandas Dataframes! Autoprofiler will automatically visualize your Pandas dataframes after every execution, no extra code necessary.
Autoprofiler allows you to spend less time specifying charts and more time interacting with your data by automatically showing you profiling information like:
- Distribution of each column
- Sample values
- Summary statistics
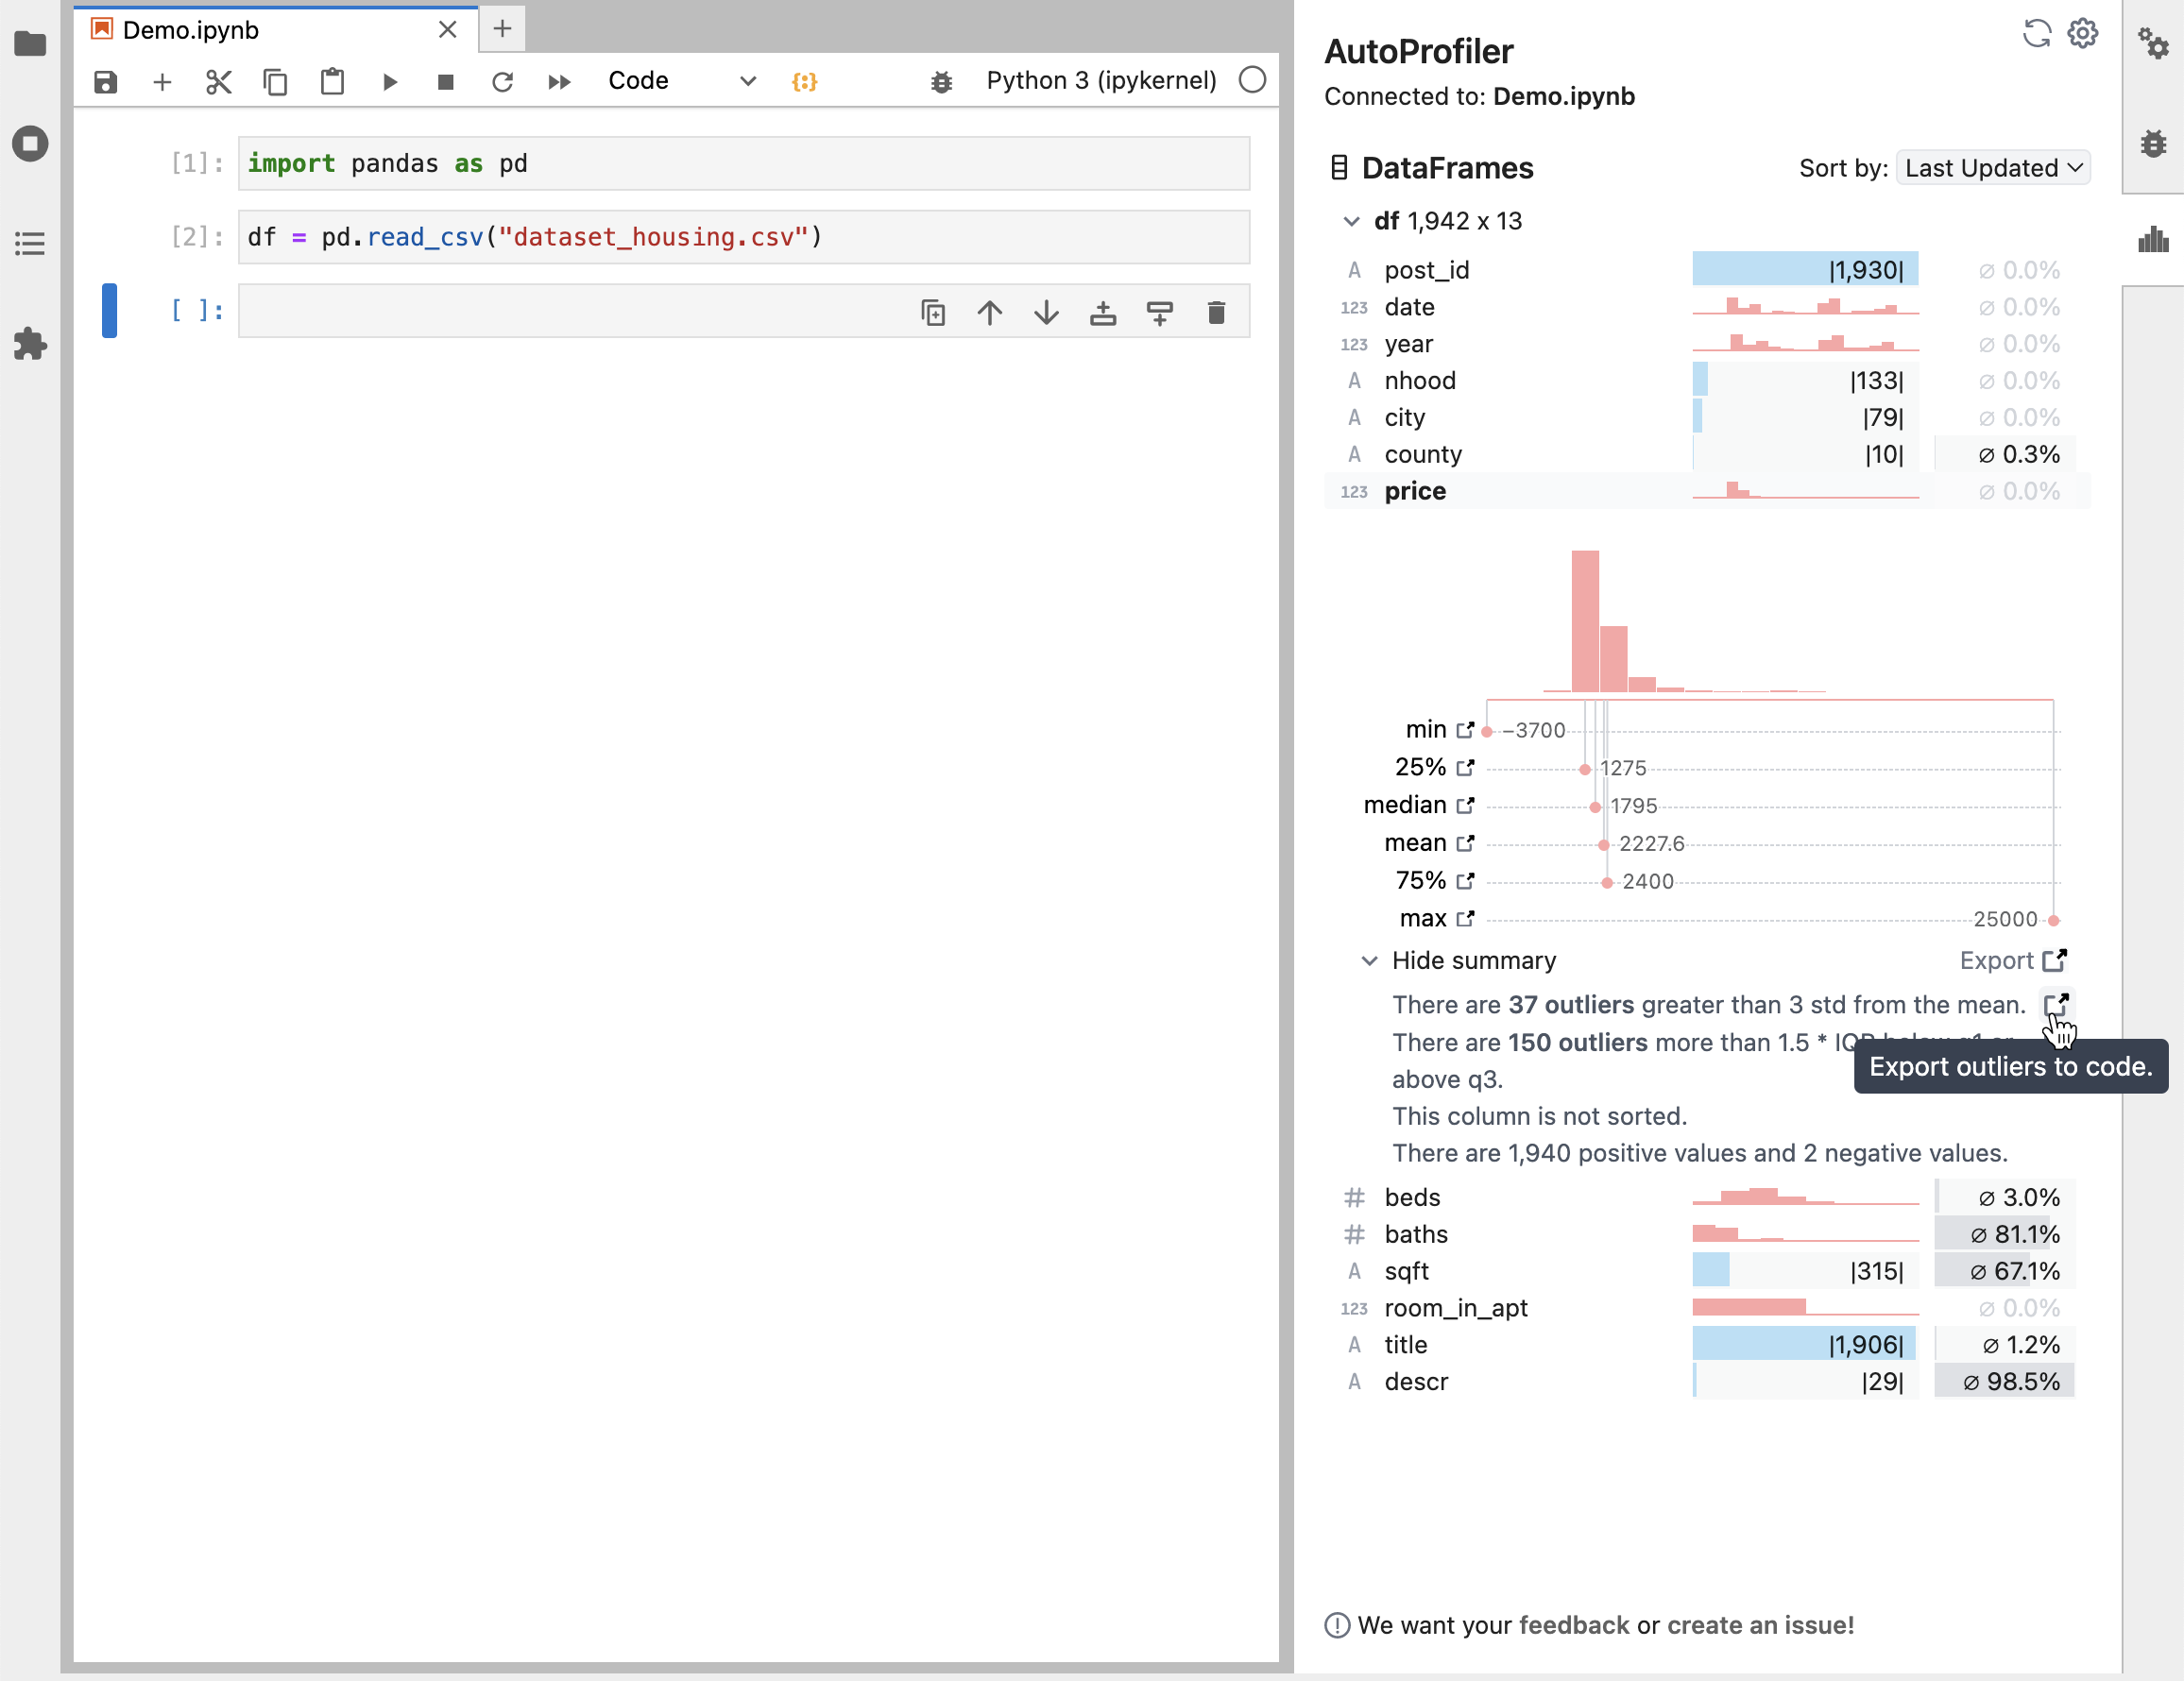
Autoprofiler reads your current Jupyter notebook and produces profiles for the Pandas Dataframes in your memory as they change.
AutoProfiler_Demo.mov
To instally locally use pip and then open a jupyter notebook and the extension will be running.
pip install -U digautoprofilerTo try out Autoprofiler in a hosted notebook, use one of the options below
| Jupyter Lite | Binder |
|---|---|
For development install instructions, see CONTRIBUTING.md.
If you're having install issues, see TROUBLESHOOTING.md.
Big thanks to the Rill Data team! Much of our profiler UI code is adapted from Rill Developer.
We would love to hear your feedback on how you are using AutoProfiler! Please fill out this form or email Will at [email protected].


