Git Product home page Git Product logo

thetarnav / solid-devtools Goto Github PK

View Code? Open in Web Editor NEW
506.0 7.0 21.0 4.86 MB

Library of developer tools, reactivity debugger & Devtools Chrome extension for visualizing SolidJS reactivity graph

Home Page: https://chrome.google.com/webstore/detail/solid-devtools/kmcfjchnmmaeeagadbhoofajiopoceel

License: MIT License

TypeScript 98.82% HTML 0.20% CSS 0.64% Shell 0.01% JavaScript 0.32%
chrome-extension devtools solid-js debugger

solid-devtools's Introduction

Solid Developer Tools

Solid Developer Tools

pnpm turborepo npm

Library of developer tools, reactivity debugger & Devtools Chrome extension for visualizing SolidJS reactivity graph.

Why?

To change the way you write, debug and understand your SolidJS applications and reactivity within.

And also to experiment with ways of visualizing and interacting with Solid's reactivity graph.

Screenshot of the chrome extension

🚧 In early development. 🚧

Chrome Developer Tools extension for debugging SolidJS applications. It allows for visualizing and interacting with Solid's reactivity graph, as well as inspecting component state and hierarchy.

Should work in any application using SolidJS, including SolidStart and Astro.

>> See the guide on setting started <<

All devtools packages

Most of the present packages are not much more then just ideas and experiments. Some in progress, and some very much in progress. But few of them can help you in your work already, and a man can dream, so this is what's out there waiting:

solid-devtools

The main client library. It reexports the most important tools and connects the client application to the chrome extension.

See README for more information.

@solid-devtools/overlay

An on-page devtools overlay for debugging SolidJS Applications without a chrome extension.

See guide on setting up

@solid-devtools/logger

For debugging only the pinpoint places parts of the Solid's reactivity graph you are concerned with, right in the console you use all the time.

Provides a variaty of debugging utilities for logging the state and lifecycle of the nodes of reactivity graph to the browser console.

@solid-devtools/debugger

A runtime library, used to get information and track changes of the Solid's reactivity graph. It's a cornerstone of the rest of the packages.

Resources and prior art

A couple of resources on the topic on chrome devtools extensions:

Other devtools projects for solid and other frameworks:

solid-devtools's People

Contributors

alloyed avatar azmy60 avatar birkskyum avatar edemaine avatar github-actions[bot] avatar indeyets avatar mbarzeev avatar nightkr avatar thetarnav avatar trusktr avatar vanillacode314 avatar yume-chan avatar

Stargazers

 avatar  avatar  avatar  avatar  avatar  avatar  avatar  avatar  avatar  avatar  avatar  avatar  avatar  avatar  avatar  avatar  avatar  avatar  avatar  avatar  avatar  avatar  avatar  avatar  avatar  avatar  avatar  avatar  avatar  avatar  avatar  avatar  avatar  avatar  avatar  avatar  avatar  avatar  avatar  avatar  avatar  avatar  avatar  avatar  avatar  avatar  avatar  avatar  avatar  avatar  avatar  avatar  avatar  avatar  avatar  avatar  avatar  avatar  avatar  avatar  avatar  avatar  avatar  avatar  avatar  avatar  avatar  avatar  avatar  avatar  avatar  avatar  avatar  avatar  avatar  avatar  avatar  avatar  avatar  avatar  avatar  avatar  avatar  avatar  avatar  avatar  avatar  avatar  avatar  avatar  avatar  avatar  avatar  avatar  avatar  avatar  avatar  avatar  avatar  avatar

Watchers

 avatar  avatar  avatar  avatar  avatar  avatar  avatar

solid-devtools's Issues

Components tree view

In addition to the Structure view, (the current tree structure of the reactive owners) there should be a view representing the components hierarchy.
This will be a separate view, but it will share the same functionality as the Structure view. It may be even implemented in the same "window".
The components view will probably include HTML Elements, like the svelte's one: (just without attributes, textContent and other svelte things)

image

Signal value serialization

Signals need to be properly serialized, send, and displayed in the extension panel.
The serialization should consider two different situations:

  • serializing only a small value "preview" — if it's a literal value, send the whole thing, but complex objects could just be displayed as Object or Array or Map.
  • serializing the whole object—when user wants to extend the value and see nested properties.

Serialization should contain the type of the value.

image

image

image

image

image

Open element in the "Elements" devtools panel

The locator and the chrome extension should have the ability to open the value of an HTML element in the "Elements" devtools panel.
For example when clicking on the signal value that holds an HTML element.

Extension-Locator integration

Currently, the Locator package is its own thing, with no way to integrate it with any other tool.
The chrome extension needs to have a way to control the currently highlighted elements by the locator, and also get inputs from the locator as the user hovers/clicks on components on the page.

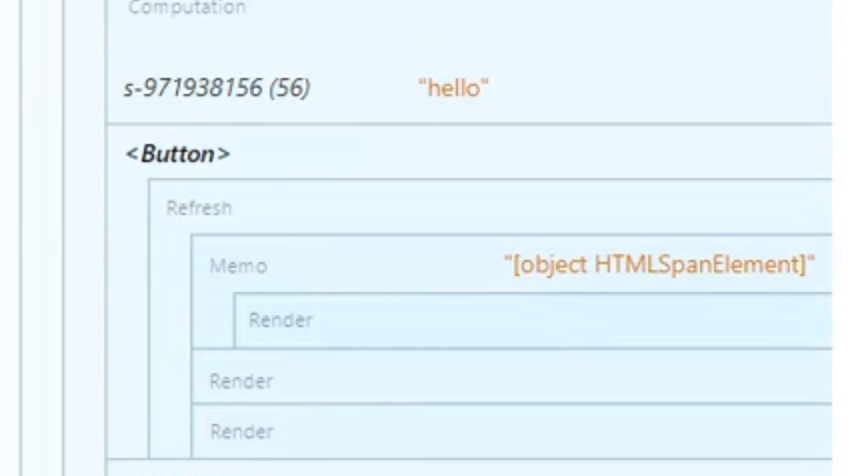
Structure view: hide Refresh nodes

The Owner tree view in the chrome extension should allow door hiding and showing types of nodes, such as Component, Memo, Render Effect, Refresh, etc.

What should happen to the signals/observes and other child nodes of the hidden node?
They could be appended to the first shown parent as their own. This should be indicated somehow.

Extension: Side Panel

Clicking on a graph node should open up a side panel with more details about it.
The side panel will be used for all sorts of things beyond that. But first, we need to implement the container itself, and everything involved with its functionality: resizing, opening/closing, scrolling/navigation inside the panels.

Some resources that might help with that:

Sources and Observers visualization

Sources and Observers visualization

Sources and Observers visualization

The Owner Tree view should include information about signal observers (dependents) and computation sources (dependencies).
Appropriate source and observer nodes will be highlighted while hovering a computation/signal node.

Implementation tasks:

  • including the data on sources and observers in the mapped owner tree
  • including the data on sources and observers while creating new reactive nodes & reconciling existing ones
  • logic for capturing hovered node and selecting appropriate sources/observers when hovering
    • ensuring this is done in a performant way (createSelector might come handy)
  • modifying the UI to highlight selected nodes

Go to component's source code from the chrome extension.

Currently, the source code information is assigned only to HTML elements in the JSX. And the Locator is only able to open the source code. The chrome extension should also have that ability, but for Component functions, not jsx elements.

Memos without signal values

The panel has to be loaded before the page for the signal values to be sent. (For efficiency reasons they are only being sent for the first time as the node is created)
Values have to be sent during forceUpdate or just on panel visibility.

Breaks in Safari

When using DevTools with Safari, it's throwing an TypeError: Illegal constructor error:

export const sheet = cssomSheet({ target: new CSSStyleSheet() })

var sheet = cssomSheet({ target: new CSSStyleSheet() });

image

It's not supported in Safari yet - not a biggie for me, using a different browser for main development but found this when debugging another issue in Safari.

Locator: better support for custom URLs

For example to be able to target Github URLs, like this: https://github.com/thetarnav/solid-devtools/blob/main/packages/debugger/src/index.ts#L51

The path that is provided to the function, should be relative to the project root, rather than absolute, as it is currently.

Reattach detached roots to the owner tree

When you use createRoot inside some reactive owner, the newly created owner is not added to the owned array of parent owner. Which prevents from walking down the owner tree from root to leafs, the created root is completely detached from that tree. And when both and are using createRoot internally, the application tree could easily be sliced.
I'm aware that the owned array is for computations, rather than owners.
But is there another way to get to these "detached owners" walking downwards?

An example: https://codesandbox.io/s/detached-createroot-qljfj8

From solidjs/solid#860

But is there another way to get to these "detached owners" walking downwards?

Since is appears that there isn't, we need an additional helper hook that will help the debugger find and reattach a root's owner to it's detached parent.

import { reattachOwner } from "solid-devtools";

createRoot(dispose => {
   // This Owner doesn't exist as far as it's parent is concerned

   // Reattach the Owner to the tree:
   reattachOwner();
});

This means that every time you use <For>, or just createRoot, you'd have to call reattachOwner for it to appear in the devtools. This also includes various reactive primitives that use createRoot internally, e.g. createLazyMemo.

The reattachOwner would be a noop in production/server env.


Effects of "reattaching detached roots":

Using Looping Control Flow components (<For>, <Index>, <Key>) won't slice up the application, and computations created under createRoot for early disposing will be visible on the graph.
This is great, but there is one important detail to consider — the reattached root works differently than the rest of nodes of the owner tree:
The context state is available to it — inherited from "detachedOwner" — so placing it in the correct place in the tree would be beneficial for indicating that.
But it doesn't dispose in the same way — instead of being disposed of when a computation higher in the tree reruns, it can be disposed of whenever, after, before, or with its owner.

So, how to present it as a part of the tree, but also not really?
And most importantly — how to listen to its disposal?
The reattachOwner hook could register an onCleanup callback, but if reattaching detached roots would be implemented as a part of solid, I would probably have to monkeypatch the cleanups array — which is fine.

Better support for HMR

Currently, the debugger and the devtools panel don't account for HMR.
I don't know how far the possible errors can go, but one noticeable behavior is that existing signals are duplicated — new signal objects are probably created during the refresh. And the reconciler doesn't allow for existing signals to be removed (I don't think it's possible).

One solution could be to just force update the whole graph on refresh and don't reconcile it — treat it as a fresh one. But how to know when the HMR happened?

Or try to reconcile new signal objects during waking the owner tree in the debugger. What the solid-refresh/vite does to the graph?

Edit: apparently this was caused by Solid not cleaning sourceMap property computation rerun. (fixed by solidjs/solid#1024)

Logger: `debugProps` hook

A hook for debugging props is missing from the currently available hooks in the logger package.
Props aren't really a part of the reactivity graph in a way we as developers think about them.
But an option to debug them will still be useful in my opinion.

Such a hook could provide the following information:

  • Are the props static or dynamic? (a proxy or an object with getters?)
    • When new props are added or removed from the object.
  • If it's static, which props are getters and which props are just non-reactive values.
    • What signals will you subscribe to if you read their value?
  • When the props change their value and what is observing them. (potentially could copy or reuse some of the debugSignal logic)

Babel plugin feature: automatically name signals/memos

If you don't put { name: "the name of my signal" } to createSignal options, you'll get an automatically generated name like c-1-2-1-1-1-1-1-0 in the devtools (the extension/logger/ anything else). This is because the signal/computation nodes are created before they are assigned to variables. Solid doesn't have a way to get the name of a given node in any other way than generating it automatically.
So a babel plugin would be handy here to automatically put those names based on the variable name.

e.g.

import { createSignal, createMemo, createStore } from "solid-js";

const [count, setCount] = createSignal(0);
// v v v v v v v v v v v v v
const [count, setCount] = createSignal(0, { name: "count" });

const count = createSignal(0);
// v v v v v v v v v v v v v
const count = createSignal(0, { name: "count" });

const double = createMemo(() => {...});
// v v v v v v v v v v v v v
const double = createMemo(() => {...}, { name: "double" });

const [state, setState] = createStore({...});
// v v v v v v v v v v v v v
const [state, setState] = createStore({...}, { name: "state" });


import * as Solid from "solid-js";

const [count, setCount] = Solid.createSignal(0);
// v v v v v v v v v v v v v
const [count, setCount] = Solid.createSignal(0, { name: "count" });

const count = Solid.createSignal(0);
// v v v v v v v v v v v v v
const count = Solid.createSignal(0, { name: "count" });

const double = Solid.createMemo(() => {...});
// v v v v v v v v v v v v v
const double = Solid.createMemo(() => {...}, { name: "double" });

const [state, setState] = Solid.createStore({...});
// v v v v v v v v v v v v v
const [state, setState] = Solid.createStore({...}, { name: "state" });

This is something I won't be able to do by myself easily, so any help from somebody experienced with babel would be great :)

Attach the debugger in the extension content script

After meging #25 users don't have to wrap their application with <Debugger> components, for it to be tracked.
Because of this, it should be theoretically possible to inject the debugger script (that attaches the debugger into the reactive graph) with the extension's content script.

Runtime npm library will still be available, and useful for some cases—for example configuring or adding babel plugins.

Track fine grain updates to stores

Currently the debugSignal, debugOwnerSignals, etc. aren't trying to handle stores specially.
In effect, debugging stores is hard or impossible.

Stores are problematic is many ways for debugging:

  • signals for properties are created only if the property is read, meaning that or I would have to read all of the keys to track them (which could affect the performance of the application in development, and provide an untrue insights, because this behavior of stores is by design) or possibly, not be able to correctly track the store state.
  • the property signals aren't added anywhere to the graph as far as I can see. So getting to them could be a challenge without changing solid code.
  • stores doesn't seem to be care about signal names, and as there is no API provided to the users to name them. Users could be stuck looking at weird, meaningless names.

Locator tagetIDE does not work

I've configured the Locator well, making sure that the Babel transform plugin is set with jsxLocation to true -

plugins: [
        devtoolsPlugin({
            jsxLocation: true,
            name: true,
        }),
        solidPlugin(),
    ],

and in the main application I'm using the locator plugin, both with "vscode" and with a callback function, and both do not work.

import {useLocatorPlugin} from 'solid-devtools';

useLocatorPlugin({
    targetIDE: 'vscode',
});

I see the highlight on my components in the page, with the component's name, but clicking it does nothing...
Also if I open and inspect the elements on the page I see that appended "data-source-loc" with the right data.
There are no console or extension's errors that I see.

Thanks.

debugger serializes unused information

Currently, the walker in the debugger package is always serializing all the data.
Even stuff like signal values that are required only initially (later signals are updated separately) are mapped and included in the message sent to the extension.
Figuring out a way to cut unused information out of the walker could save some CPU time.
There are some tricky parts though:

  • Logic for figuring out whether values should be included or not will have its cost too. The optimization may end up not helping at all.
  • The extension isn't the only consumer of the debugger. Other utilities should also get a hold of the required data. What is unused for the extension, may be needed for other APIs.

Issue caused by the previous attempt at this: #3

Component debugger hook

A hook similar to useTilg for react would be a very useful and quick to use tool that will come especially handy during the development of the chrome extension. A hook like that would already provide information about the component state — useful for trying to localize bugs or problems with reactivity.
It would be a part of the solid-devtools npm library, as one is already required to run the devtools extension anyway.

The hook could be named createComponentDebugger or useComponentDebugger for now. (There is no need to reuse the "tilg" name, it's not idiomatic in solid community)

useComponentDebugger(props)

It should provide such information to the user:

  • Lifecycle — when the component gets mounted/unmounted.
  • Props — initial values and later updates (these would have to be passed explicitly as an arg)
  • Signals — initial values and later updates
  • Batching — signal updates should account for batching, if two signals change at the same time — the user should know.
  • Rerenders — instead of a whole component, in solid only specific parts of the JSX rerun. So it's important to make it clear what part of the dom exactly rerendered.
  • Computation reruns
  • New signals/computations — this is rather rare, but it is possible to add signals/computations to the owner after it's setup. (with runWithOwner)

Additional features

  • "open in vscode" link — having a quick link to go to the appropriate component in the code editor would be super useful when debugging multiple components at once.
  • Option to limit/pick what evackly get's to be logged out — to not spam the console with unimportant information.

Important: We should make sure that this can be used along with the extension.

Locate Component in Code

Utility for opening a selected component in the code editor. Inspired by https://www.locatorjs.com
This could work as a separate plugin that user would enable by installing a specific function under the Debugger component.
It would use the component tree provided by the Debugger to localize and identify components on page.
By default you'd enter the mode of selecting components by pressing a specific keyboard shortcut. This could potentially be modified to be triggered by other means.
This utility would have to include on page overlay element that would be displayed over hovered component.

Version synchronisation

Since the Chrome Extension is managed completely separately from npm packages — this could very easily lead to version mismatches and bugs because of that.
There needs to be an automatic version checker the would display a warning in the console, asking to update the npm package/extension, depending on which has a lower version.
The extension and extension-adapter should be a noop in a mismatch.

Support Vite 3

With the recent Vite 3 release, some plugins such as the babel plugin have a peer dependency on Vite 2: https://github.com/thetarnav/solid-devtools/blob/main/packages/babel-plugin/package.json#L52

An error will be thrown during installation:

npm i @solid-devtools/babel-plugin -D      
npm ERR! code ERESOLVE
npm ERR! ERESOLVE unable to resolve dependency tree
npm ERR! 
npm ERR! While resolving: [email protected]
npm ERR! Found: [email protected]
npm ERR! node_modules/vite
npm ERR!   dev vite@"^3.0.2" from the root project
npm ERR! 
npm ERR! Could not resolve dependency:
npm ERR! peer vite@"^2.9.12" from @solid-devtools/[email protected]
npm ERR! node_modules/@solid-devtools/babel-plugin
npm ERR!   dev @solid-devtools/babel-plugin@"*" from the root project

Esbuild Plugin

The majority may use vite, but there still will be tools and frameworks that aren't built on top of it. (e.g. Rigidity)

debugger: observe the details of a single node individually

When you click on a graph node in the chrome extension—a details panel should open, revealing the details of that node:

  • type of the node
  • breadcrumbs - mini path to the node
  • signals declared in it
    • their observers and sources
  • stores (#42)
    • their observers and sources as well (this may be too complicated to do for now)
  • current and previous value (only if the node is a computation)
  • sources (only if the node is a computation)
  • observers (only if the node is a memo)
  • rendered HTML element if node is a component
  • component props (#56)

Signals & stores can be listened to only if node details are being observed—no need to send them otherwise.

Hide autogenerated node names from the tree view

Seeing all those c-1-12-3-123-12 names isn't helpful. Adding #30 will prevent them from appearing too often, but some nodes won't be able to be automatically named here or there. Render effects especially.
So what's left should just be hidden to not hurt the user's eyes. And displayed only in the details panel—if the user wants to have something to identify the node by. In the logs for example.

image

Logger: long owner names

As by default owners have their names generated by solid, (and sometimes only — render effects in jsx) the names logger to the console by the logger library can easily become too long, covering a bigger part of the console.

Renaming owners using a babel plugin in some more human way could be one solution, but it's not ideal. And doesn't cover all cases — roots cannot be renamed.

Alternatively, I could trim the names, and display them as c-1-2-1-1-1-1... to save some space. As these auto-generated names aren't usually telling much to the users anyway.

debugger: track component props

The debugger needs a way to track component props. Since they do not exist as an instance in the reactive graph, a special hook is necessary to track them. Later to be automatically injected by a babel transform.

The tricky part here is not necessarily getting to the props object—it'll be done one way or another—but "subscribing" to the properties without interfering with the reactive graph.

The props object could probably be added to the owner object when the component is created in dev. (so no babel plugin for this one)
Then the props object would be mapped for the selected component every time the walker executes—instead of tracking the props signals with computations. This is to avoid interfering with the reactive graph by reading memos/signals in a tracking context. Lazy memos would over-execute, and the new pull-push mechanic in 1.5 would be messed with here as well. Parsing the props outside of the queue and untracked should reduce any potential issues.

TODO:

Update Graph only when Panel is opened.

Walking, mapping, and sending the graph updates when the panel isn't in view is very wasteful.
We are already listening for PanelVisibility events.
We only need a way to stop/resume updating the graph on changes.

GraphUpdate triggered by internal computations

Currently, the walking of the owner tree and triggering a "graph update" is caused by listening to window._$afterUpdate.
"afterUpdate" is called after any computation in the system runs, including computations that are part of the debugger itself.
This can be:

  1. un-performant — changes in the debugger internals aren't valuable for the users, and hence should be ignored.
  2. leading to infinite loops, where the internals cause graph update and listen to it.

This could be considered a limitation of solid-js as there is no other way to listen to updates more precisely — while being performant about it.
It would be much more convenient to have an afterUpdate that is scoped to the given owner. Working similarly to the context would be available down the owner tree.

const owner = getOwner()!;
owner._$afterUpdate = () => console.log("scoped update!");

A temporary solution to avoid those updates would be to switch from listening to window._$afterUpdate, to triggering graph updates on computation updates.
This would mean that the computations need to be always wrapped, even if there isn't a consumer for information about precise computation updates. And additionally updating the graph would happen periodically e.g. every 1s.

Recommend Projects

  • React photo React

    A declarative, efficient, and flexible JavaScript library for building user interfaces.

  • Vue.js photo Vue.js

    🖖 Vue.js is a progressive, incrementally-adoptable JavaScript framework for building UI on the web.

  • Typescript photo Typescript

    TypeScript is a superset of JavaScript that compiles to clean JavaScript output.

  • TensorFlow photo TensorFlow

    An Open Source Machine Learning Framework for Everyone

  • Django photo Django

    The Web framework for perfectionists with deadlines.

  • D3 photo D3

    Bring data to life with SVG, Canvas and HTML. 📊📈🎉

Recommend Topics

  • javascript

    JavaScript (JS) is a lightweight interpreted programming language with first-class functions.

  • web

    Some thing interesting about web. New door for the world.

  • server

    A server is a program made to process requests and deliver data to clients.

  • Machine learning

    Machine learning is a way of modeling and interpreting data that allows a piece of software to respond intelligently.

  • Game

    Some thing interesting about game, make everyone happy.

Recommend Org

  • Facebook photo Facebook

    We are working to build community through open source technology. NB: members must have two-factor auth.

  • Microsoft photo Microsoft

    Open source projects and samples from Microsoft.

  • Google photo Google

    Google ❤️ Open Source for everyone.

  • D3 photo D3

    Data-Driven Documents codes.