Git Product home page Git Product logo

vscode-trace-extension's Introduction

VSCode Trace Extension

This project started from the vscode webview react project. It works this way, with the extension itself being in the vscode-trace-extension directory and the react application being in the vscode-trace-webapps directory.

๐Ÿ‘‹ Want to help? Read our contributor guide and follow the instructions to contribute code.

Installation instructions

The code was migrated from the PR in theia-trace-extension.

It depends on the trace viewer plugins from the theia trace extension package and the tsp typescript client, as well as the timeline chart. They are all available from the NPM package registry.

  • timeline-chart
  • traceviewer-base
  • traceviewer-react-components
  • tsp-typescript-client

To build the vscode extension, run the yarn command:

yarn

Running the extension

Then from vscode, press f5 to run the extension. The trace server needs to be started separately as described here.

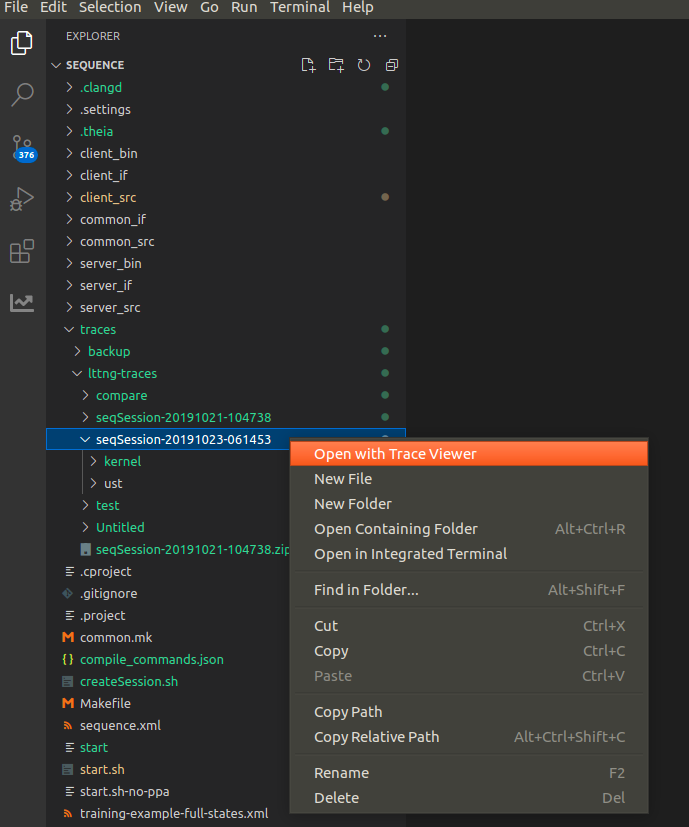
To open a trace use the VSCode file explorer to navigate to the trace directory. Then right mouse click on the trace and select menu option Open with Trace Viewer. See here to get some sample traces.

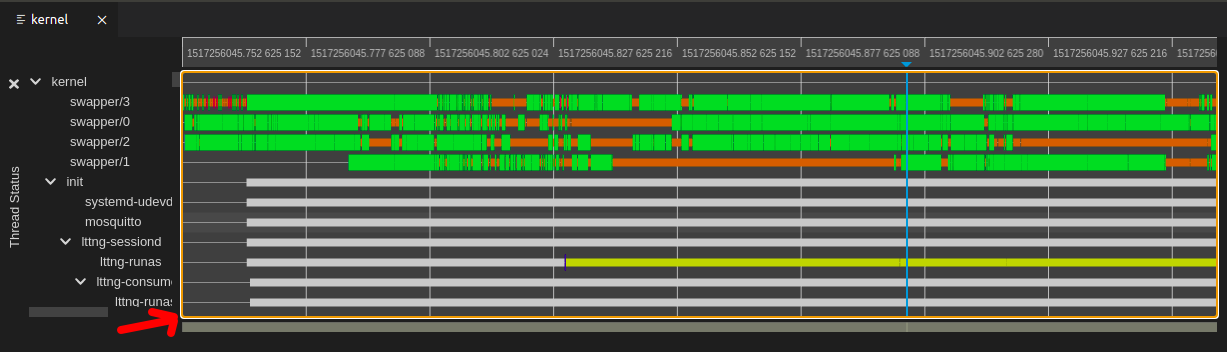
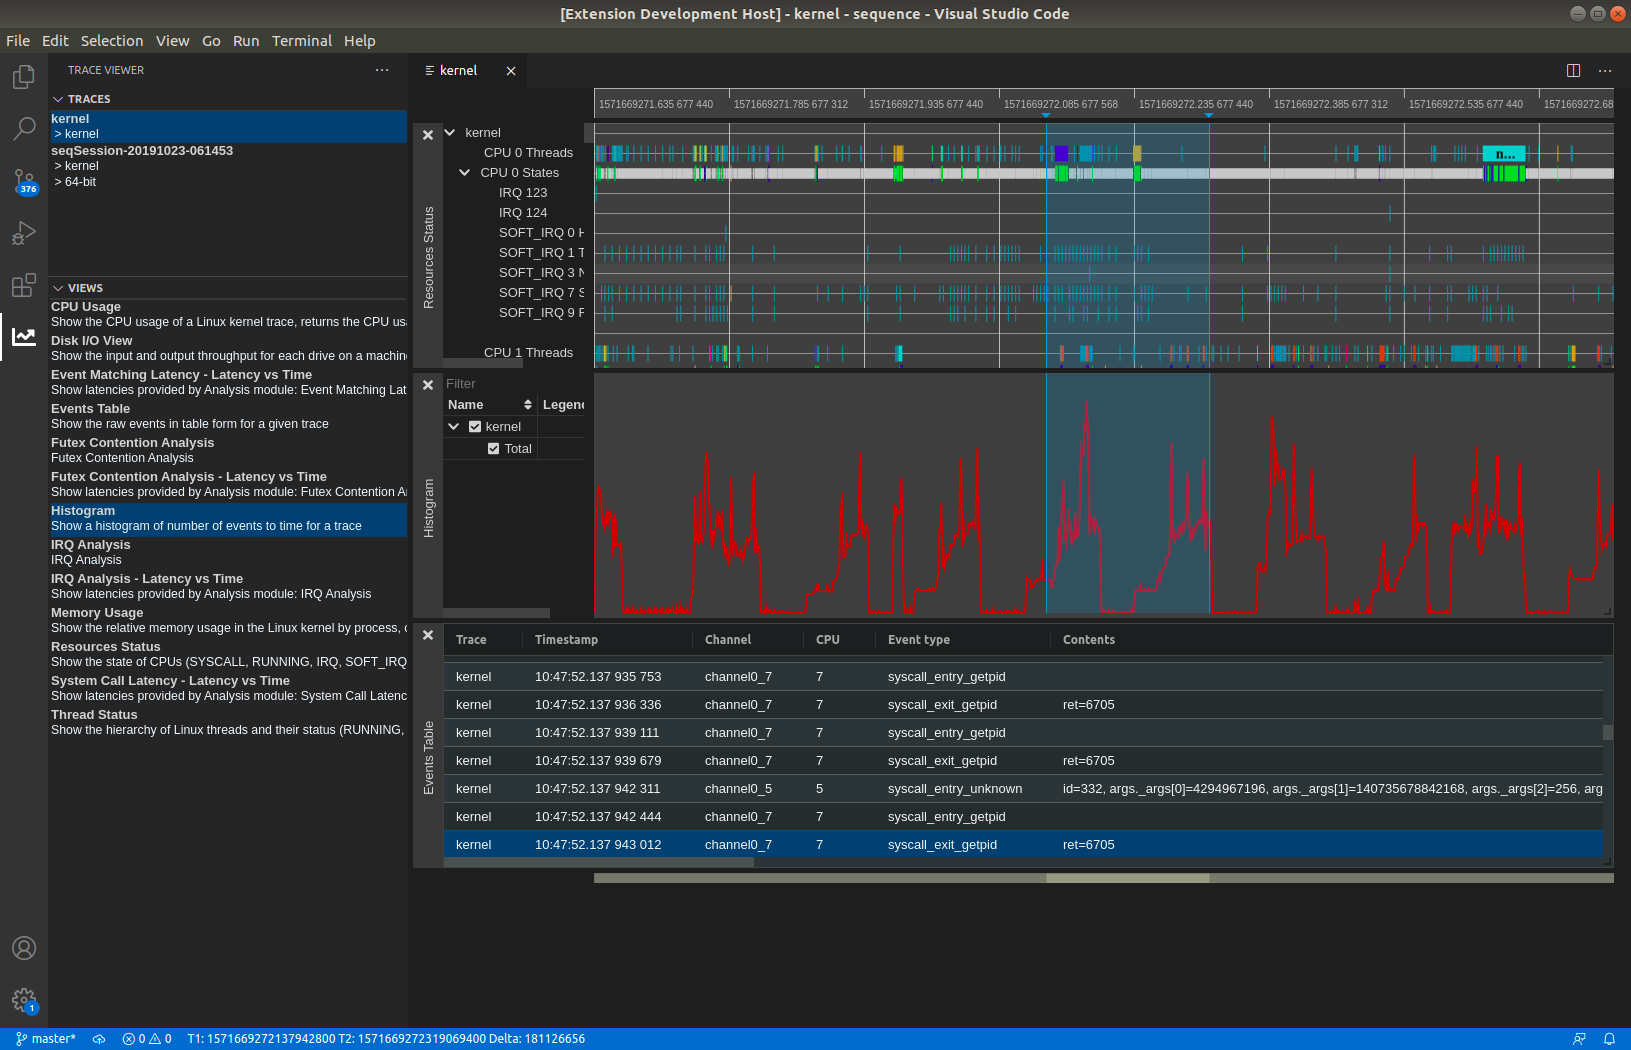
Open the Trace Viewer view (View -> Open view...).

open-trace

2 tabs will be visible: Traces and Views. The Traces tab will show all available traces on the trace server.

The Views tab shows all the available views for the selected trace. Click on a view to open the view under the timeline.

open-output

Package as VsCode extension

To package it as VsCode extension, run the command yarn vsce:package. If you get errors about case-sensitive files, just delete the node_modules folder and run yarn again.

The packaging will produce a vscode-trace-extension-x.x.x.vsix file in the subdirectory vscode-trace-extension of the repository.

Running the extension in VsCode, VsCodium or Theia application

The packaged VSIX file can be installed in an existing VsCode, VsCodium or Theia application by using Install from a vsix.

The trace server needs to be started separately as described here.

Running the extension in the Theia Trace Viewer example app

The packaged VSIX file can be run in the example app of the theia-trace-extension. For this the file can be can be symlinked in the plugins of the example app of theia-trace-extension repository.

cd <theia-trace-extension root>/examples/plugins
ln -s <vscode-trace-extension root>/vscode-trace-extension-x.x.x.vsix ./

Developing the extension

When having to modify the code of the extension (in the vscode-trace-extension folder), one can simply run the yarn command. It is also possible to watch for changes to have no manual steps to do before re-running the extension: yarn watch or ctrl-shift-b and select the task npm: watch - vscode-trace-extension.

For changes in the webview part (in the vscode-trace-webviews folder), you can run the yarn command, simply re-opening a trace should show the changes. It is also possible to watch for changes with yarn watch or ctrl-shift-b and selecting the task npm: watch - vscode-trace-webviews.

For more information about VsCode WebView API see here.

Communication between components

To communicate between VsCode extension and webviews use the VsCode message API. When using vscode.postMessage(data) data structure data will be serialized to JSON before being propagated. Be aware that it cannot include data structures like BigInt. Proper handling of such data structures need to be implemented when sending and receiving messages.

Inside a webview or inside the extension signals can be used where data structures can be passed on.

The following sequence diagram shows how the experiment-selected signal (with payload Experiment) is propagated inside the application. The webview Opened Traces WebView App is sending the signal to theVsCode extension which is forwarding the signal to the Available Views WebView App.

sequenceDiagram
    actor User
    participant reactOpenTraces as ReactOpenTracesWidget
    participant explorerOpenTraces as TraceExplorerOpenedTraces
    participant exOpenTraceProvider as TraceExplorerOpenedTracesViewProvider
    participant exViewsAvailProvider as TraceExplorerAvailableViewsProvider
    participant explorerAvailView as TraceExplorerViewsWidget
    participant reactAvailViewsexplorerOpenTraces as ReactAvailableViewsWidget
    participant server as Trace Server
    User->>reactOpenTraces: click on trace
    Note over reactOpenTraces,explorerOpenTraces: Opened Traces WebView App
    Note over exOpenTraceProvider,exViewsAvailProvider: VsCode extension
    Note over explorerAvailView,reactAvailViewsexplorerOpenTraces: Available Views WebView App
    reactOpenTraces->>explorerOpenTraces: sendSignal(exp-sel)
    explorerOpenTraces->>exOpenTraceProvider: vscode.postMessage(exp-sel)
    exOpenTraceProvider->>exViewsAvailProvider: sendSignal(exp-sel)
    exViewsAvailProvider->>explorerAvailView: vscode.postMessage(exp-sel)
    explorerAvailView->>reactAvailViewsexplorerOpenTraces: sendSignal(exp-sel)
    reactAvailViewsexplorerOpenTraces->>server: fetchOutputs(exp)
    server->>reactAvailViewsexplorerOpenTraces: success(200)
    reactAvailViewsexplorerOpenTraces->>reactAvailViewsexplorerOpenTraces: visualize availableViews

Debugging the extension

It is straightforward to debug the code of the vscode extension itself (the code in vscode-trace-extension) by just putting breakpoints in vscode and running the extension with f5.

The react-app is another matter. The panel is a webview that is running in its own context, so current vscode does not have access to it. (Patches welcome!)

Each panel is its own small web application, so to debug, while in the context of the webview, press ctrl-shift-p and enter the command Developer: Open Webview Developer Tools. This will open the developer tools. The code is in the Sources tab of the developer tools window that opens.

Logging in the extension

The extension uses an output channel for logging. To view the logs, navigate to the output panel. The output panel can be accessed by navigating to view -> open view -> type 'output'. To open the extension output channel, navigate the drop down option and look for Trace Extension. An alternate way of opening the trace extension output channel is through command palette. Open command palette by pressing ctrl-shift-p, and then run Output: Show Output Channels...\. This will prompt a list of available outputs. Select Trace Extension from the list of available outputs.

For logging to the Trace Extension output channel, use the traceLogger object instantiated in extension.ts. The following are examples of using the log channel:

traceLogger.addLogMessage('Hello from trace extension without tag');

This will add the following log entry in the output channel:

[2023-04-25 11:07:22.500] Hello from trace extension without tag
traceLogger.addLogMessage('Hello from trace extension with tag', 'tag');

This will add the following log entry in the output channel:

[2023-04-25 11:08:40.500] [tag] Hello from trace extension with tag

Troubleshooting

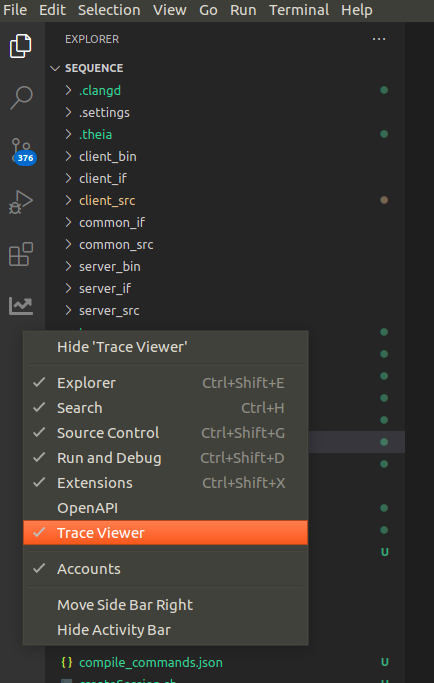
*The Trace Viewer panel is not there, or disappears when switching panel.

Right-click on the vscode activity bar and make sure Trace Viewer is checked.

trace-explorer-activity-bar

Run the Trace Server

In order to open traces, you need a trace server running on the same machine as the trace extension. You can download the Eclipse Trace Compass server or let yarn download and run it:

yarn download:server
yarn start:server

You can also build the trace-server yourself using Trace Compass and the Incubator. Take a look at the instructions here.

Get sample traces

To get sample traces to try run the following command. The traces will be stored under the subdirectory TraceCompassTutorialTraces of the repository.

yarn download:sample-traces

Running UI tests

To run the UI tests locally, use the following commands.

Steps for setup that only need to be run once:

yarn download:sample-traces
yarn download:server
yarn download:openvscode-server
yarn configure:openvscode-server
yarn playwright install --with-deps

Steps to run once and again every time the application code is modified:

yarn
yarn vsce:package
# kill openvscode-server if running and restart it below

Steps to run once if the corresponding server is not already running:

yarn start:server & # or run in a separate shell
yarn start:openvscode-server & # or run in a separate shell

To run or re-run the tests after test code is modified:

yarn playwright test

To test in debug mode, test with tracing on, or test with retries on failure, use the following options:

yarn playwright test --debug
yarn playwright test --trace on
yarn playwright test --retries <retries>

Using the External API

VSCode Trace Extension provides an external API that adopter extensions can rely on for communication. Currently the API is limited to the following:

getActiveExperiment(): Experiment | undefined
getActiveWebviewPanels(): { [key: string]: TraceViewerPanel | undefined; }
getActiveWebviews(): vscode.WebviewView[]
onWebviewCreated(listener: (data: vscode.WebviewView) => void): void
onWebviewPanelCreated(listener: (data: vscode.WebviewPanel) => void): void

Using the API from Adopter Extensions

//The following retrieves the API object from the vscode-trace-extension
const ext = vscode.extensions.getExtension("tracecompass-community.vscode-trace-extension");
const importedApi = ext.exports;

Once you have the API object, you can proceed to make API calls. For example, if you wish to retrieve the active experiment in the Trace Viewer, the following API call can be used:

const experiment = importedApi.getActiveExperiment();

The API provides getters to retrieve the active webviews and panels. This can be useful for scenarios when webviews/panels were created before the adopter extension was activated but the adopter extension still wants to handle messages from them.

for (const webview of importedApi.getActiveWebviews()) {
    webview.webview.onDidReceiveMessage((message) => {
        switch (message.command) {
            case "webviewReady":
            console.log("From adopter extension - webviewReady signal received");
            break;
            default:
            break;
        }
    });
}

The API also provides a way to attach a listener for when webview or webview panel is created. Note that this listener will not be called for webviews and panels created before the registration of the listener. It is recommended to register the listeners during the activation of the adopter extensions.

importedApi.onWebviewPanelCreated(_panel => {
    // For newly created panel, handle messages from webviews
    _panel.webview.onDidReceiveMessage((message) => {
        switch (message.command) {
            case "webviewReady":
            console.log("From adopter extension - webviewReady signal received");
            break;
            default:
            break;
        }
    });
    _panel.onDidDispose(() => {
        console.log("panel disposed");
    });
});

As a general rule, adopter extensions should retrieve and handle the webviews and webview panels once during their activation by calling getActiveWebviews and getActiveWebviewPanels. This ensures that the webviews and panels created before the activation of the adopter extension are handled. To handle any new webviews and panels created afterwards, listeners can be registered by calling onWebviewCreated and onWebviewPanelCreated.

vscode-trace-extension's People

Contributors

bhufmann avatar dependabot[bot] avatar hoangphameclipse avatar hriday-panchasara avatar marcdumais-work avatar marco-miller avatar matthewkhouzam avatar ngondalia avatar patricktasse avatar rodrigoplp-work avatar tahini avatar williamsyang-work avatar

Stargazers

 avatar  avatar  avatar  avatar

Watchers

 avatar  avatar  avatar  avatar  avatar  avatar  avatar  avatar  avatar  avatar

vscode-trace-extension's Issues

Migrate Overview view functionality

In the recent Theia trace extension, an Overview view was added. While the TraceContextComponent can display the overview view, however the construction of this component has to be done properly to pass the default overview descriptor. Other items to verify and support:

  • Open and Close of overview view
  • Selecting of data provider for overview view
  • Menu styling

image

Contribute vscode-trace-extension repository to the Eclipse CDT-cloud project

Hello,

The Trace Compass team would like to contribute the vscode-trace-extension to the Eclipse CDT.cloud project [1] so that the further development can be done under the Eclipse open source foundation. The Eclipse CDT.cloud is already the home of the main components that are used by the vscode-trace-extension.

The goal of this project is to provide the trace-viewer capabilities as VS Code plugin so that all VS Code compatible editors like Theia, VSCodium, VS Code etc. can install and take advantage of the trace viewer functionality and not "just" Theia based products. There has been also an increasing interest of this VS Code plug-in in the community.

The vscode-trace-extension repository only contains code to integrate with VS Code APIs. All core, trace-viewing source code are provided by the Theia-independent components of theia-trace-extension [2] which are deployed to NPM [3] and [4].

I'd like to start the contribution process in the coming week(s). Please let me know if you have any questions and concerns.

Best Regards
Bernd

[1] https://github.com/eclipse-cdt-cloud
[2] https://github.com/eclipse-cdt-cloud/theia-trace-extension
[3] https://www.npmjs.com/package/traceviewer-base
[4] https://www.npmjs.com/package/traceviewer-react-components

Migrate health check

The health check functionality to check if the trace server is running needs to be migrated. Call heath check functionality before opening a trace.

Migrate support of trace/experiment opening

In the theia-trace-extension it is possible to select a directory or trace from the file explorer and execute "Open with -> Trace Viewer". After executing this the Trace Explorer is populated.

When no Trace is open, the "Open Trace" button is shown in the Trace Explorer and upon pressing the button the user can select a directory to find and open traces.

When executing that command, the command execution finds all CTF traces recursively in the directory and opens them in an experiment on the trace server. If the selection is a single file, then that file is opened as trace.

Add Item Properties view

The theia-trace-extension currently has a separate view in the explorer (left side) that populates upon selection in the graphs. For example, selecting an event in the Events Table the details will listed there. This should be supported in this project as well. An additional web-view needs to be implemented for that. Note that the traceviewer-react-components needs to provide the view implementation so that the web-view only need so use it and provide UI controls.

image

The trace tree in the trace explorer should show all openable traces

Now, only the top level directories of the workspace are shown and can be opened.

First step would be a smarter discovery of traces: go deep in the tree to locate potential traces and CTF folders and show the structure as a tree so that upper directories can be opened along with the traces underneath.

Fix style of DATA_TREE component

The style of the DATA_TREE component seems to be off and not the same as in theia-trace-extension. The styles need to fixed.

vscode-trace-extension
image

In comparison the theia-trace-extension
image

Export to CSV not working (DATA_TREE views)

Export to CSV is not working in VsCode for views of type DATA_TREE, which are, for example, be used for Latency views when using Trace Compass server. The gif shows how to trigger it, but there is no way to know if it was successful, what the filename is and where it's stored (if actually was executed)

vscode-export-cvs-bug

Support of changing the theme

Changing the light theme in VsCode doesn't pass the change on to the react-components. This needs to be implemented

vs-code-light-theme
.

Display the status of the trace server

When the theia-trace-extension shows the status of the of the server connection. When sending a back-end command, and if fails due to connection issues the status is updated to a red x. If it is successful the status is shown green. This should be provide here as well.

An additional web-view needs to be implemented for that. Note that the traceviewer-react-components needs to provide the view implementation so that the web-view only need so use it and provide UI controls.

image

vscode-trace-extension not working with latest trace-viewer depenencies

With the recent updates in the trace viewer components and its dependencies to use BigInt for timestamps, the serialization of messages between the webviews and vscode extension will fail because the standard json serializer doesn't support type BigInt.

It will fail with the following message:

TypeError: Do not know how to serialize a BigInt
/usr/share/code/resources/app/out/bootstrap-fork.js:5
stack trace: TypeError: Do not know how to serialize a BigInt
	at JSON.stringify (<anonymous>)
	at y (/usr/share/code/resources/app/out/vs/workbench/services/extensions/node/extensionHostProcess.js:89:3480)
	at g.postMessage (/usr/share/code/resources/app/out/vs/workbench/services/extensions/node/extensionHostProcess.js:96:73489)
	at TraceViewerPanel.setExperiment (/home/eedbhu/git/vscode-trace-extension/vscode-trace-extension/lib/trace-viewer-panel/trace-viewer-webview-panel.js:125:29)
	at /home/eedbhu/git/vscode-trace-extension/vscode-trace-extension/lib/trace-explorer/trace-tree.js:123:19
	at processTicksAndRejections (internal/process/task_queues.js:93:5)

For example the Experiment or Trace classes contain timestamp fields which are BigInt and causing serialization problems and the vscode trace extension to fail.

To fix this, each message send between webviews and the vscode trace extension itself need to be updated that BigInt values are serialized properly (e.g. using a string) and deserialized to BigInt on the receiving side.

This issue needs to be fixed before upgrading to the latest traceviewer components which contain many valuable improvements.

Support for view markers

The theia-trace-extension added support for viewer markers that can be retrieved from the trace server (e.g. fetchAnnotationCategories/fetchAnnotation). Make sure that this data is populated in the vscode-trace-extension. If it's currently not populated, implement the support.

Set keyboard focus on graph/table when selecting an analysis

PR 612 in theia-trace-extension (eclipse-cdt-cloud/theia-trace-extension#612) provides the following features:

  • Keyboard focus (indicated by a blue/orange border) is given to an output when its opened for the first time
  • When clicking on an analysis title in the trace tab, keyboard focus should be the analysis' graph/chart region.
  • If a View that is already open is selected in the sidebar, the View's title area should pulse to temporarily bring attention to the View panel. Keyboard focus is also given to the analysis' graph/chart region.

Not all features provided by this patch work in vscode-trace-extension. Replicate the missing functionality

Default data provider of Overview View is hard-coded

The default data provider ID of the Overview View is hard-coded to the histogram XY chart of the Trace Compass trace server. The default data provider ID should not be hard-coded, but should be configurable using a preference.

Note: The end-user has now way to know what the IDs of the available XY views are. So, the ID is probably not the best thing to have a preference for.

Add missing toolbar buttons

The trace-viewer widget toolbar is missing the following buttons: Undo, Redo, Zoom In, Zoom out, Keyboard shortcuts

Screen Shot 2023-03-16 at 3 04 01 PM

Update how component styles are defined

Right now the styles are provided by css files stored here [1]. Not all values are defined in here and need to be added.

Theia theme variables are used because the traceviewer-react-components are using these variable name. This approach work, however, we should not use Theia names here. The variables in the components should have Theia or VsCode independent names and depending on if the components run in Theia or VsCode the mapping is defined there.

[1] https://github.com/theia-ide/vscode-trace-extension/tree/master/vscode-trace-webviews/src/style.

Migrate view toolbar menus

The theia-trace-extension provides different toolbar buttons for the widget view (where the graphs are loaded). This is Theia specific and doesn't exist in the VsCode version.

To support the same functionality this needs to be added to the vscode-trace-extension.

First, it' needs to be investigated if it's the VsCode APIs allows it to add toolbar buttons. If yes, the functionality can be implemented using VsCode APIs. If not then the functionality needs to be added in a different way (maybe as part of the react-components).

Note: Move as much code to the theia-trace-extension repository in the Theia independent packages (traceviewer-react-components and traceviewer-base-components) for code-re-use purposes.

Trace Viewer widgets
image

Migrate start and stop of trace server using the backend

In the theia-trace-extension it's possible to start/stop the trace server from the Theia backend. The command Start trace server and respectively Stop trace server exist that starts/stops the trace server configured by the preferences in the theia-trace-extension. This functionality was discussed in eclipse-cdt-cloud/theia-trace-extension#53 which references the initial implementation of the feature. The start command is also triggered when trying to open a trace with the theia-trace-extension.

For the vscode-trace-extension, a similar support is needed to start/stop the server for both the local and remote cases.

Note: Installing the vscode-trace-extension in VsCode and Theia applications should work by the update.

Also supporting a TRACE_SERVER_URL environment variable is out of this scope for now, if ever required (not yet).

Fix support for resizing of charts

When resizing the application then the graph is not updating it's size. Also, resizing each graph vertically using the botton-right corner is not available.

resize-chart-vscode

Recommend Projects

  • React photo React

    A declarative, efficient, and flexible JavaScript library for building user interfaces.

  • Vue.js photo Vue.js

    ๐Ÿ–– Vue.js is a progressive, incrementally-adoptable JavaScript framework for building UI on the web.

  • Typescript photo Typescript

    TypeScript is a superset of JavaScript that compiles to clean JavaScript output.

  • TensorFlow photo TensorFlow

    An Open Source Machine Learning Framework for Everyone

  • Django photo Django

    The Web framework for perfectionists with deadlines.

  • D3 photo D3

    Bring data to life with SVG, Canvas and HTML. ๐Ÿ“Š๐Ÿ“ˆ๐ŸŽ‰

Recommend Topics

  • javascript

    JavaScript (JS) is a lightweight interpreted programming language with first-class functions.

  • web

    Some thing interesting about web. New door for the world.

  • server

    A server is a program made to process requests and deliver data to clients.

  • Machine learning

    Machine learning is a way of modeling and interpreting data that allows a piece of software to respond intelligently.

  • Game

    Some thing interesting about game, make everyone happy.

Recommend Org

  • Facebook photo Facebook

    We are working to build community through open source technology. NB: members must have two-factor auth.

  • Microsoft photo Microsoft

    Open source projects and samples from Microsoft.

  • Google photo Google

    Google โค๏ธ Open Source for everyone.

  • D3 photo D3

    Data-Driven Documents codes.