(currently chkservdReport.sh)
cPanel's Tailwatch produces a strange log with details about service checks, formatted in an almost unreadable manner. My goal for this project is to have a tool that can parse through the log and produce a human-readable report of when services went down, how long they were down for, what it took to get them running again, and so forth.
Usage:
Usage: ./chkservdReport.sh -f<filename> [<additional arguments>]

If you wish to pass the arguments in any order, you must omit the space after the flag letter.

(e.g. -fchkservd.log -m500M -n100000)

By default, -n is set to 10000 (this will go back several days).

Required arguments
-f	filename of chkservd logfile

Optional arguments
-n	number of lines to read from the end of the file (default 10000, pass 0 for unlimited)
-m	manually set the memory_limit - be careful with this! ( e.g. -m128M )

Verbosity and visual options (these are optional arguments)

-vt	Show timeline event explanations
-vp	Show when we reach each step in script execution.
-vc	Colorize output regardless of whether it is entering a pipe to a file/second program or not.
Screenshots:
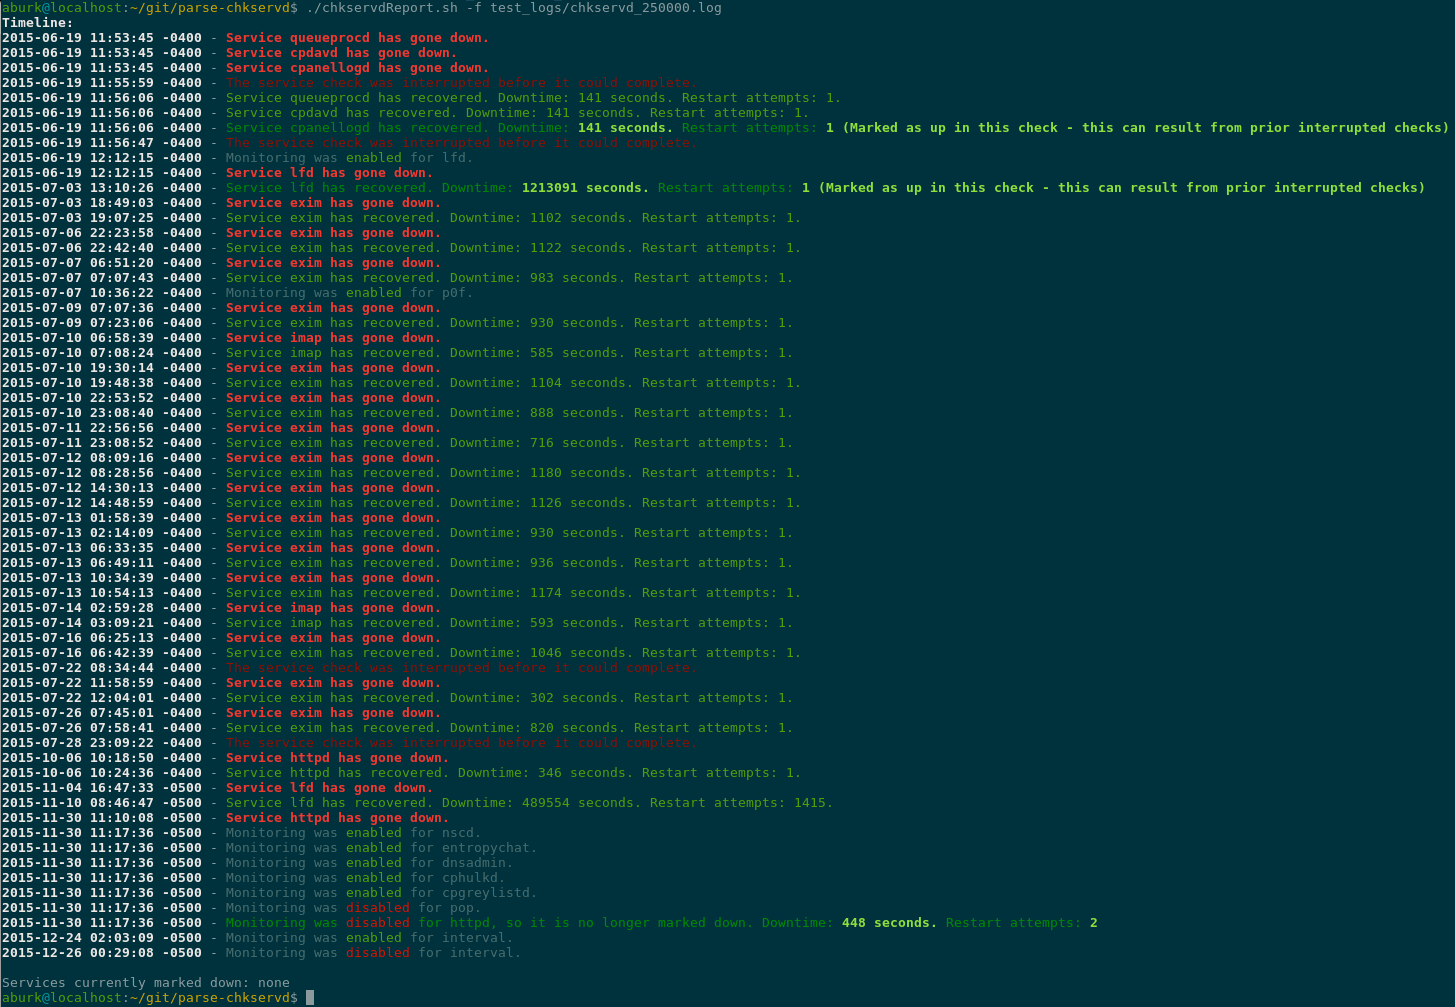
Normal output for parsing a log file:
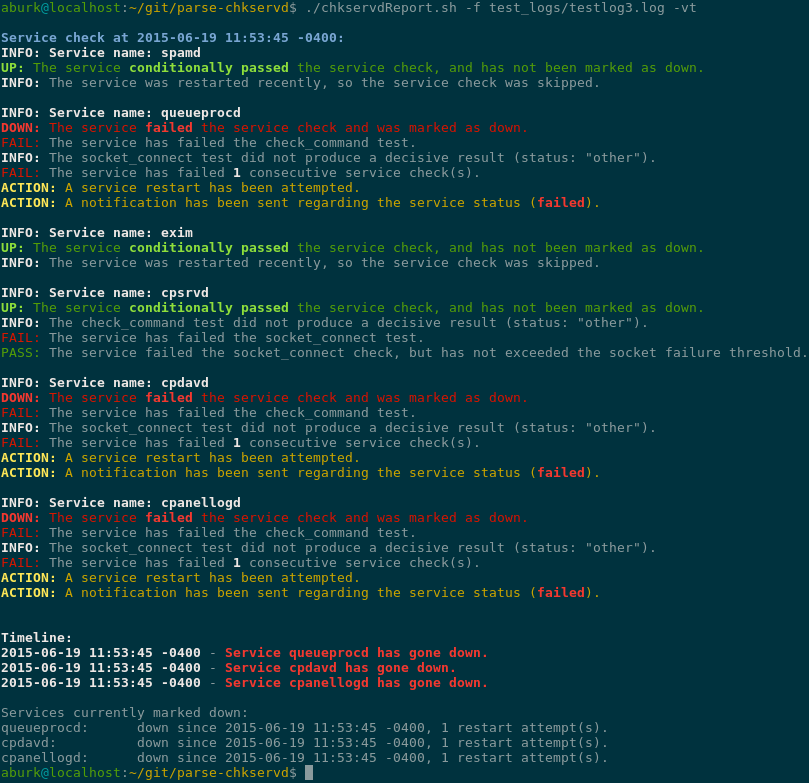
Example of timeline event explanations:
To Do:
- Add timeline entry for large gaps between log entries (e.g. if chkservd is disabled or something)
- Check/test with new chkservd format to see if things are still working properly