Create a live-updating application that scrapes flight data from the web
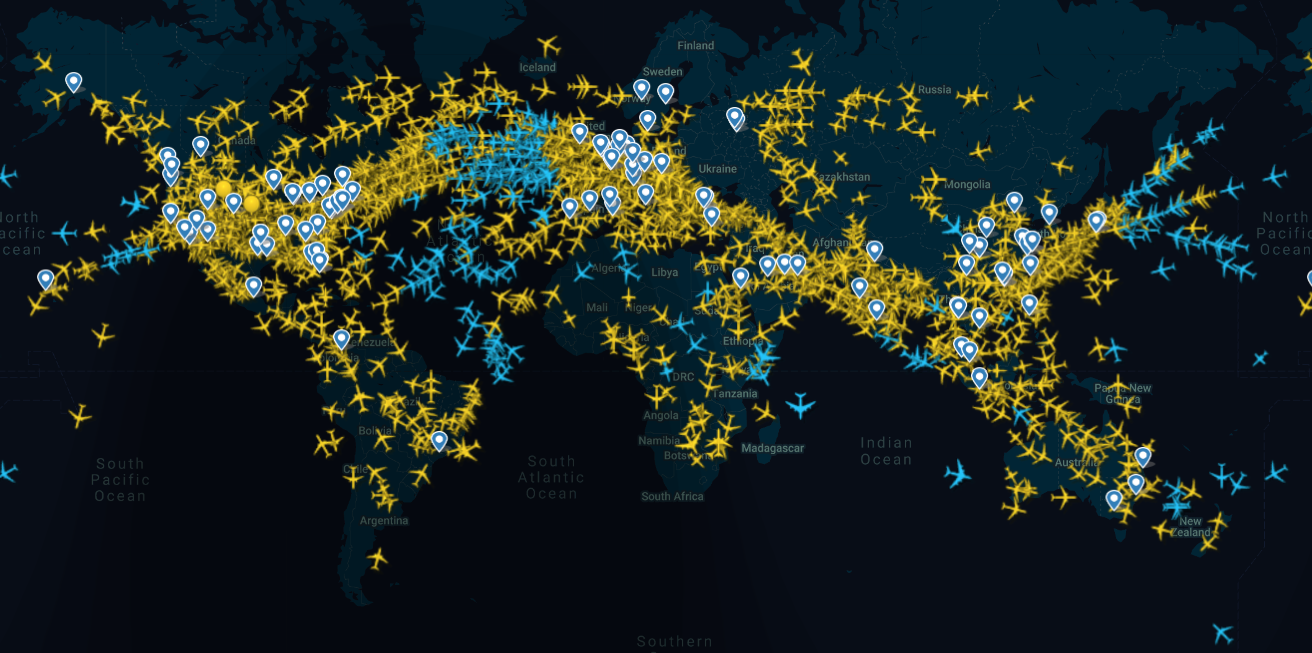
In this next example I’ll scrape a website that updates every eight seconds. The site https://www.flightradar24.com receives flight data from around the world and continually updates its page by plotting real time flight data on top of Google maps. The data I care about is only going to be the total number of active flights worldwide. This is shown in the upper left corner of the screen, right next to the number of flights contained in the current view. It’s worth noting that flightradar24 data arrives from a number of sources, including radar stations (ADS-B, FLARM, MLAT, FAA) as well as estimated numbers
- Plotly's website: Demos/Galleries/Documentation
- flightradar24 site: scraped site used in this project

- Beautiful Soup Documentation
import datetime
import dash
from dash import dcc, html
import plotly
from dash.dependencies import Input, Output
# pip install pyorbital
from pyorbital.orbital import Orbital
satellite = Orbital('TERRA')
external_stylesheets = ['https://codepen.io/chriddyp/pen/bWLwgP.css']
app = dash.Dash(__name__, external_stylesheets=external_stylesheets)
app.layout = html.Div(
html.Div([
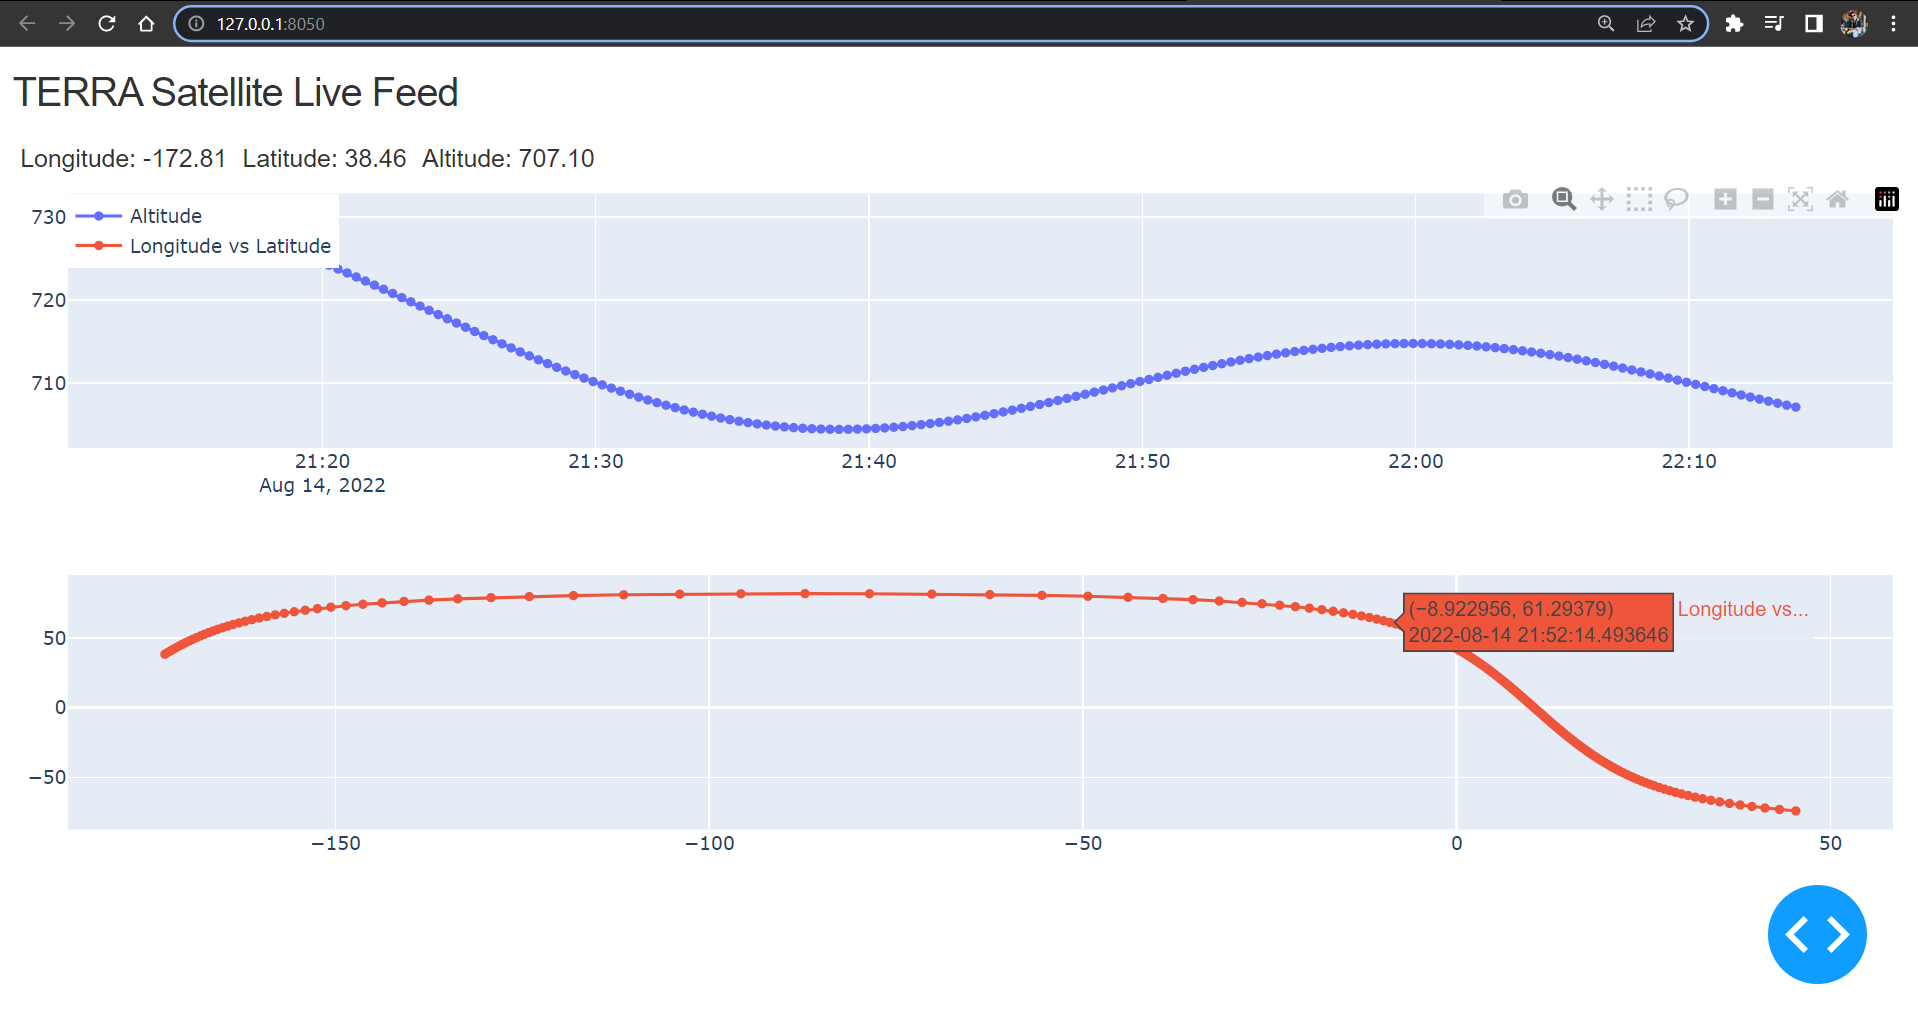
html.H4('TERRA Satellite Live Feed'),
html.Div(id='live-update-text'),
dcc.Graph(id='live-update-graph'),
dcc.Interval(
id='interval-component',
interval=1*1000, # in milliseconds
n_intervals=0
)
])
)
@app.callback(Output('live-update-text', 'children'),
Input('interval-component', 'n_intervals'))
def update_metrics(n):
lon, lat, alt = satellite.get_lonlatalt(datetime.datetime.now())
style = {'padding': '5px', 'fontSize': '16px'}
return [
html.Span('Longitude: {0:.2f}'.format(lon), style=style),
html.Span('Latitude: {0:.2f}'.format(lat), style=style),
html.Span('Altitude: {0:0.2f}'.format(alt), style=style)
]
# Multiple components can update everytime interval gets fired.
@app.callback(Output('live-update-graph', 'figure'),
Input('interval-component', 'n_intervals'))
def update_graph_live(n):
satellite = Orbital('TERRA')
data = {
'time': [],
'Latitude': [],
'Longitude': [],
'Altitude': []
}
# Collect some data
for i in range(180):
time = datetime.datetime.now() - datetime.timedelta(seconds=i*20)
lon, lat, alt = satellite.get_lonlatalt(
time
)
data['Longitude'].append(lon)
data['Latitude'].append(lat)
data['Altitude'].append(alt)
data['time'].append(time)
# Create the graph with subplots
fig = plotly.tools.make_subplots(rows=2, cols=1, vertical_spacing=0.2)
fig['layout']['margin'] = {
'l': 30, 'r': 10, 'b': 30, 't': 10
}
fig['layout']['legend'] = {'x': 0, 'y': 1, 'xanchor': 'left'}
fig.append_trace({
'x': data['time'],
'y': data['Altitude'],
'name': 'Altitude',
'mode': 'lines+markers',
'type': 'scatter'
}, 1, 1)
fig.append_trace({
'x': data['Longitude'],
'y': data['Latitude'],
'text': data['time'],
'name': 'Longitude vs Latitude',
'mode': 'lines+markers',
'type': 'scatter'
}, 2, 1)
return fig
if __name__ == '__main__':
app.run_server(debug=True)